




Ethereum (ETHUSD) Is up 1.02% on Jul 15: What Do On-Chain Data and Market Sentiment Show?
Ethereum (ETHUSD) is up 1.02% at Jul 15 08:40(ET), now at $1891.96, with a 7-day up of 9.11%.
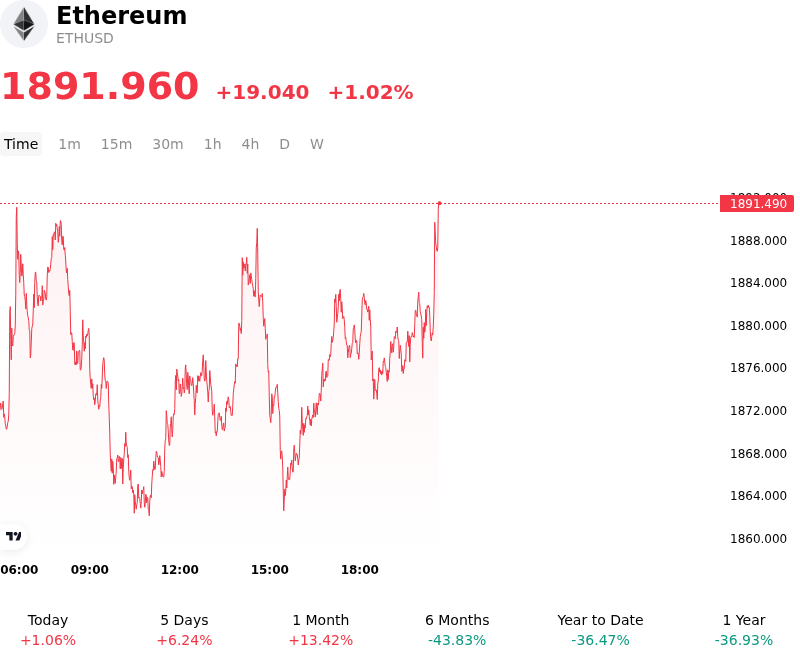
What is driving Ethereum (ETHUSD)’s stock price up today?
The upward movement in Ethereum is primarily attributed to a favorable shift in global macro liquidity conditions following softer-than-expected US economic data, which has recalibrated market expectations for the Federal Reserve’s policy trajectory. As Treasury yields retreated in response to cooling inflationary signals, the US dollar weakened, enhancing the appeal of high-beta digital assets. Institutional investors have utilized this macro tailwind to increase exposure, specifically through sustained net inflows into spot Ethereum ETFs, signaling a robust appetite for the asset’s programmatic scarcity and its role as the foundational layer for decentralized finance.
Beyond macro factors, the internal supply dynamics of the Ethereum network are providing structural support for the current price appreciation. Increased transaction volume across major Layer-2 scaling solutions has accelerated the ETH burn rate, effectively reducing the circulating supply during a period of rising demand. This deflationary pressure is being compounded by a significant portion of the ETH supply remaining locked in staking contracts, which reduces immediate exchange-side liquidity and amplifies the impact of institutional buy orders.
On-chain data indicates a notable uptick in institutional accumulation, with large-scale holders moving assets into self-custody or long-term staking protocols, further tightening the available float. This behavior reflects growing confidence in the network’s performance and its expanding utility in institutional tokenization projects. The combination of reduced liquid supply and heightened institutional participation through regulated vehicles has created a supply-demand imbalance that favors higher valuations.
In the derivatives market, the advance was accelerated by the liquidation of leveraged short positions. As Ethereum broke through key resistance levels, a cascade of buy-to-cover orders added momentum to the intraday move. The shift in the options term structure suggests that professional traders are increasingly positioning for further upside, with a visible increase in call buying for upcoming expirations. This sentiment shift is underpinned by a stabilizing regulatory environment, which has mitigated some of the idiosyncratic risks previously associated with the asset class.
Investors continue to monitor the interplay between institutional ETF demand and broader risk sentiment in the equity markets. While the current trend remains constructive, the market remains sensitive to sudden shifts in the Federal Reserve's rhetoric or unexpected changes in global liquidity. For now, the convergence of favorable macro data, positive ETF flows, and strengthening network fundamentals supports the ongoing re-rating of Ethereum relative to the broader digital asset complex.
Technical Analysis of Ethereum (ETHUSD)
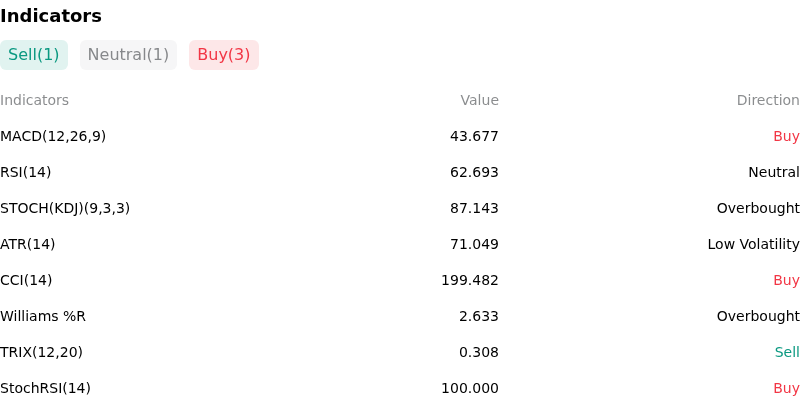
Technically, Ethereum (ETHUSD) shows a MACD (12,26,9) value of 43.677, indicating a buy signal. The RSI at 62.693 suggests neutral condition and the Williams %R at 2.633 suggests overbought condition. Please monitor closely.
More details about Ethereum (ETHUSD)
Recent Events and Risks:
- Spot ETF Implementation Uncertainty: While recent 19b-4 filing progress has fueled a price surge, there is significant concern that the SEC may delay the effectiveness of S-1 registration statements for weeks or months, creating a "sell the news" window and leaving speculative long positions vulnerable to time-decay and liquidation.
- Concentrated Exchange Inflows: On-chain monitoring has detected several large transfers from "whale" wallets to centralized exchange deposit addresses within the last 48 hours, totaling over $200 million in ETH, which suggests a rising intent to capitalize on recent price appreciation through immediate spot selling.
- Overextended Funding Rates: The rapid intraday move toward the $3,800 resistance level has pushed perpetual futures funding rates to local highs, indicating a heavily leveraged market structure that is susceptible to a "long squeeze" if a failure to break higher triggers a cascade of automated stop-loss orders.
- Staking Utility Regulatory Exclusion: Reports indicating that ETF applicants are removing staking provisions from their filings to satisfy SEC concerns present a risk that institutional demand may underperform expectations, as the inability to capture yield within the ETF wrapper makes the product less attractive compared to direct ownership.
Recommended Articles


