




Gold eases as soft US CPI fails to dent the Fed's hawkish outlook
- Gold trades under pressure on Wednesday as the US Dollar and Treasury yields recover from their post-CPI decline.
- Softer US CPI data cools near-term Fed rate hike bets, but rising Oil prices keep inflation risks alive.
- Technically, XAU/USD keeps a bearish bias below its key moving averages, with sellers eyeing a sustained break below $4,000.
Gold (XAU/USD) trades on the back foot on Wednesday as the US Dollar (USD) and US Treasury yields rebound after coming under pressure on Tuesday following softer-than-expected US Consumer Price Index (CPI) data.
At the time of writing, XAU/USD trades around $4,036, down 0.40% on the day.
US inflation cooled sharply in June, although much of the decline was driven by lower energy prices following last month’s interim peace deal between the United States (US) and Iran.
Headline CPI fell 0.4% MoM after a 0.5% rise in May, slowing the annual rate to 3.5% from 4.2%. Core CPI month-on-month came in flat at 0% after a previous 0.2% gain, while the annual core rate eased to 2.6% in June from 2.9%.
The data reduced expectations of an immediate Federal Reserve (Fed) interest rate hike and briefly lifted Gold above $4,100 on Tuesday. Still, it did not materially change the Fed’s hawkish outlook, as inflation risks persist with Oil prices creeping higher again following renewed fighting in the Middle East.
In an interview with Fox News on Tuesday, US President Donald Trump warned that military strikes against Iran would intensify unless Tehran resumed negotiations. "Next week comes the bridges. We're going to knock out all their power plants. We're going to knock out all their bridges unless they get to the table and negotiate," Trump said.
According to the CME FedWatch Tool, markets see an 85% chance that the Fed will leave interest rates unchanged at its July meeting, while the probability of a September hike stands at around 60%.
Meanwhile, Fed Chair Kevin Warsh reiterated the central bank’s commitment to bringing inflation back to its 2% target during his congressional testimony on Tuesday, saying “no tolerance for persistently elevated inflation.”
“The June CPI was positive relative to expectations,” Warsh added. “I’m not cherry-picking. There is still plenty of work to do.”
Attention now turns to the US Producer Price Index (PPI) data, due at 12:30 GMT, for more clues on the inflation outlook.
Technical analysis: XAU/USD keeps bearish bias with $4,000 support in focus
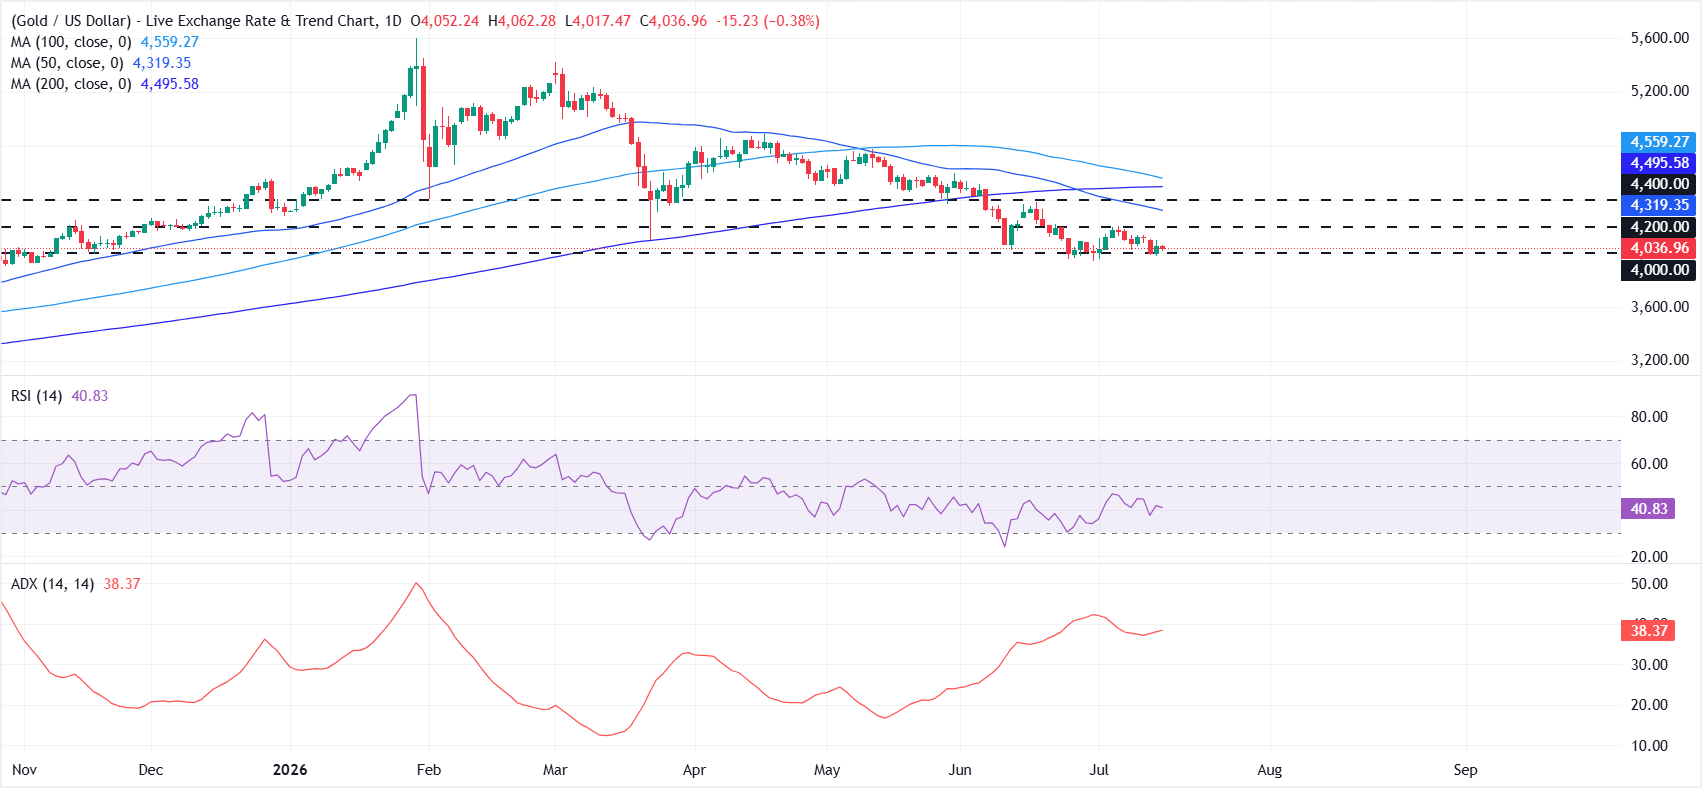
On the daily chart, XAU/USD retains a bearish near-term bias as the price holds well below the 50-day, 100-day and 200-day Simple Moving Averages (SMAs). The clustering of these longer-term SMAs above spot suggests upside attempts are likely to be capped for now.
The Relative Strength Index (RSI) around 40 stays in neutral-to-soft territory, hinting at limited bullish momentum despite a pause in the recent slide. The Average Directional Index (ADX) at 38.37 points to a still-established trend backdrop.
On the topside, initial resistance emerges at the horizontal level of $4,200, ahead of the 50-day SMA near $4,319 and another barrier at $4,400, with the 200-day SMA at $4,495 and the 100-day SMA at $4,559 marking a broader supply zone higher up.
On the downside, immediate support is seen at the psychological $4,000.00 handle, and a sustained break below this floor would likely open the way for a deeper bearish extension in line with the prevailing trend structure.
(The technical analysis of this story was written with the help of an AI tool. Know more.)
US Dollar Price Today
The table below shows the percentage change of US Dollar (USD) against listed major currencies today. US Dollar was the strongest against the Swiss Franc.
| USD | EUR | GBP | JPY | CAD | AUD | NZD | CHF | |
|---|---|---|---|---|---|---|---|---|
| USD | 0.06% | -0.11% | 0.06% | 0.06% | -0.14% | -0.09% | 0.23% | |
| EUR | -0.06% | -0.22% | 0.00% | -0.01% | -0.25% | -0.21% | 0.16% | |
| GBP | 0.11% | 0.22% | 0.20% | 0.20% | -0.04% | 0.01% | 0.37% | |
| JPY | -0.06% | 0.00% | -0.20% | -0.01% | -0.22% | -0.17% | 0.15% | |
| CAD | -0.06% | 0.00% | -0.20% | 0.00% | -0.21% | -0.21% | 0.17% | |
| AUD | 0.14% | 0.25% | 0.04% | 0.22% | 0.21% | 0.03% | 0.36% | |
| NZD | 0.09% | 0.21% | -0.01% | 0.17% | 0.21% | -0.03% | 0.36% | |
| CHF | -0.23% | -0.16% | -0.37% | -0.15% | -0.17% | -0.36% | -0.36% |
The heat map shows percentage changes of major currencies against each other. The base currency is picked from the left column, while the quote currency is picked from the top row. For example, if you pick the US Dollar from the left column and move along the horizontal line to the Japanese Yen, the percentage change displayed in the box will represent USD (base)/JPY (quote).
Recommended Articles


