


Ethereum (ETHUSD) Is down 1.29% on Jul 5: Why It Happened
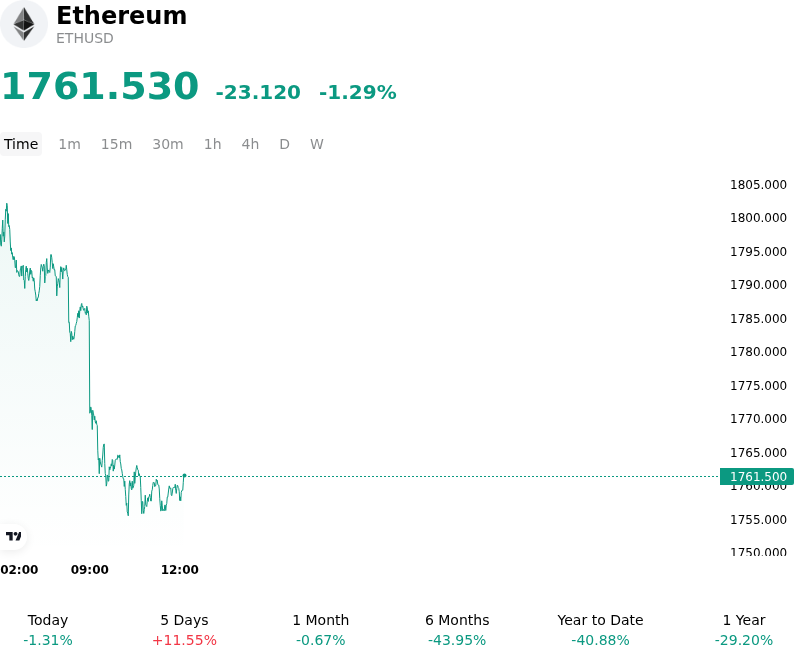
Ethereum (ETHUSD) is down 1.29% at Jul 5 00:10(ET), now at $1761.53, with a 7-day up of 12.15%.
What is driving Ethereum (ETHUSD)’s stock price down today?
The marginal decline in Ethereum reflects a period of consolidation following a volatile trading week characterized by competing macroeconomic pressures, shifting regulatory expectations, and underlying network usage trends.
From a macroeconomic perspective, investors are balancing the implications of softening economic indicators and their subsequent effect on monetary policy. While softer U.S. labor market data has reduced market expectations for aggressive rate hikes, general risk-off sentiment and a strong dollar have kept digital assets on the defensive. This tension has translated into selective capital allocation, with institutional investors showing cautious appetite.
Furthermore, institutional demand through spot Ethereum exchange-traded funds (ETFs) has been mixed. Although there have been intermittent daily inflows that temporarily alleviated liquidation worries, the broader trend is one of capital retrenchment. The overhang from massive outflows earlier in the quarter, alongside downgrades by major investment banks regarding target prices and future ETF inflows, continues to weigh on investor conviction. This reflects a structural shift as institutional market participants wait for more favorable macro liquidity conditions and regulatory clarity.
On-chain fundamentals present a dual narrative that contributes to the cautious outlook. Active addresses on the Ethereum mainnet have declined significantly from their highs earlier in the year, indicating a cooling of organic network engagement and lower transaction volumes. This reduction in activity directly impacts the network's fee burn rate, weakening the economic floor typically provided by network usage. Conversely, large-scale holders and institutional whales have engaged in gradual accumulation, absorbing supply at lower price levels. This accumulation acts as a psychological buffer but is not yet strong enough to offset the broader reduction in speculative retail demand.
In the derivatives market, positioning remains highly leveraged. A disproportionate concentration of leveraged long accounts on major global exchanges has introduced heightened sensitivity to sudden market fluctuations. This skew leaves the market structurally vulnerable to quick liquidations if downside momentum accelerates, making near-term price movements more fragile and volatile as traders defend key support zones.
Ultimately, the intraday movement highlights a market in search of a sustainable catalyst. Without consistent, robust ETF inflows and a clear recovery in on-chain network activity, Ethereum remains sensitive to broader macroeconomic indicators, global liquidity conditions, and the ongoing recalibration of institutional risk assets.
Technical Analysis of Ethereum (ETHUSD)
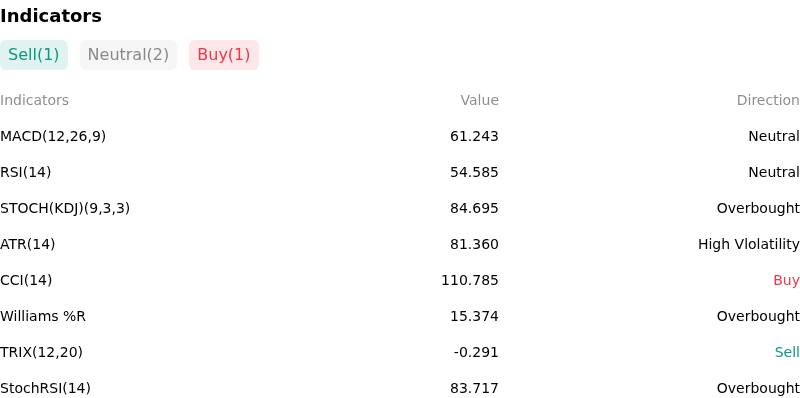
Technically, Ethereum (ETHUSD) shows a MACD (12,26,9) value of 61.243, indicating a neutral signal. The RSI at 54.585 suggests neutral condition and the Williams %R at 15.374 suggests overbought condition. Please monitor closely.
More details about Ethereum (ETHUSD)
Recent Events and Risks:
- Bearish Weekly Death Cross: Ethereum has officially confirmed a rare weekly death cross as its 50-week Exponential Moving Average (EMA) crossed below the 200-week EMA. This technical breakdown, paired with ETH recording three consecutive quarterly losses for the first time in its history, is driving significant concern that the token could breach key support zones and decline toward the $1,000 to $1,150 range.
- Persistent Institutional ETF Outflows: Despite minor local stabilization, Ethereum spot ETFs remain under immense pressure, suffering through weeks of sustained net outflows that have totaled roughly $1.18 billion. Analysts warn that this persistent drain of institutional capital continues to neutralize speculative recoveries and exposes ETH to sudden downside shocks.
- Aggressive Whale Selling and Supply Flood: Blockchain tracking data shows that large Ethereum whales recently offloaded approximately 550,000 ETH—valued at roughly $880 million—into the market in a single week. This massive distribution of spot supply, occurring alongside a 46% decline in active network addresses over the first half of the year, underscores a major deficit in organic demand.
- Leveraged On-Chain Liquidation Cascades: Heavy reliance on decentralized borrowing platforms has elevated market structure risks; one prominent wallet recently borrowed $142 million in USDT from Aave to accumulate ETH. This concentration of heavily leveraged, debt-backed spot long positions leaves the market highly vulnerable to sudden, localized liquidation cascades if ETH fails to defend the critical $1,500 support level.
Recommended Articles


