




Gold and Oil Are Moving in Opposite Directions in 2026. Here Is Exactly Why
Why Trade Gold & Oil CFDs with Mitrade?
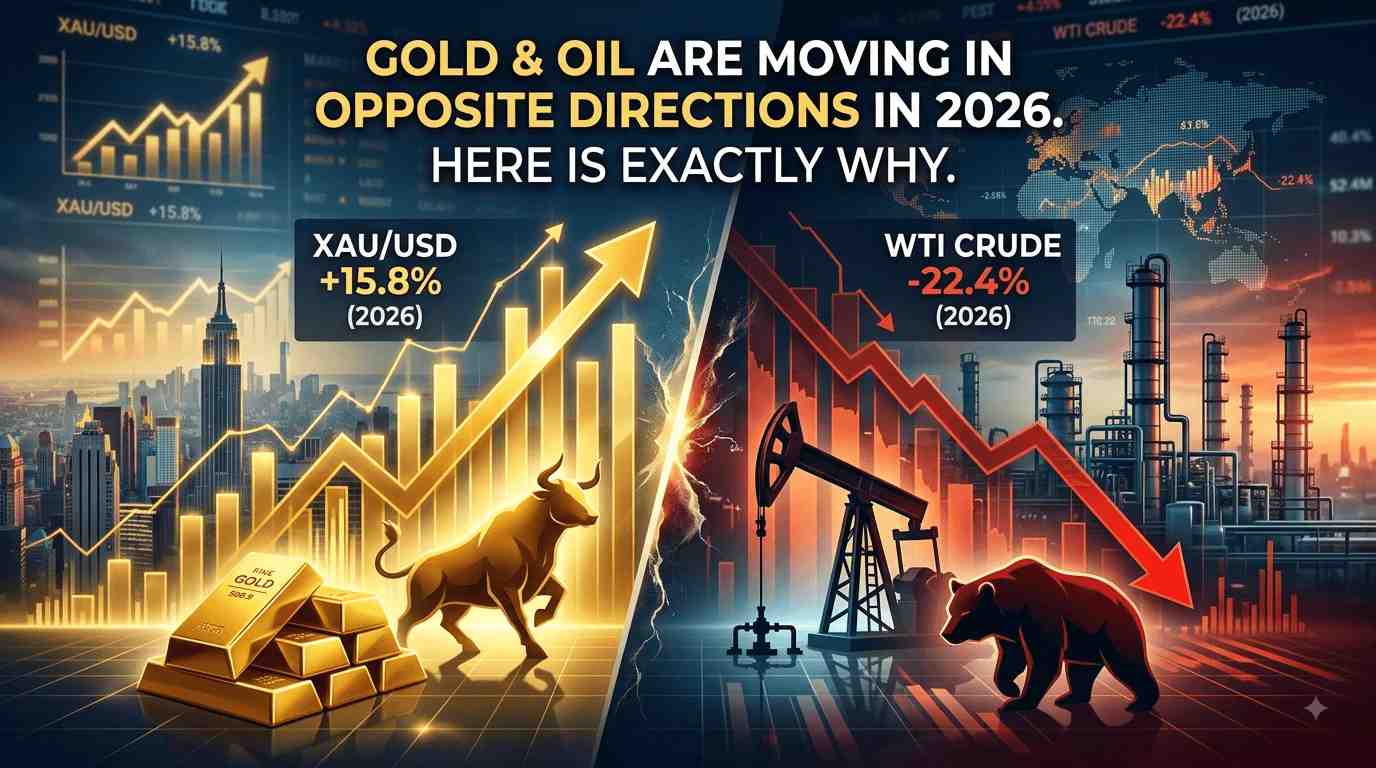
On July 27, 2026, oil crashed 7% in a single session. Gold rallied 1% the same day. Most traders found this confusing. They should not have.
The US and Iran agreed to suspend strikes over the weekend. Oil fell because the supply threat eased. Gold rose because lower oil means lower inflation. Lower inflation means fewer rate hikes. Fewer rate hikes means the dollar weakens and real yields compress. Compressed real yields are the single most powerful bullish force for gold in 2026. That is the trade hiding in plain sight all year. Gold and oil are moving in opposite directions and the reason is not what most people think.
This guide breaks down the mechanism, shows you the 2026 price action that confirms it, covers silver as the amplified version of the same trade, and explains exactly how Australian traders can position around it.
Why Gold and Oil Have Moved in Opposite Directions All Year
Gold is traditionally described as an inflation hedge. Buy it when prices rise and currencies weaken. That logic made sense for decades. In 2026 it broke down completely.
The US-Iran war began February 28. Brent surged from around $62 at the start of 2026 to above $120 at its peak. Gold fell more than 11% over the same period despite the ongoing conflict. Traders who bought gold expecting the classic crisis playbook got hurt badly.
The reason is interest rates. High oil drives up inflation. High inflation forces the Fed to hold rates higher for longer. Higher rates mean a stronger dollar and rising real yields. Gold has no yield. When real yields rise, the opportunity cost of holding gold increases and gold falls. In 2026, rising oil was directly bearish for gold through the rate expectations channel. That is the exact opposite of what most retail traders assume.
The inverse is equally true. When oil falls, inflation fears ease. Rate cut expectations build. Real yields compress. Gold rallies. The July 27 session proved this in real time and every major move in 2026 has followed the same pattern.
The 2026 Timeline That Proves the Relationship
The Brent chart and the gold chart tell the same story from opposite sides.
Brent started 2026 around $62 and surged above $120 as the Iran conflict escalated through February and March.
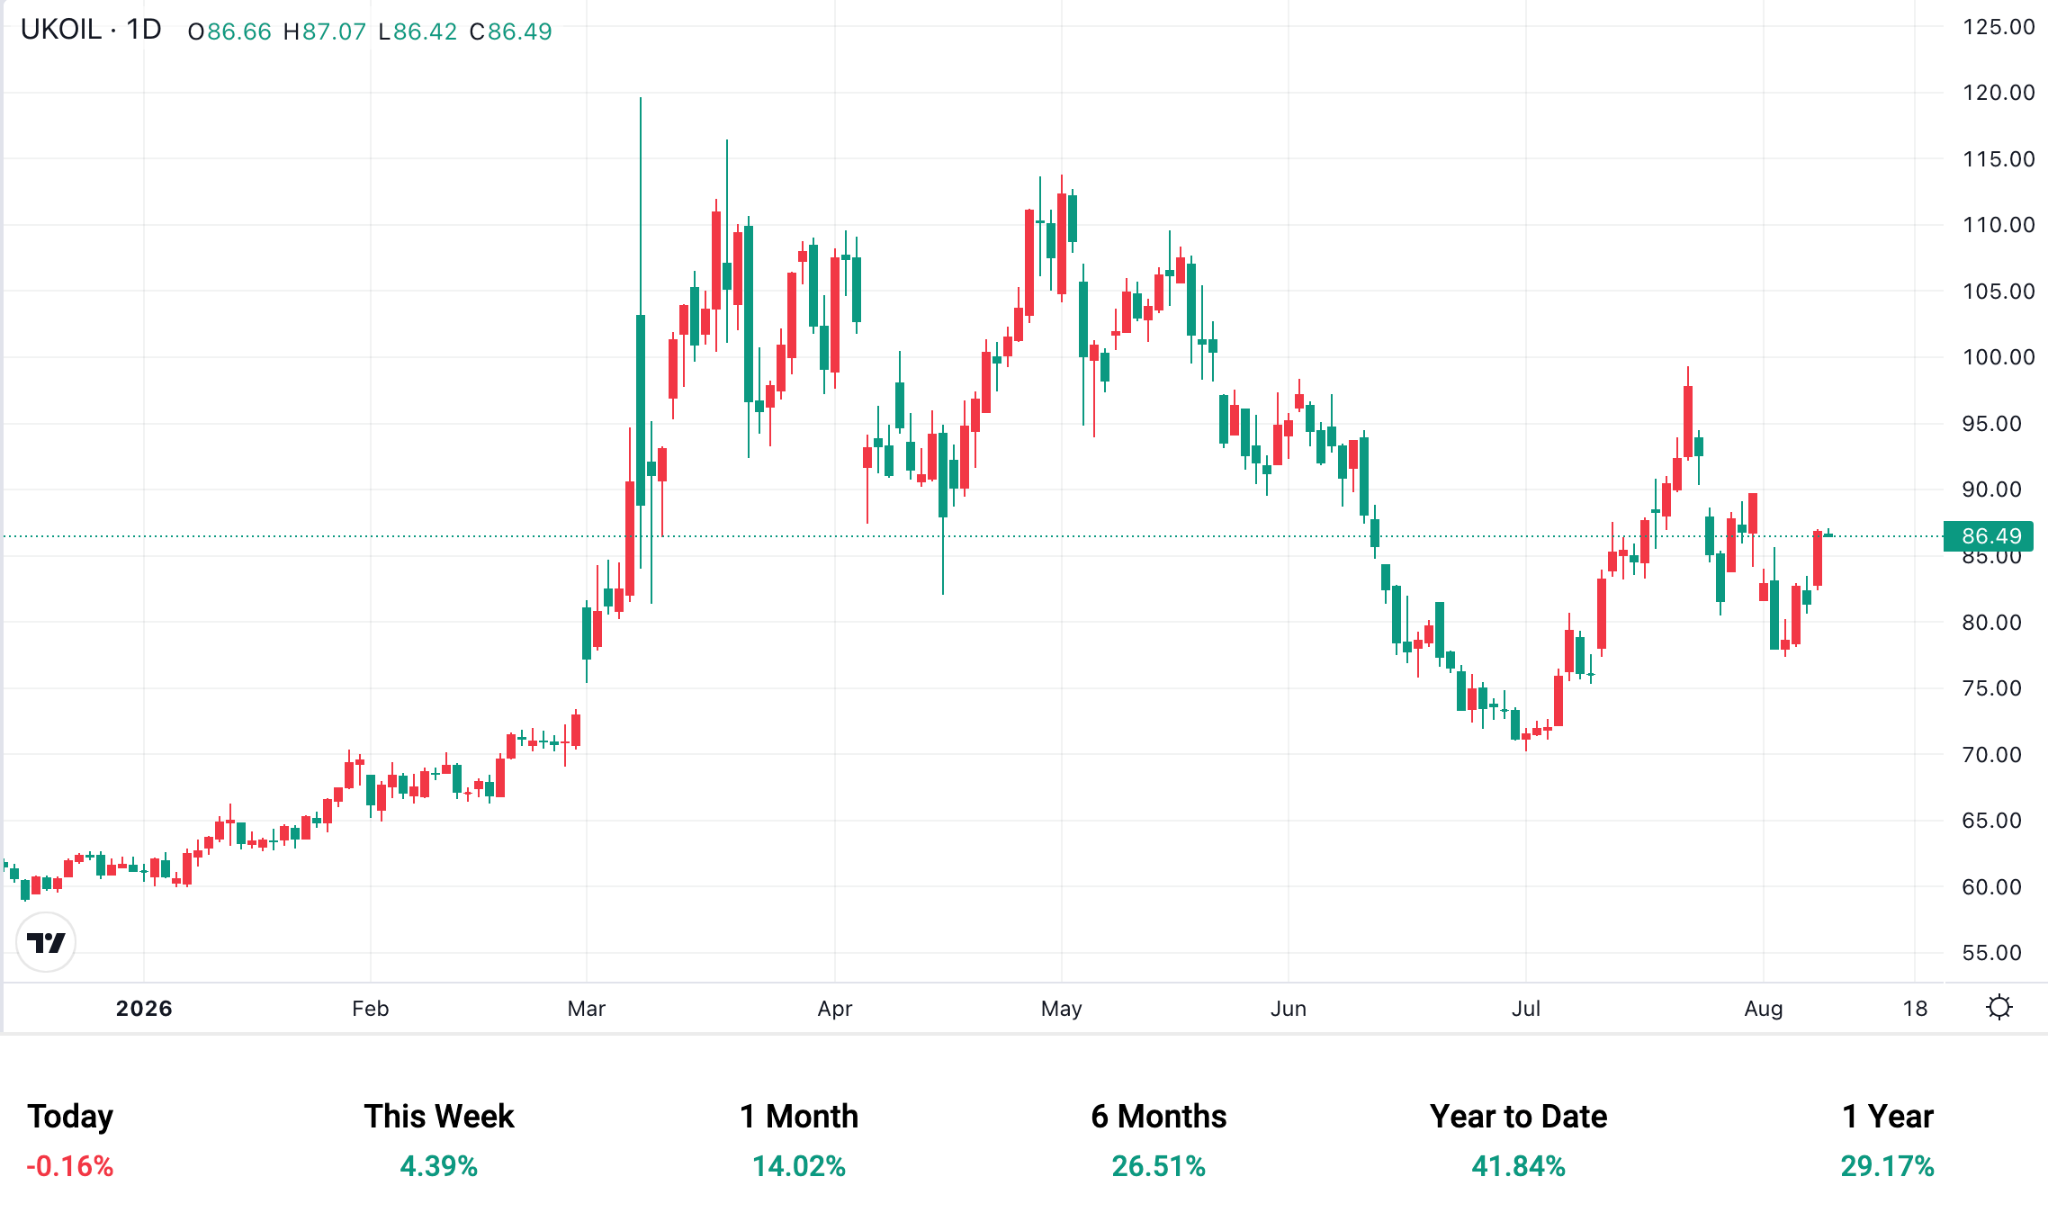
Source: Mitrade (Brent UKOIL Daily Chart)
Gold started 2026 around $4,100 to $4,200, peaked above $5,600 in February before the worst of the conflict, then fell more than 11% as oil pushed higher and the Fed signalled it would hold rates in response to energy-driven inflation.
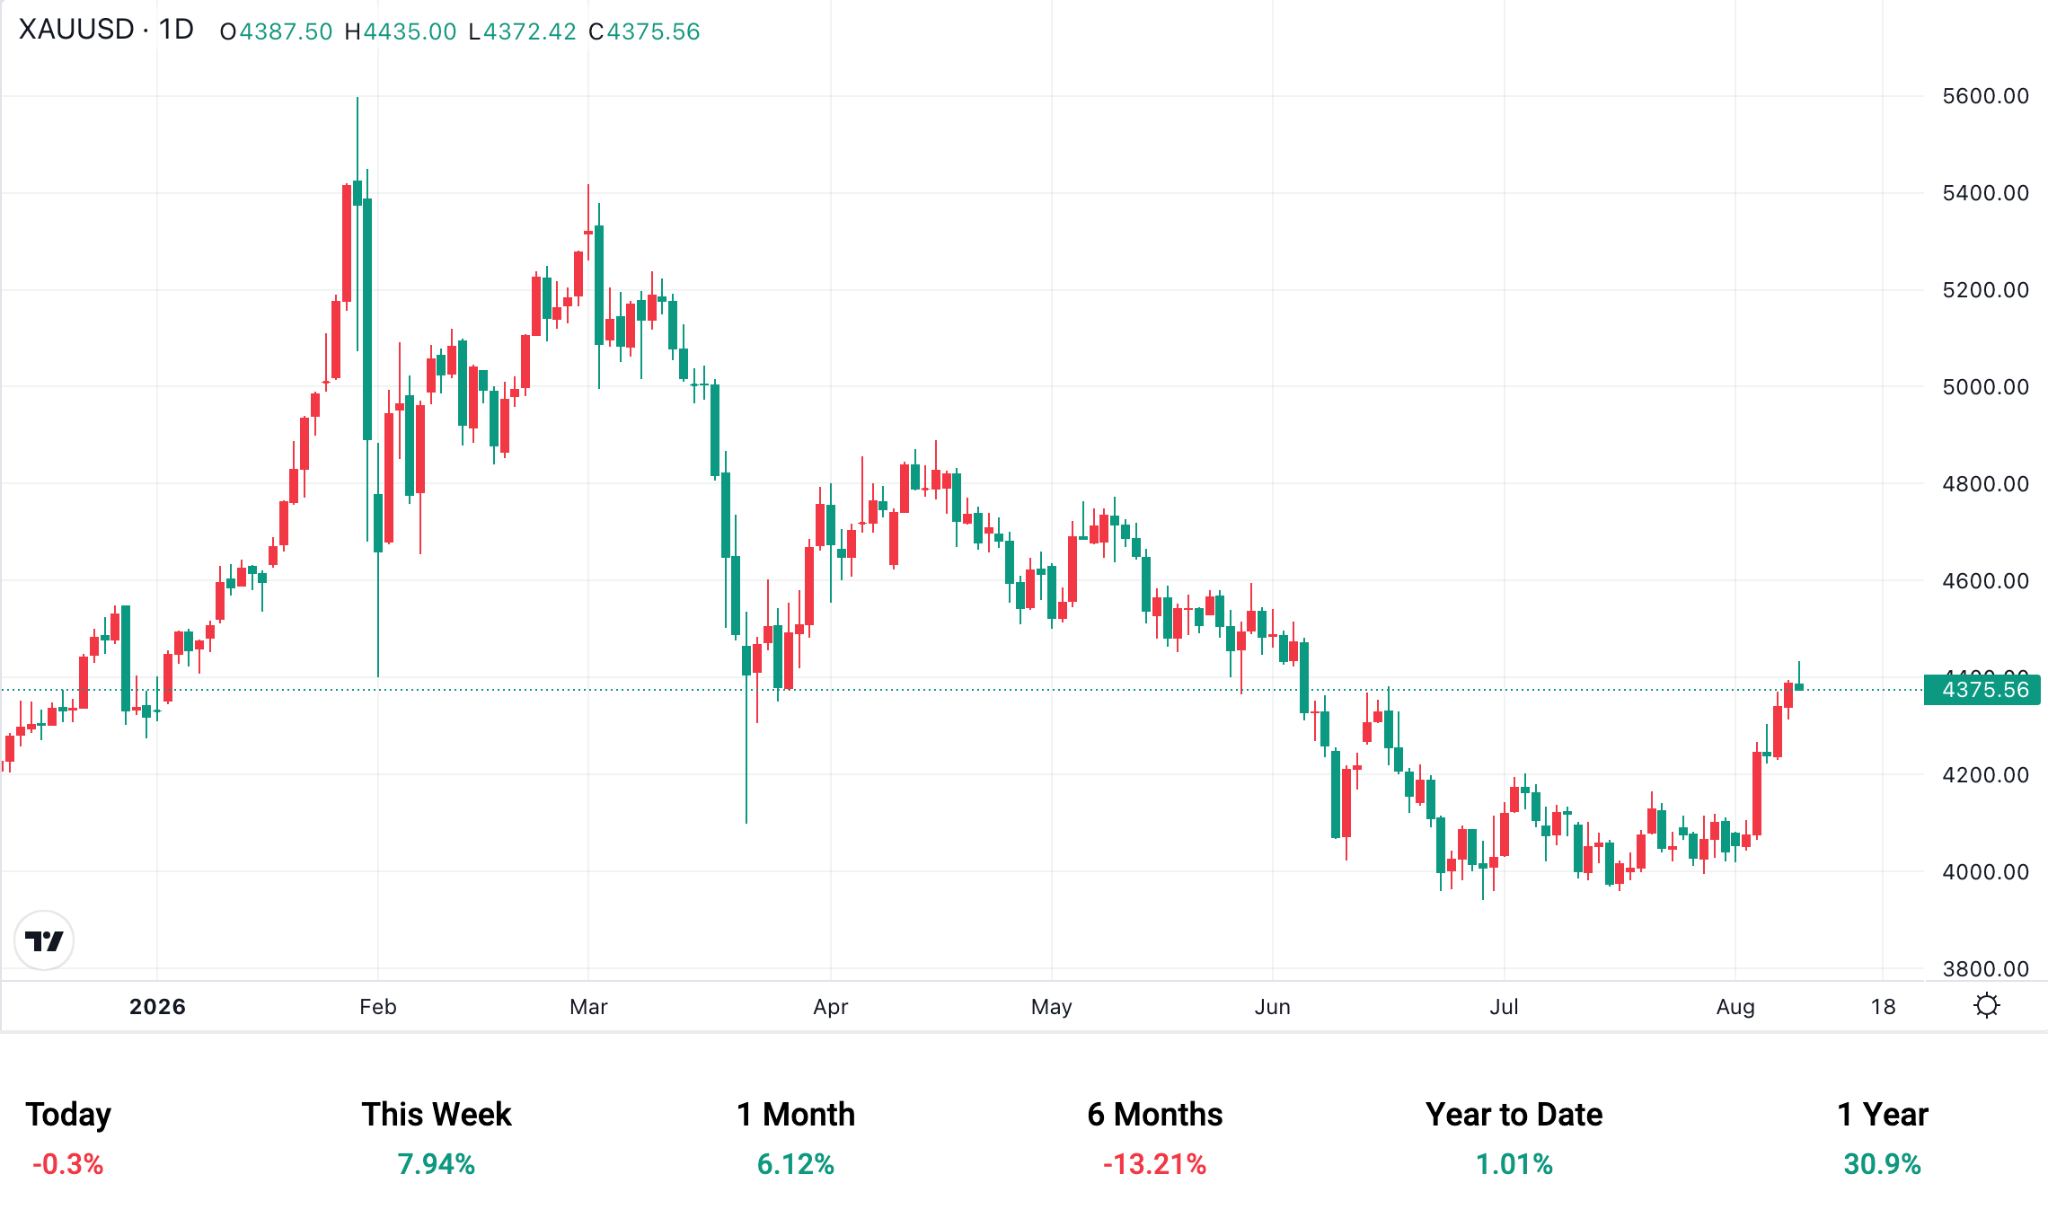
Source: Mitrade (Gold XAU/USD Daily Chart)
Each ceasefire attempt produced the same reaction. Oil fell, inflation fears eased, and gold bounced. April 8 saw the first two-week ceasefire and gold rose 2% to $4,790 in a single session. July 27 sent oil down 7% and gold climbed from lows near $4,000 back above $4,088 in the same session. Brent now trades at $86.92. Gold trades at $4,405.12. The correlation has held on every significant move in both directions across 2026.
The Structural Floor Nobody Is Talking About
Oil is the short-term driver. Central banks are the long-term floor.
The World Gold Council's Gold Demand Trends Q2 2026 report published July 30 showed central banks purchased a record 289 tonnes of gold in Q2 2026, a 74% jump year-on-year. The People's Bank of China has been accumulating gold for twenty consecutive months through June 2026. The US government's annual interest expense has now crossed $1 trillion, which mathematically limits how far the Fed can hike before fiscal constraints force a policy reversal that is structurally positive for gold.
These structural buyers are not trading the oil-gold correlation. They are building strategic reserves regardless of what crude is doing on any given week. That structural demand is the reason gold held above $4,000 through thirteen consecutive nights of US strikes on Iran, even as oil above $100 was technically bearish for gold through the rate channel.
The structural floor and the rate expectations ceiling create a defined trading range. When oil rises above $100, rate expectations push gold toward the lower end of that range. When oil falls and rate cuts get priced in, structural buying plus rate tailwinds push gold toward the upper end.
Silver: The Amplified Version of the Same Trade
Silver follows the same oil-gold inverse relationship but with more volatility in both directions, and Australian traders are largely ignoring it.
Silver entered 2026 at approximately $70 to $72 and spiked above $120 in early February as the Iran conflict drove both precious metals to extreme levels simultaneously. It then crashed sharply as oil surged and rate hike fears intensified, falling to lows around $55 through June and July.
It now trades at $65.038. On July 27 when oil crashed 7%, silver rose more than 2% to near $59 in the same session that gold climbed 1%. Silver consistently outperforms gold on the upside when the oil-gold trade turns bullish, and underperforms on the downside when oil rises and rate fears dominate.
Silver also has an industrial demand component from solar panels and EVs that gold lacks. This means silver can diverge from gold when Chinese PMI data surprises in either direction. Traders who want more leverage to the oil-falling-gold-rising trade should watch silver alongside gold for the amplified move.
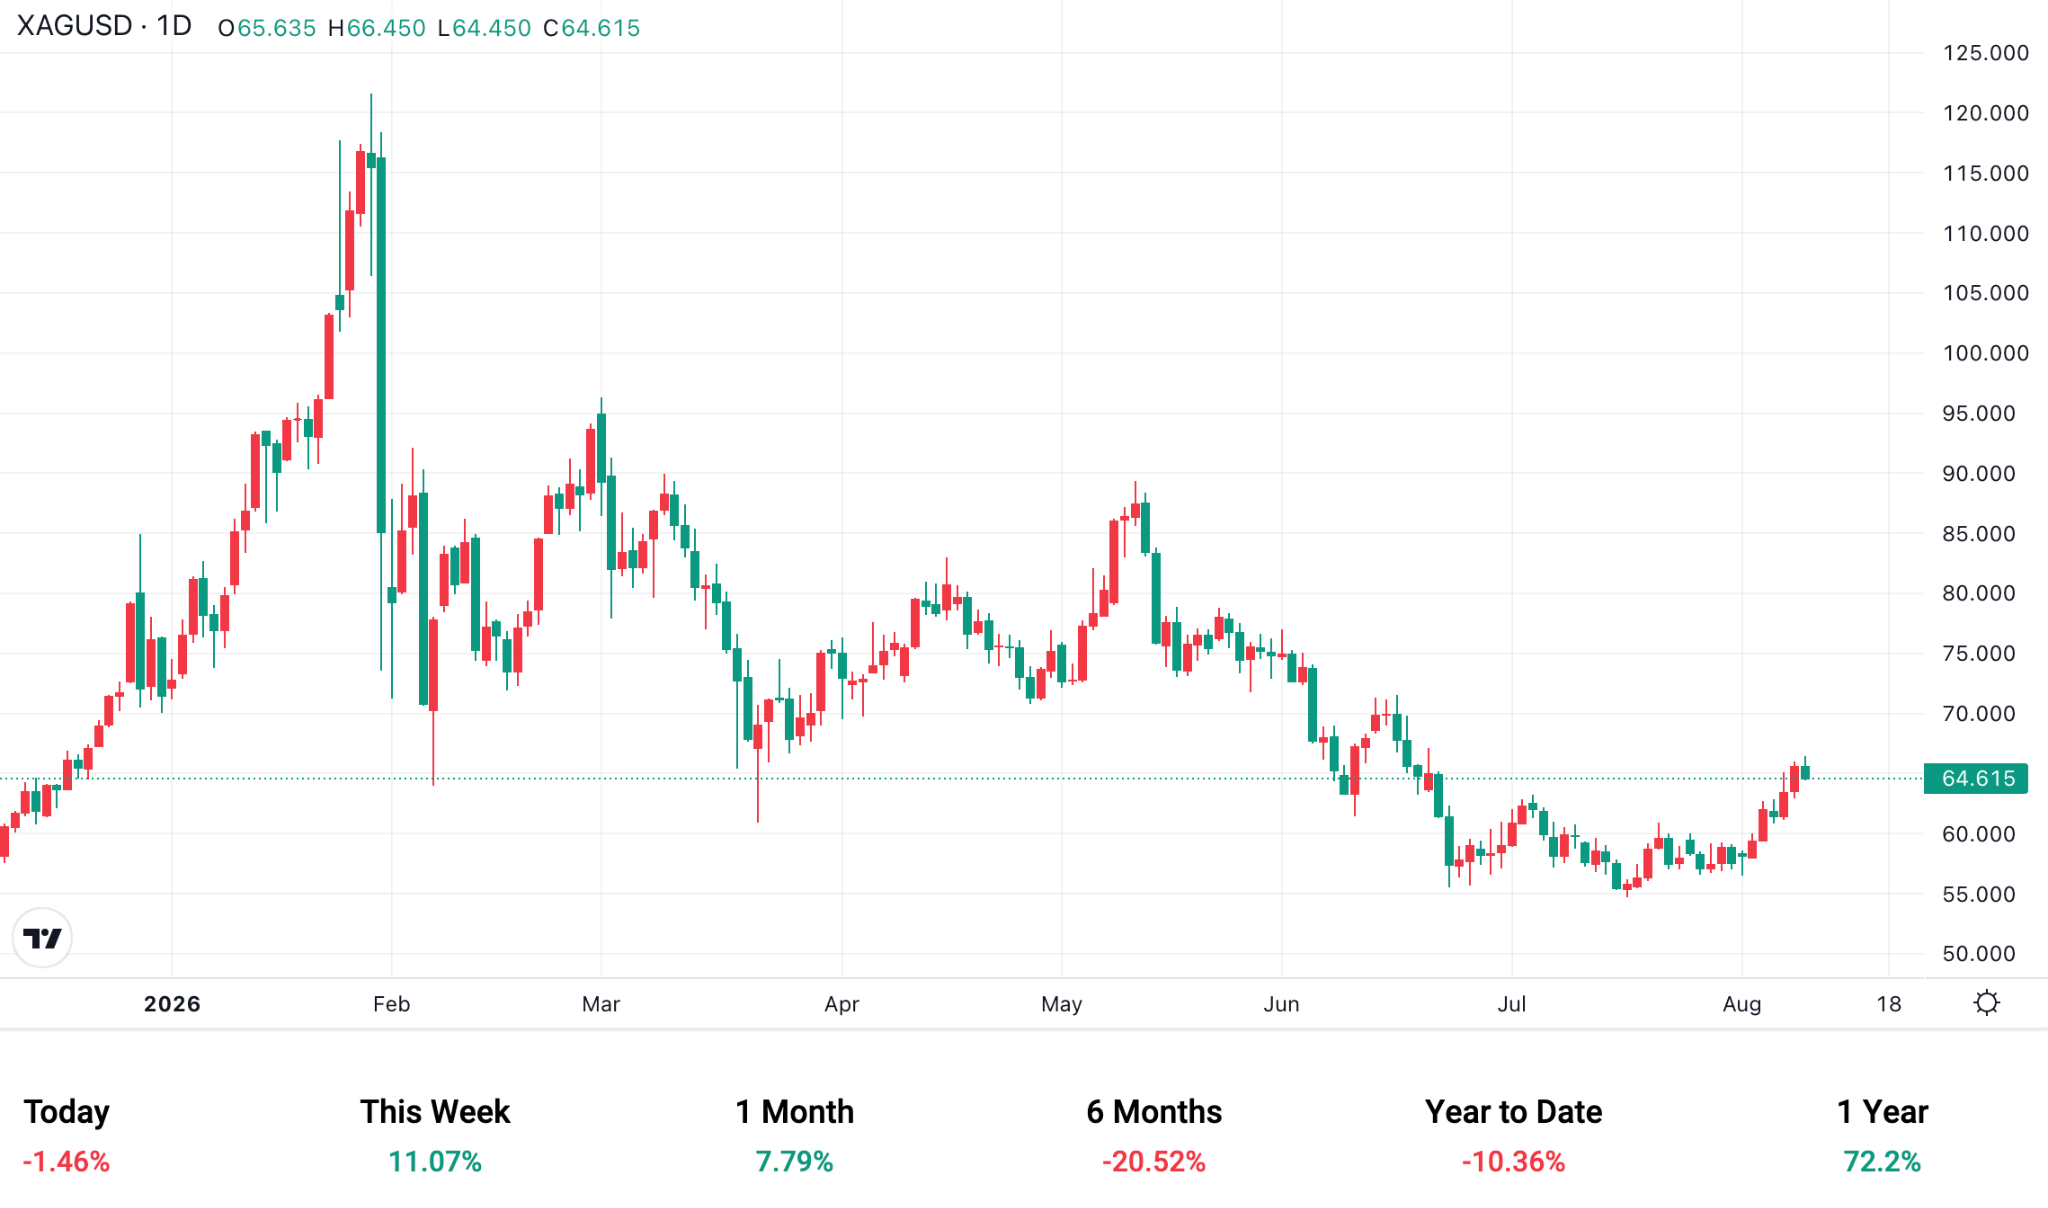
Source: Mitrade (Silver XAG/USD Daily Chart)
What Triggers the Trade and What to Watch Next
Four specific events move this trade in either direction. Australian traders need all four on their radar at all times.
Ceasefire and escalation headlines are the fastest movers. Every time the US and Iran exchange fresh strikes, oil jumps and gold faces rate-expectation pressure. Every time ceasefire talks advance, oil falls and gold rallies. The Brent chart is the first read on whether a Middle East headline is bullish or bearish for gold on any given day.
PCE and CPI data drive the rate expectations channel. When inflation data cools, the Fed-cut narrative strengthens, real yields compress, and gold rallies independently of oil. The next PCE release is August 29, 2026, and markets are currently pricing an 85% probability of a September rate cut.
Fed commentary moves real yields directly. When officials like Governor Waller signal support for cuts, real yields fall and gold responds within hours. Any shift in cut probability moves gold immediately.
Chinese central bank data is the structural floor trigger. If the People's Bank of China announces continued or accelerated gold purchases, the structural demand narrative strengthens and puts a floor under gold regardless of short-term oil moves.
How Australian Traders Position Around This Trade on Mitrade
Mitrade, regulated by ASIC under licence AFSL 398528, offers gold (XAU/USD), silver (XAG/USD), and Brent crude (UKOIL) as CFD instruments from a single zero-commission account.
The trade is straightforward. When oil falls on ceasefire news or cooling inflation data, go long gold or silver as CFDs. When oil spikes on fresh conflict escalation and rate hike fears build, go short gold or long Brent. Both sides of the trade have been profitable multiple times in 2026 because the correlation has been consistent and the triggers have been predictable from the geopolitical and data calendar.
Position sizing matters here because gold and silver carry significant intraday volatility. Gold moved 2% in a single session in April. Silver moved more than 2% on July 27 alone. A stop-loss placed at a key technical level before entering any position is not optional when trading instruments that can move this quickly on a single headline. Stop-loss and take-profit controls appear directly on the Mitrade order screen before any trade is confirmed. A free demo account with $50,000 in virtual funds lets traders practise the oil-gold trade before committing real capital.
You might be interested in…
1. Why did gold fall during the US-Iran conflict in 2026 if gold is supposed to be a safe haven?
Gold fell during the US-Iran conflict because high oil prices drove up inflation fears, which pushed the Federal Reserve toward holding rates higher for longer. Higher real yields increased the opportunity cost of holding gold, which has no yield of its own, and the dollar strengthened simultaneously. The rate expectations channel outweighed traditional safe haven demand during the peak of the conflict. Gold only began recovering consistently when ceasefire hopes reduced oil prices and eased inflation fears.
2. What is the relationship between oil prices and gold in 2026?
Oil and gold have moved in opposite directions throughout 2026 because of the rate expectations channel. High oil drives up inflation, which pushes the Fed to hold or hike rates, which strengthens the dollar and raises real yields, which is bearish for gold. When oil falls, the chain reverses and gold rallies. Brent started 2026 around $62, peaked above $120, and now trades at $86.92. Gold started around $4,100 to $4,200, peaked above $5,600 in February, and now trades at $4,405.12.
3. What is the World Gold Council's Q2 2026 central bank buying data and why does it matter?
The World Gold Council's Gold Demand Trends Q2 2026 report published July 30 showed central banks purchased a record 289 tonnes of gold in Q2 2026, a 74% jump year-on-year. This structural buying creates a demand floor under gold that exists independently of short-term oil and rate movements. The People's Bank of China has been buying gold for twenty consecutive months through June 2026.
4. Why does silver move more than gold when oil falls?
Silver follows the same inverse oil relationship as gold but with amplified moves because it has a smaller market, higher volatility, and an additional industrial demand component from solar panels and EVs. Silver entered 2026 around $70 to $72, spiked above $120 in February, and now trades at $65.038. On July 27 when oil crashed 7%, silver rose more than 2% in the same session that gold climbed 1%, demonstrating the consistent amplification pattern Australian traders can use for higher-leverage positioning.
5. What should Australian traders watch to time the gold and oil trade?
Four key catalysts drive the oil-gold inverse relationship. Ceasefire and escalation headlines from the Middle East move both instruments immediately. PCE and CPI inflation data shift rate cut expectations and therefore real yields. Fed commentary from officials like Governor Waller moves real yield expectations in real time. And People's Bank of China monthly gold purchase data confirms or challenges the structural demand floor under gold.
6. Can Australian traders access gold, silver, and Brent crude on Mitrade?
Yes. Mitrade offers gold (XAU/USD), silver (XAG/USD), and Brent crude (UKOIL) as CFD instruments under ASIC regulation with licence AFSL 398528. Traders can go long or short on all three from a single zero-commission account with stop-loss controls directly on the order screen. A free demo account with $50,000 in virtual funds is available before going live.
Disclaimer: The content presented above, whether from a third party or not, is considered as general advice only. CFD trading involves significant risk of loss. Past performance does not guarantee future results. This article serves informational purposes only and does not constitute financial advice. Consider your risk tolerance before trading.


