




Bitcoin Bearish Flag Goes Up As Expert Analyst Predicts A Massive Crash To $44,000


Bitcoin’s anticipated recovery above is looking increasingly bleak due to the formation of a bearish flag. The leading cryptocurrency has fallen further below $74,000 in the past 24 hours, and one analyst believes the latest move is only another stage in a much larger decline.
Bitcoin is currently trading at $73,240, down about 3.2% on the day. That drop has made a bearish TradingView analysis by Xanrox more relevant, as the analyst had warned that Bitcoin could lose the lower region of its current structure and begin a wider move down to $44,000.
Bitcoin’s Bear Market Structure Is 70% Complete
According to an expert crypto analyst known as Xanrox on social media, Bitcoin’s bear market structure is about 70% complete. Xanrox’s prediction is built around the idea that Bitcoin has been moving through a large corrective structure since its all-time high above $126,000 in October 2025.
Technical analysis of Bitcoin’s chart shows three separate bearish flag formations on the daily candlestick timeframe. The first is a small bearish flag, the second is a medium bearish flag, and the third is a larger bearish flag that is currently developing around the current trading range.
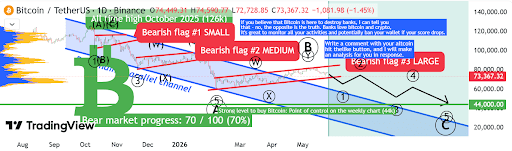
Elliott Wave count places Bitcoin’s entire price action since October in an ABC corrective pattern, with wave B now complete. That reading puts the Bitcoin bear market about 70% done, but the most painful portion is still ahead.
Bitcoin Price Prediction
The ultimate prediction is that the current Bitcoin correction will continue to play out for months in a defined path. The first major level in the roadmap is the lower boundary of the bearish flag, with the $71,000 region standing as the important level here. A breakdown below $71,000 would add strength to the bearish setup and could expose Bitcoin to another move to the previous early February low around $63,000.
The entire forecast points to a deeper correction, with the chart showing Bitcoin moving through the stages of a corrective C-wave that might eventually bottom out at a downside target around $44,000. That level was identified by Xanrox as a strong point of control on the weekly candlestick chart, meaning it represents a high-volume zone that could attract price if it were to break below $63,000.
The timeline attached to the prediction stretches into the second half of the year. The projected bottom is expected around September or October 2026, followed by a stronger recovery through October, November, and December. The roadmap then points to a larger bull cycle after the correction ends, in 2027 and 2028, with Bitcoin potentially climbing to as high as $200,000 by 2028.
Benjamin Cowen, CEO of Into The Cryptoverse and former NASA researcher, has also cited October 2026 as his base-case bottom for Bitcoin’s bear market, in line with Xanrox’s timeline.
 Don't Miss Today's Market Moves Start trading Forex, Gold & Crypto today Regulated platform | Fast withdrawals
* The content presented above, whether from a third party or not, is considered as general advice only. This article should not be construed as containing investment advice, investment recommendations, an offer of or solicitation for any transactions in financial instruments.


