

Wall Street Thinks Trumpflation Has Peaked, but There's an Unpleasant Surprise Looming for President Trump and Investors
Key Points
The Dow Jones Industrial Average, S&P 500, and Nasdaq Composite have soared, despite U.S. inflation reaching a three-year high.
The prospect of peace between the U.S. and Iran is weighing on oil prices, leading Wall Street to believe we've witnessed the worst of Trump-driven inflation.
However, Core PCE and the latest FOMC dot plot paint a different picture for a historically pricey stock market.
- 10 stocks we like better than S&P 500 Index ›
Despite a wild ride in March, the first half of 2026 is shaping up as another stellar year for Wall Street. Through the closing bell on June 29, the Dow Jones Industrial Average (DJINDICES: ^DJI), S&P 500 (SNPINDEX: ^GSPC), and Nasdaq Composite (NASDAQINDEX: ^IXIC) have risen by 9%, 9%, and 11% year-to-date, respectively.
Outsize stock market returns under President Donald Trump are nothing new. The Dow, S&P 500, and Nasdaq Composite returned 57%, 70%, and 142%, respectively, during his first non-consecutive term. Investors have embraced Trump's permanent lowering of the peak marginal corporate income tax rate and the subsequent increase in share buybacks by S&P 500 companies.
Where to invest $1,000 right now? Our analyst team just revealed what they believe are the 10 best stocks to buy right now, when you join Stock Advisor. See the stocks »
But the stock market's historic rally may be far shakier than Wall Street's major indexes imply. Although recent record highs for the Dow, S&P 500, and Nasdaq suggest Wall Street is looking past the Trump-driven surge in inflation (i.e., "Trumpflation"), an unpleasant surprise awaits the president and investors.

President Trump speaking with reporters. Image source: Official White House Photo by Patrick B. Ruddy.
Trumpflation has been impossible to miss
Before going any further, it's important to note that a modest level of inflation is perfectly normal and healthy. The Federal Open Market Committee (FOMC) -- the 12-person body responsible for setting the nation's monetary policy -- has maintained a long-term inflation target of 2% since January 2012. Businesses should have some degree of pricing power in an expanding economy.
But what we've witnessed on the inflationary front in recent months isn't healthy or welcome.
In February, the U.S. Bureau of Labor Statistics reported trailing 12-month (TTM) inflation of just 2.4%. Though this figure was modestly impacted by the price stickiness of Donald Trump's tariffs in the goods sector, all signs pointed to inflation heading toward the Fed's long-term target.
Then the Iran war happened. President Trump's decision to attack Iran on Feb. 28 led the latter to close the Strait of Hormuz to essentially all commercial vessels. This move halted the daily flow of roughly 20 million barrels of petroleum liquids and represented the largest modern-day disruption of the energy supply chain.
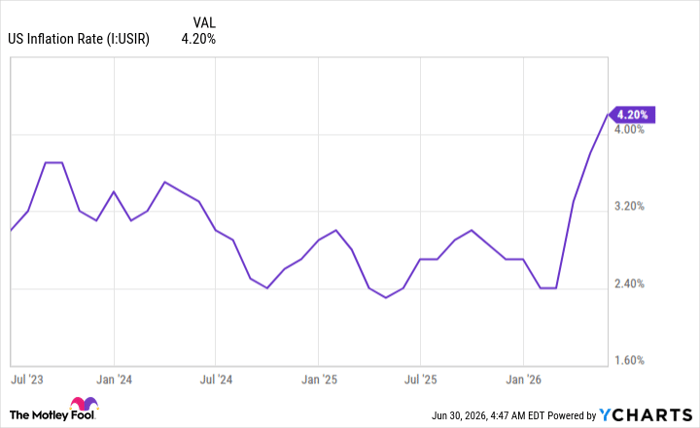
US Inflation Rate data by YCharts.
The subsequent reaction in energy markets was impossible to miss. Crude oil prices soared by close to 70% in a matter of weeks, while gas prices increased at the fastest pace in more than three decades. This rapid climb in energy commodities almost singlehandedly sent TTM inflation soaring. Between February and May, inflation jumped from 2.4% to a three-year high of 4.2%.
The apparent silver lining for Wall Street, and the reason the Dow Jones Industrial Average, S&P 500, and Nasdaq Composite have reached fresh highs, is the prospect of a quick resolution between the U.S. and Iran. The likelihood of a peace deal and a full reopening of the Strait of Hormuz has cratered oil prices to levels that were last seen when the Iran war was just a few days old.
With West Texas Intermediate (WTI) crude oil dipping below $70/barrel from north of $110/barrel, it would appear, on paper, that the worst of Trumpflation is over. But looks can be deceiving.

Image source: Getty Images.
President Trump and Wall Street are in for a surprise
While there's no question that a substantial decline in WTI crude can alleviate energy commodity inflation in the coming months, the effects of the Iran war aren't limited to the energy sector.
Every weekday, the Federal Reserve Bank of Cleveland's proprietary Inflation Nowcasting tool updates front-month inflation projections. While the Consumer Price Index for June is expected to decline to 3.96%, the estimate for Core Personal Consumption Expenditures (PCE), which excludes volatile food and energy prices, has been steadily climbing. In other words, Trumpflation isn't just being felt at the fuel pump anymore.
The effects of the largest energy supply disruption in modern history have been delayed a few months for businesses, but are starting to show up in economic data. Higher crude oil prices have increased transportation and production costs for companies in most sectors and industries. Additionally, the closure of the Strait of Hormuz has caused suppliers further down the chain to reroute shipments. These higher costs are being passed on to the consumer.
BREAKING: US May PCE inflation, the Fed's preferred inflation metric, rises to 4.1%, the highest reading since April 2023.
-- The Kobeissi Letter (@KobeissiLetter) June 25, 2026
Core PCE inflation rose to 3.4%, its highest since October 2023.
US inflation is now officially running at more than double the Fed's 2% target.
Furthermore, the Iran war has disrupted the transport of fertilizer. Prices for key nutrients used to grow produce have soared and are unlikely to snap back to pre-Iran-war levels anytime soon, even if the Strait of Hormuz is open and seeing normal shipping traffic. Higher fertilizer costs translate into stickier grocery prices.
Closing the Strait of Hormuz also affects the price of petroleum-based products. This includes plastics, tires, and synthetic fibers.
The point being that Trumpflation is nowhere near finished, nor has it necessarily peaked. Even with a peace deal, it'll take several quarters, if not more than a year, to work through these supply disruptions.
For the FOMC, the steady rise in Core PCE squarely puts rate hikes on the table. The quarterly filed Summary of Economic Projections, more commonly known as the dot plot, showed that nine out of 18 participating FOMC members (not all 18 vote on monetary policy) expect interest rates to rise before the end of the year. In fact, a third of the 18 are forecasting two or more rate hikes.
Very hawkish dot plot.
-- Nick Timiraos (@NickTimiraos) June 17, 2026
Nine out of 18 officials have at least one hike this year (and six of those 9 have *multiple hikes*).
Only one person has a cut this year, and one participant (presumably Warsh) didn't submit an SEP
The statement gets a complete writethru from top to... pic.twitter.com/KRwatpTFOP
While this may come as an unpleasant surprise to President Trump, a historically expensive stock market, and investors, policymakers are completely justified in thinking that interest rates need to rise. With this energy supply shock spilling over into the broader economy, there's a real possibility of Trumpflation doing harm.
Higher interest rates would be particularly worrisome for a stock market that's been reliant on the partially debt-financed artificial intelligence build-out to drive up growth projections. Any slowdown in AI infrastructure spending could reset growth expectations and the nosebleed valuations for market-leading tech stocks.
Wall Street may think Trumpflation has peaked, but Federal Reserve policymakers and Core PCE suggest otherwise.
Should you buy stock in S&P 500 Index right now?
Before you buy stock in S&P 500 Index, consider this:
The Motley Fool Stock Advisor analyst team just identified what they believe are the 10 best stocks for investors to buy now… and S&P 500 Index wasn’t one of them. The 10 stocks that made the cut could produce monster returns in the coming years.
Consider when Netflix made this list on December 17, 2004... if you invested $1,000 at the time of our recommendation, you’d have $418,761!* Or when Nvidia made this list on April 15, 2005... if you invested $1,000 at the time of our recommendation, you’d have $1,195,804!*
Now, it’s worth noting Stock Advisor’s total average return is 918% — a market-crushing outperformance compared to 208% for the S&P 500. Don't miss the latest top 10 list, available with Stock Advisor, and join an investing community built by individual investors for individual investors.
See the 10 stocks »
*Stock Advisor returns as of July 5, 2026.
Sean Williams has no position in any of the stocks mentioned. The Motley Fool has no position in any of the stocks mentioned. The Motley Fool has a disclosure policy.
Recommended Articles


