


Ripple and Stellar outlook: XRP revisits November 2024 levels, XLM hits a two-year low
- XRP trades below $0.957 on Tuesday after dropping to the lowest level since mid-November 2024 last week.
- XLM hovers around $0.137 after slipping to a two-year low at $0.130 on Saturday.
- Weakening on-chain metrics and deteriorating technical indicators suggest continued downside risk, despite oversold conditions for both altcoins.
Ripple (XRP) and Stellar (XLM) tumble as bears show no signs of backing down. With both altcoins under pressure on Tuesday, XRP revisits November 2024 levels, and XLM hit a two-year low last week. Meanwhile, deteriorating on-chain metrics and bearish technical indicators suggest further downside risk, despite both tokens entering oversold conditions.
Weakening on-chain metrics
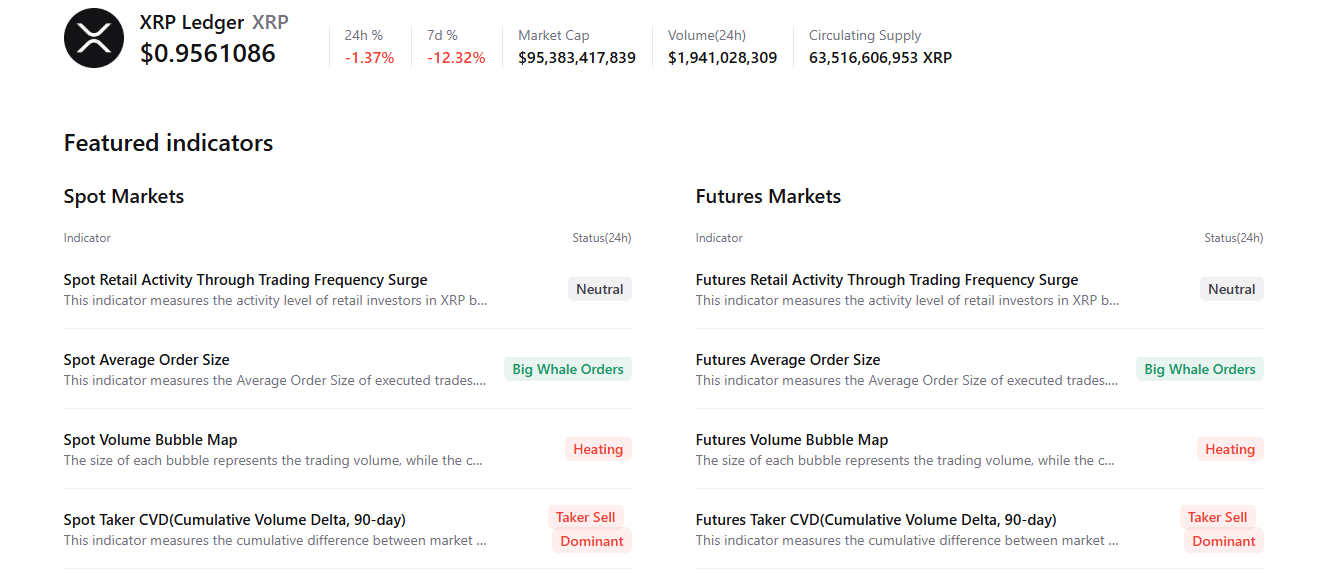
CryptoQuant’s summary data shows a bearish outlook for both altcoins. XRP’s spot and futures markets show large whale orders but with sell-side dominance. In addition, both markets also show heating conditions, highlighting an overall bearish, cautious sentiment bias among Ripple traders.
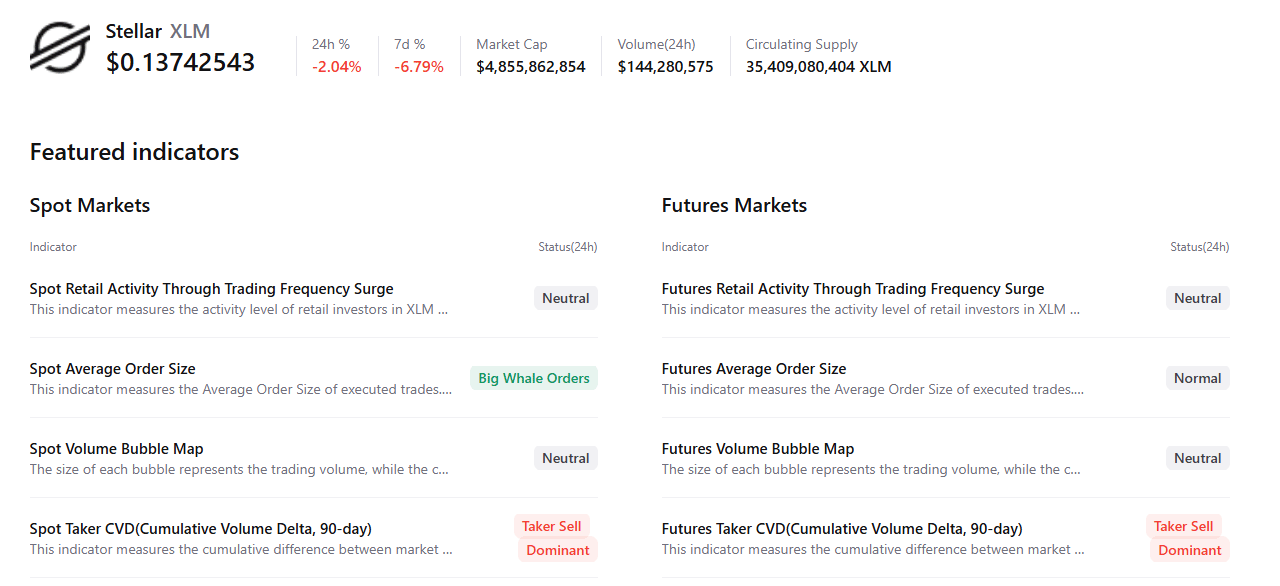
For XLM, spot and futures markets show sell-side dominance. Meanwhile, the spot market shows large whale sell orders, while other metrics remain neutral, highlighting a cautious-to-bearish outlook among XLM traders.
XRP technical outlook: XRP revisits November 2024 levels
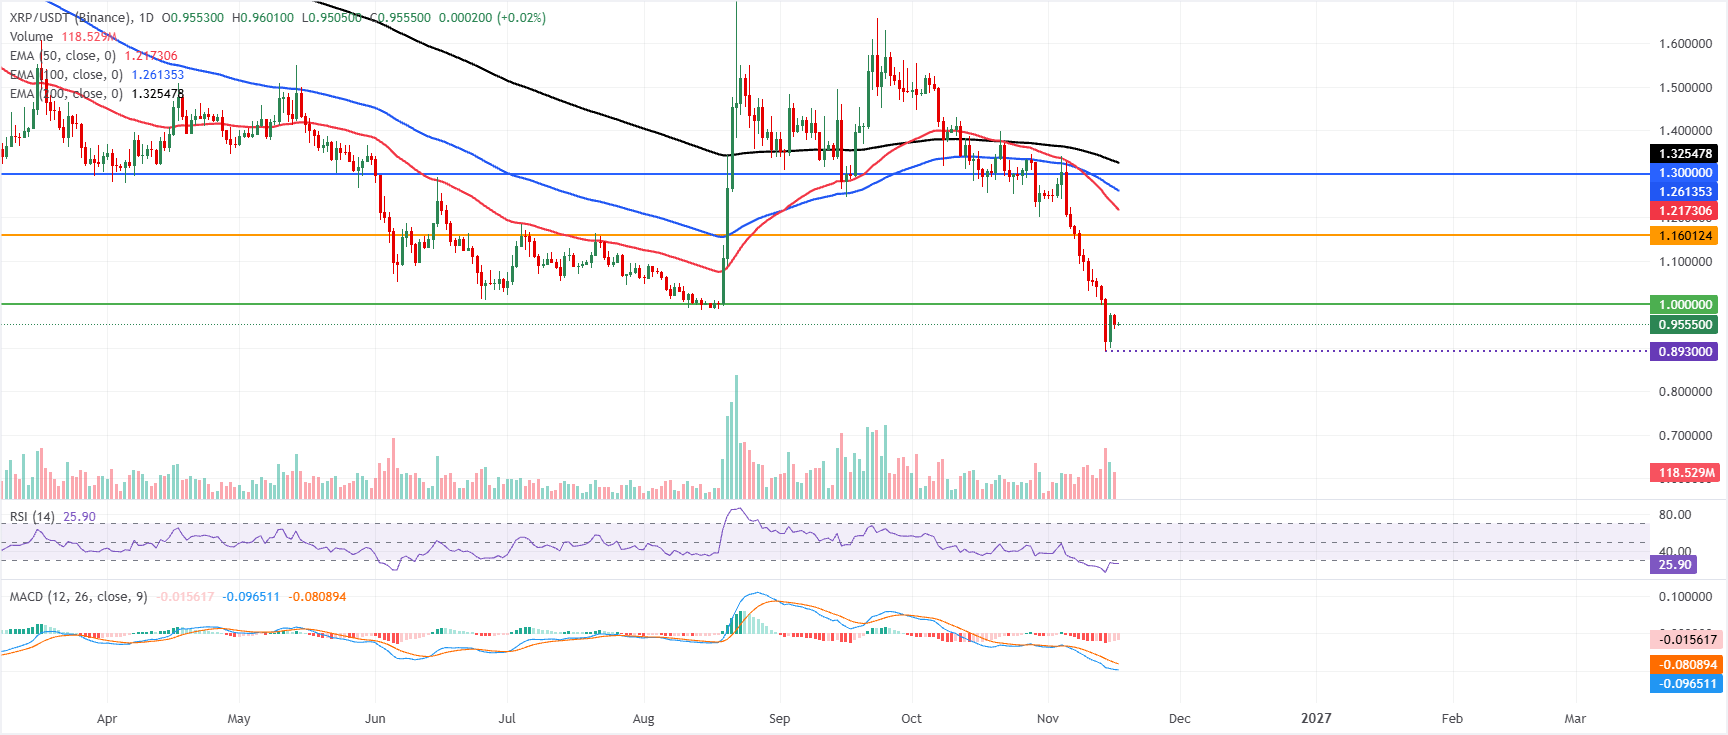
XRP price trades at $0.955 on Tuesday, after dropping to a low of $0.893 on Saturday, levels since mid-November 2024. XRP also extends its decline well below the 50-day, 100-day and 200-day Exponential Moving Averages (EMAs) at $1.217, $1.261 and $1.325, respectively, which collectively reinforce a bearish near-term bias.
The Relative Strength Index (RSI) at 25 sits in oversold territory, hinting at stretched downside conditions. At the same time, the Moving Average Convergence Divergence (MACD) remains below zero, suggesting ongoing selling pressure despite the possibility of a corrective bounce.
On the topside, initial resistance is now seen at the psychological $1.000 handle, followed by the horizontal barrier at $1.160. Above these, the 100-day EMA at $1.261 and the $1.300 level form a broader cap, ahead of the 200-day EMA at $1.325 and higher resistance at $1.540, which define the upper bounds of any medium-term recovery attempt.
XLM technical outlook: XLM drops to a two-year low
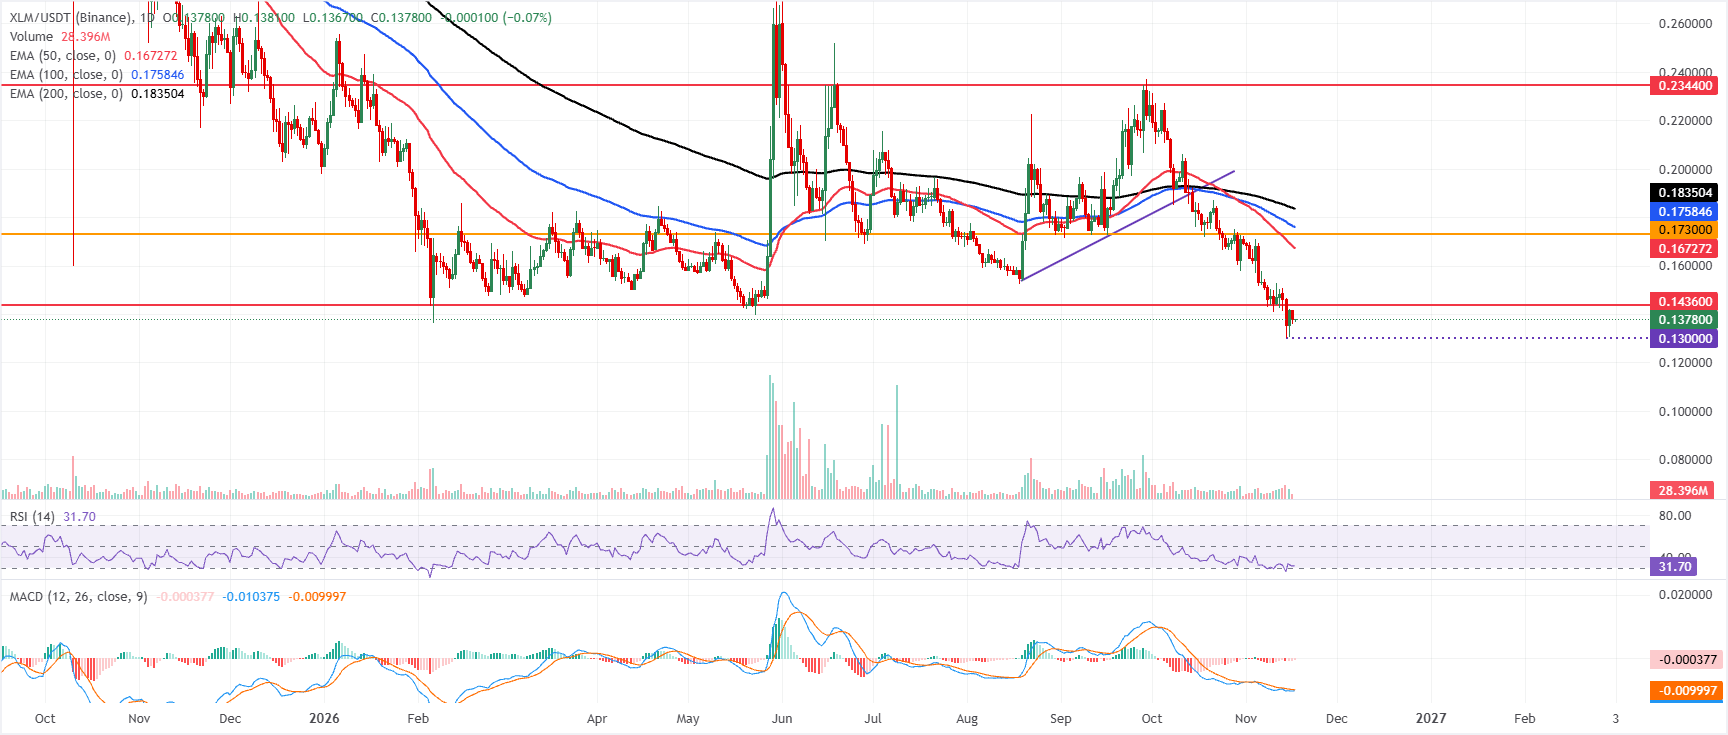
XLM price trades at $0.137 on Tuesday, after slipping to a two-year low at $0.130 on Saturday. XLM is extending its decline well below key EMAs, keeping the near-term bias bearish. Momentum remains soft, with the RSI hovering near the oversold boundary around 31 and the MACD indicator stuck below zero with a slightly negative line and subdued histogram, suggesting sellers still control the tape despite a slowing downside impulse.
On the topside, immediate resistance aligns at the former horizontal barrier at $0.143, followed by the prior trendline base near $0.153, now acting as a cap after being broken. Above there, the 50-day EMA at $0.167 and the $0.173 horizontal level form a dense technical ceiling ahead of the 100-day EMA at $0.175 and the 200-day EMA at $0.183.
A more significant bullish reversal would require a daily close back above these clustered averages, with the next major hurdle at the $0.234 horizontal resistance, which marks the upper limit of the broader range.
(The technical analysis of this story was written with the help of an AI tool. Know more.)
Recommended Articles


