


Cryptos Plunge as Bitcoin Drops for Fourth Straight Day, Threatening $80,000 Support
TradingKey - Cryptocurrencies face collective downward pressure as Bitcoin pulls back for four consecutive sessions, fully igniting the battle to defend the $80,000 mark.
On October 9, Beijing time, the crypto market weakened again, with total market capitalization falling below $2.8 trillion, hitting a new one-month low. Meanwhile, major cryptocurrencies tumbled across the board, generally dropping 3%-5% over 24 hours. Among them, Bitcoin (BTC) once approached the $80,000 mark, Ethereum (ETH) fell to near $2,400, Binance Coin (BNB) dropped to a low of $720, and Ripple (XRP) fell to $1.3.
The most direct catalyst for the consecutive drops in cryptocurrencies is the rebound in U.S. Treasury yields and macro risk aversion. The short-term strengthening of U.S. Treasury yields and the U.S. Dollar Index has put high-risk assets such as tech stocks and cryptocurrencies under widespread capital outflow pressure, with spot ETF inflow momentum slowing or even turning into net outflows. Over the past four trading days, U.S. spot crypto ETFs have recorded net outflows that continue to expand.
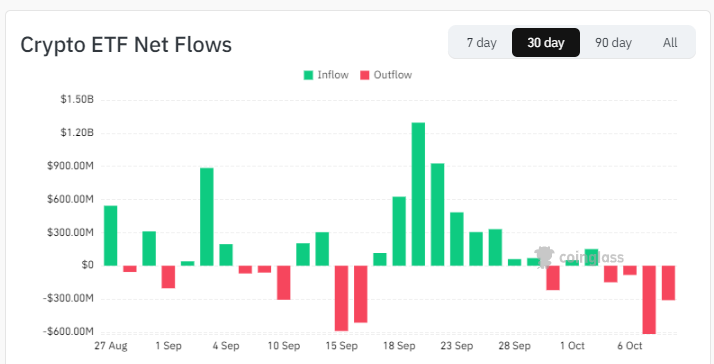 U.S. Spot Crypto ETF Capital Flows, Source: CoinGlass
In addition, U.S. government-related wallets recently transferred tens of thousands of seized Bitcoins to Coinbase Prime custody addresses. Although this move primarily constitutes routine asset consolidation rather than an open-market sell-off, the news spread across communities, triggering panic selling pressure from retail investors and short-term capital.
Under the impact of these two major headwinds, Bitcoin prices came under pressure and moved lower, dragging down other cryptocurrencies and triggering a chain reaction of long contract liquidations. A large volume of high-leverage long positions had accumulated above $85,000; as the price of BTC pulled back toward the $80,000 support level, it triggered a series of liquidations in the derivatives market, further intensifying short-term downward momentum. In just 24 hours, over 180,000 traders were liquidated, with total liquidations exceeding $1 billion, including $940 million in long liquidations.
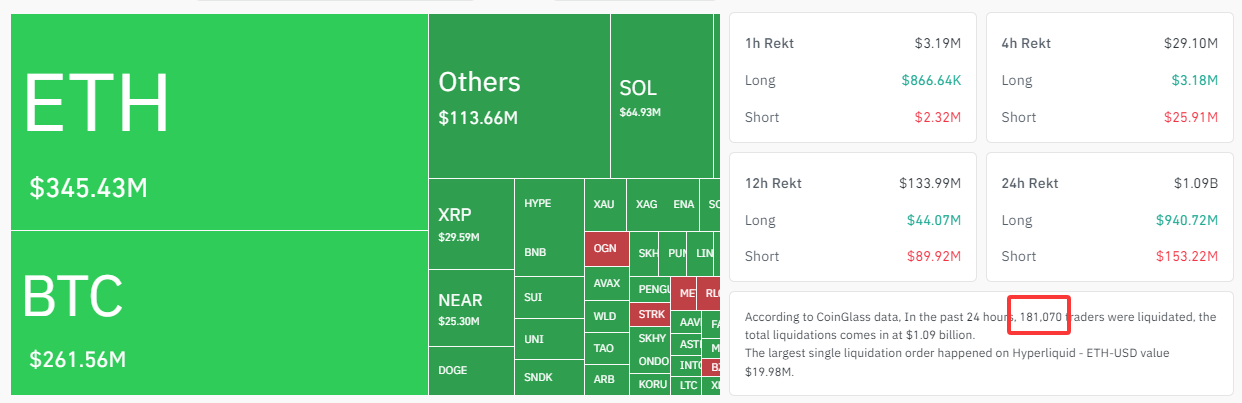 Cryptocurrency Liquidation Data, Source: CoinGlass
Bitcoin prices have fallen for four consecutive trading sessions, briefly dipping below the key support level of $82,000 this morning before quickly rebounding to reclaim it. If today's closing price fails to hold above this level, it suggests that the bullish structure may be compromised, with $80,000 serving as a further confirmation signal—a psychological threshold and the bull-bear dividing line of the recent bullish structure. Once lost, it will break the higher-low trend intact since July, gradually testing defense lines at $75,000, $70,000, and $60,000.
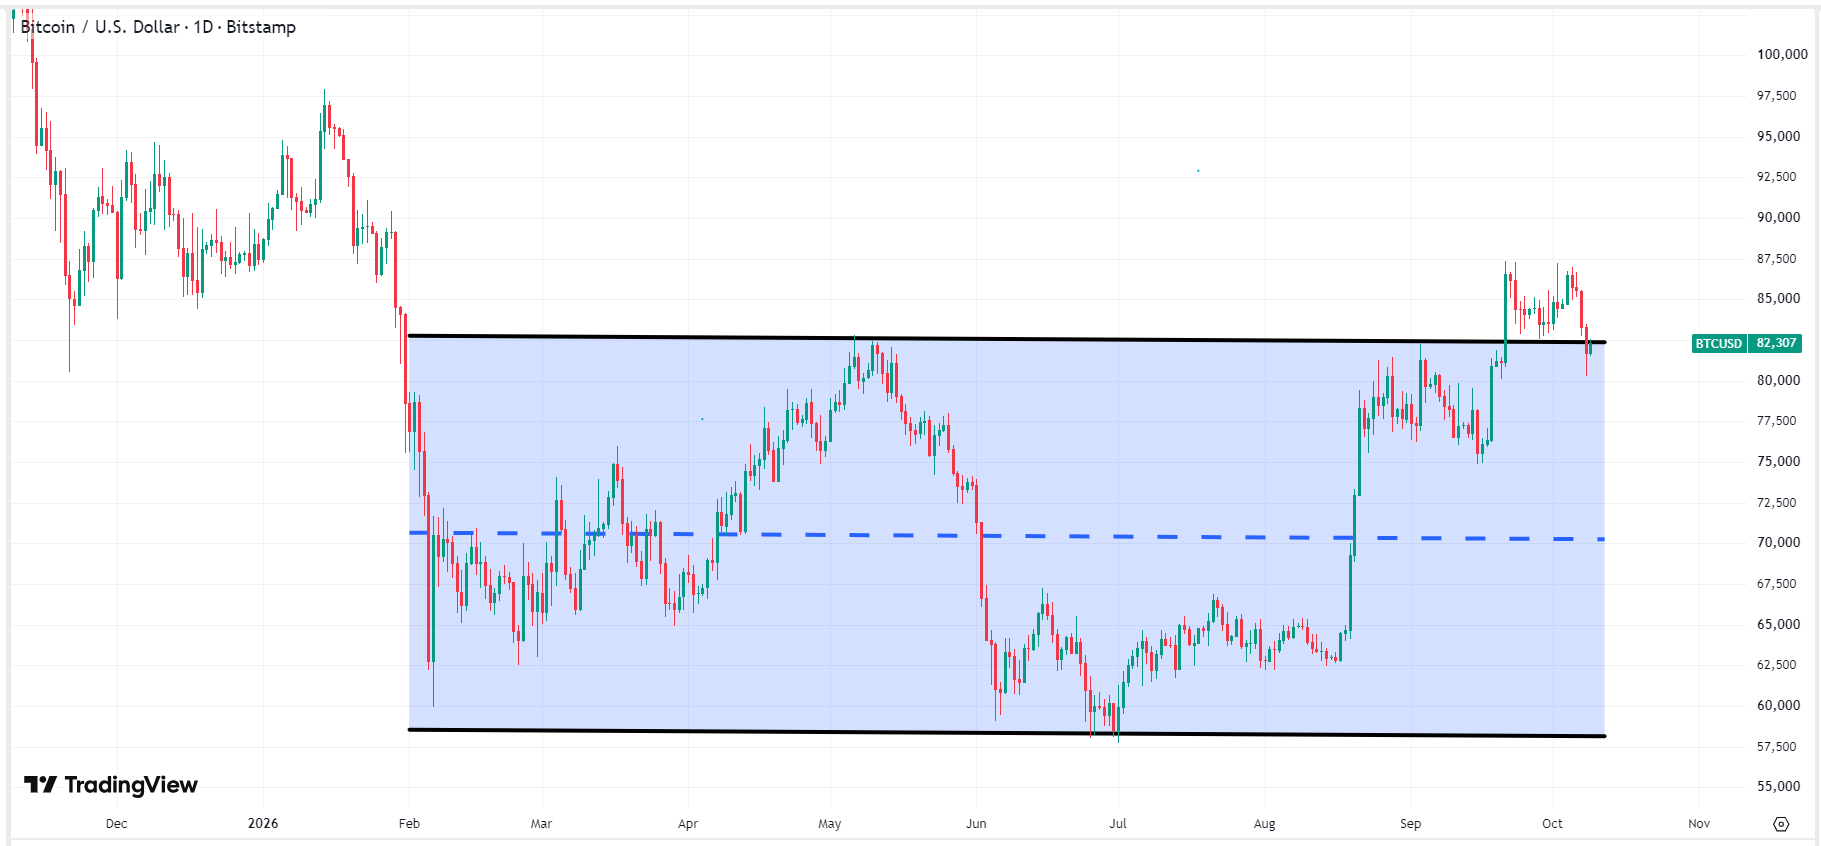 Bitcoin Price Chart, Source: TradingView
Recommended Articles


