Ethereum Price Forecast: Staked ETH soars to record high despite weakening institutional interest

Source Fxstreet

Ethereum price today: $1,900

  • The total supply of staked ETH reached a record high of 39.69 million ETH.
  • US spot ETH ETFs have recorded 15 consecutive days of net outflows.
  • A break below $1,909 could send ETH toward the $1,740 level.

Ethereum (ETH) total staked value is rising again after declining between mid-April and mid-May. The staked ETH supply has reached a record high of 39.69 million ETH, suggesting that investors are now likely chasing yield to offset price declines rather than exiting the market entirely.

ETH Total Value Staked. Source: CryptoQuant

The cohort primarily responsible for holding onto their tokens is wallets with balances of 10K-100K ETH. These investors increased their collective balance by 120K ETH last week, a slight improvement from the previous week, when their holdings saw minimal changes.

However, retailers maintained distribution, with wallets holding 100-1K and 1K-10K ETH offloading a combined 336K ETH last week. The move suggests onchain activity is tilting bearish, as retail distribution outweighs whale accumulation.

Institutional participation also continues to weaken, with US spot ETH exchange-traded funds (ETFs) recording 15 consecutive days of net outflows.

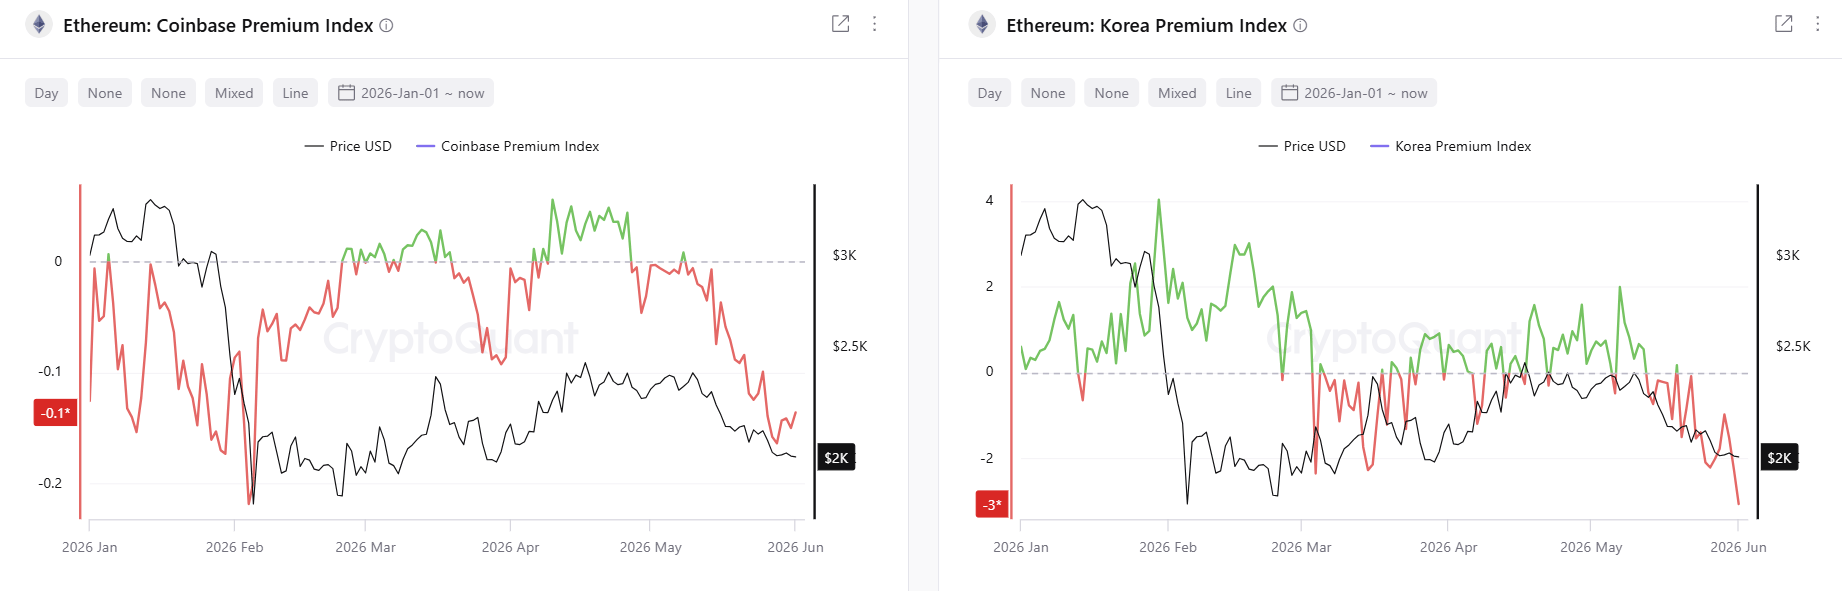
Meanwhile, interest in ETH across leading crypto market regions, the US and South Korea, is declining rapidly, as evidenced by the downtrend in the Coinbase and Korea Premium Indexes.

ETH Coinbase and Korea Premium Indexes. Source: CryptoQuant

On the derivatives side, negative readings are expanding in the Binance Net Taker Volume, which measures the difference in volume between long and short traders using market orders. The move indicates short positioning has dominated recent volumes in ETH perpetuals.

ETH Net Taker Volume. Source: CryptoQuant

Ethereum Price Forecast: ETH could fall to $1,740

On the daily chart, ETH is extending a bearish phase as price holds well below the 20-, 50- and 100-day Exponential Moving Averages (EMAs) at $2,082, $2,162 and $2,262, respectively.

The cluster of overhead EMAs, together with nearby horizontal barriers at $2,018 and $2,107, suggests rallies are likely to be capped for now, while the Relative Strength Index (RSI) at 24 and a deeply depressed Stochastic near zero highlight oversold but still pressured momentum.

Chart Analysis ETH/USDT (Binance)
ETH/USDT daily chart

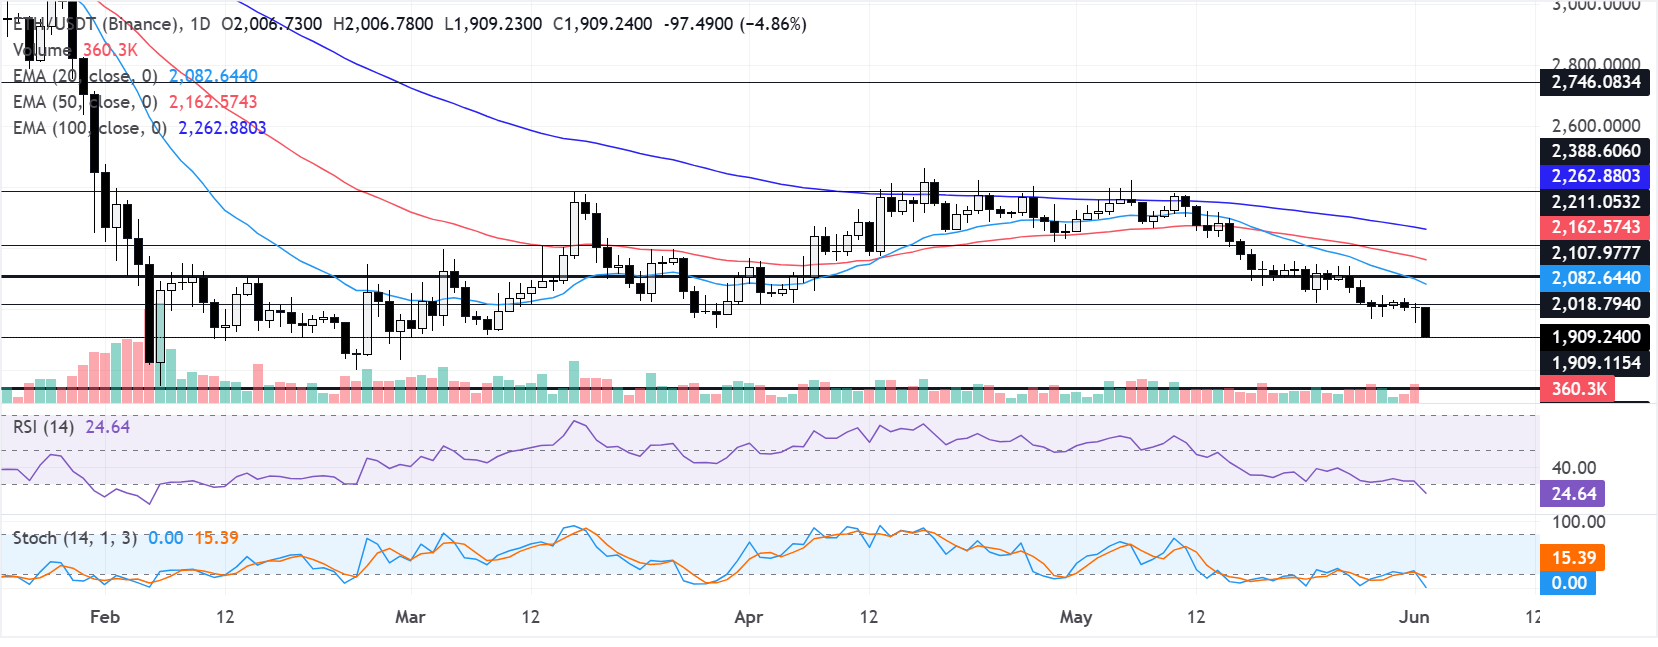
On the downside, immediate support is near $1,909, below which sellers could target $1,741, with subsequent floors emerging at $1,524 and $1,404 if bearish pressure deepens.

(The technical analysis of this story was written with the help of an AI tool.)

Disclaimer: For information purposes only. Past performance is not indicative of future results.
placeholder
Will the Tech Rally Continue? The Technical Verdict on the NASDAQ 100 Riding a massive 32% post-earnings wave, the Nasdaq-100 is showing its first signs of exhaustion. We break down crucial exit and entry rules for long positions this week.
Author  Mitrade Team
6 Month 05 Day Fri
Riding a massive 32% post-earnings wave, the Nasdaq-100 is showing its first signs of exhaustion. We break down crucial exit and entry rules for long positions this week.
placeholder
Markets on a Wire: Imminent US Inflation Data Threatens to Lock In Fed Rate Hikes Imminent CPI and PPI data threaten to lock in a hawkish Federal Reserve rate hike cycle, leaving gold, tech equities, and Bitcoin highly vulnerable to a programmatic sell-off.
Author  Mitrade Team
6 Month 09 Day Tue
Imminent CPI and PPI data threaten to lock in a hawkish Federal Reserve rate hike cycle, leaving gold, tech equities, and Bitcoin highly vulnerable to a programmatic sell-off.
placeholder
US Attacks Iran Amid the “Ceasefire”: Bitcoin, Gold, and Oil ReactThe United States launched strikes against Iran on Tuesday after a US Apache helicopter was downed over the Strait of Hormuz, breaking the fragile ceasefire previously announced by President Donald Tr
Author  Mitrade Team
6 Month 10 Day Wed
The United States launched strikes against Iran on Tuesday after a US Apache helicopter was downed over the Strait of Hormuz, breaking the fragile ceasefire previously announced by President Donald Tr
placeholder
15 Days After SpaceX Listing, Index Funds Will Take 30% of Floating Shares, What It Means for Retail Investors?TradingKey - SpaceX (SPCX.US) is set to debut on Nasdaq on June 12, targeting a valuation of $1.75 trillion. At that time, only about 3% to 4% of total shares will be freely tradable; with founder sha
Author  Mitrade Team
6 Month 10 Day Wed
TradingKey - SpaceX (SPCX.US) is set to debut on Nasdaq on June 12, targeting a valuation of $1.75 trillion. At that time, only about 3% to 4% of total shares will be freely tradable; with founder sha
placeholder
Gold Price Analysis (XAU/USD): Gold Falls to 6-Month Low as Inflation Fuels Rate Hike Bets, A Buying Opportunity or a Falling Knife? Gold hit a 6-month low on Fed rate hike bets. However, strong central bank buying and technical indicators suggest potential tactical bounces and long-term accumulation windows.
Author  Mitrade Team
6 Month 12 Day Fri
Gold hit a 6-month low on Fed rate hike bets. However, strong central bank buying and technical indicators suggest potential tactical bounces and long-term accumulation windows.
Related Instrument
goTop
quote