

2026 Brent Crude Price Outlook: Falling Below $80, Where Is the Next Key Level?
TradingKey - On June 22 ET, Brent crude closed down $2.67 at $77.90 a barrel, breaking below the $80 threshold. In early trading, stimulated by geopolitical rhetoric and rumors of blockades, prices had briefly surged to $82.30, but reversed sharply to plunge as news of peace talks emerged.
The immediate catalyst for the drop in oil prices came from the U.S. Department of the Treasury. As part of a negotiation framework, the Treasury issued a 60-day general license authorizing transactions involving the production, transport, and sale of Iranian-origin crude oil, petrochemicals, and petroleum products. This allows Iran to receive U.S. dollars in oil transactions for the first time in decades, with the waiver period extending to August 21, 2026.
However, greater supply pressure came from OPEC+. Seven core OPEC+ members increased production by 206,000 barrels per day (bpd) each in April and May, boosted output by 188,000 bpd in June, and plan another 188,000 bpd increase in July, continuing the expansion pace since March this year. Saudi Arabia and Kuwait simultaneously cut their Official Selling Price (OSP) premiums to Asia for July, with Kuwait slashing its premium over the Oman/Dubai average from $12.75 to $5.25.
There was no offset from the demand side. Europe's May manufacturing PMI stood at 51.6, hovering near the 50 expansion-contraction threshold, indicating a sluggish recovery in industrial demand. Chinese refinery operating rates showed no signs of accelerating; if import demand falls short of expectations, it will further weigh on prices. Furthermore, if the U.S. dollar strengthens due to the Federal Reserve maintaining high interest rates, it will also dampen crude demand. Citi lowered its Brent price forecast to $75 for the third quarter and $70 for the fourth quarter.
The U.S. Strategic Petroleum Reserve (SPR) has dropped to 331.2 million barrels, the lowest since June 1983. The Trump administration had authorized the release of 172 million barrels. While this is a potential price floor, replenishment comes with conditions: the government typically sets target prices, and large-scale buybacks require congressional appropriations, meaning falling prices won't trigger an immediate floor.
On the geopolitical front, the U.S. and Iran have reached a preliminary agreement on a 60-day negotiation roadmap, but Iran has made it clear that negotiations on the nuclear issue have not yet started, and Israel continues its hardline interference. Although the risk premium has been suppressed, it has not disappeared; stalled talks or an escalation in the Middle East could reverse market sentiment at any time.
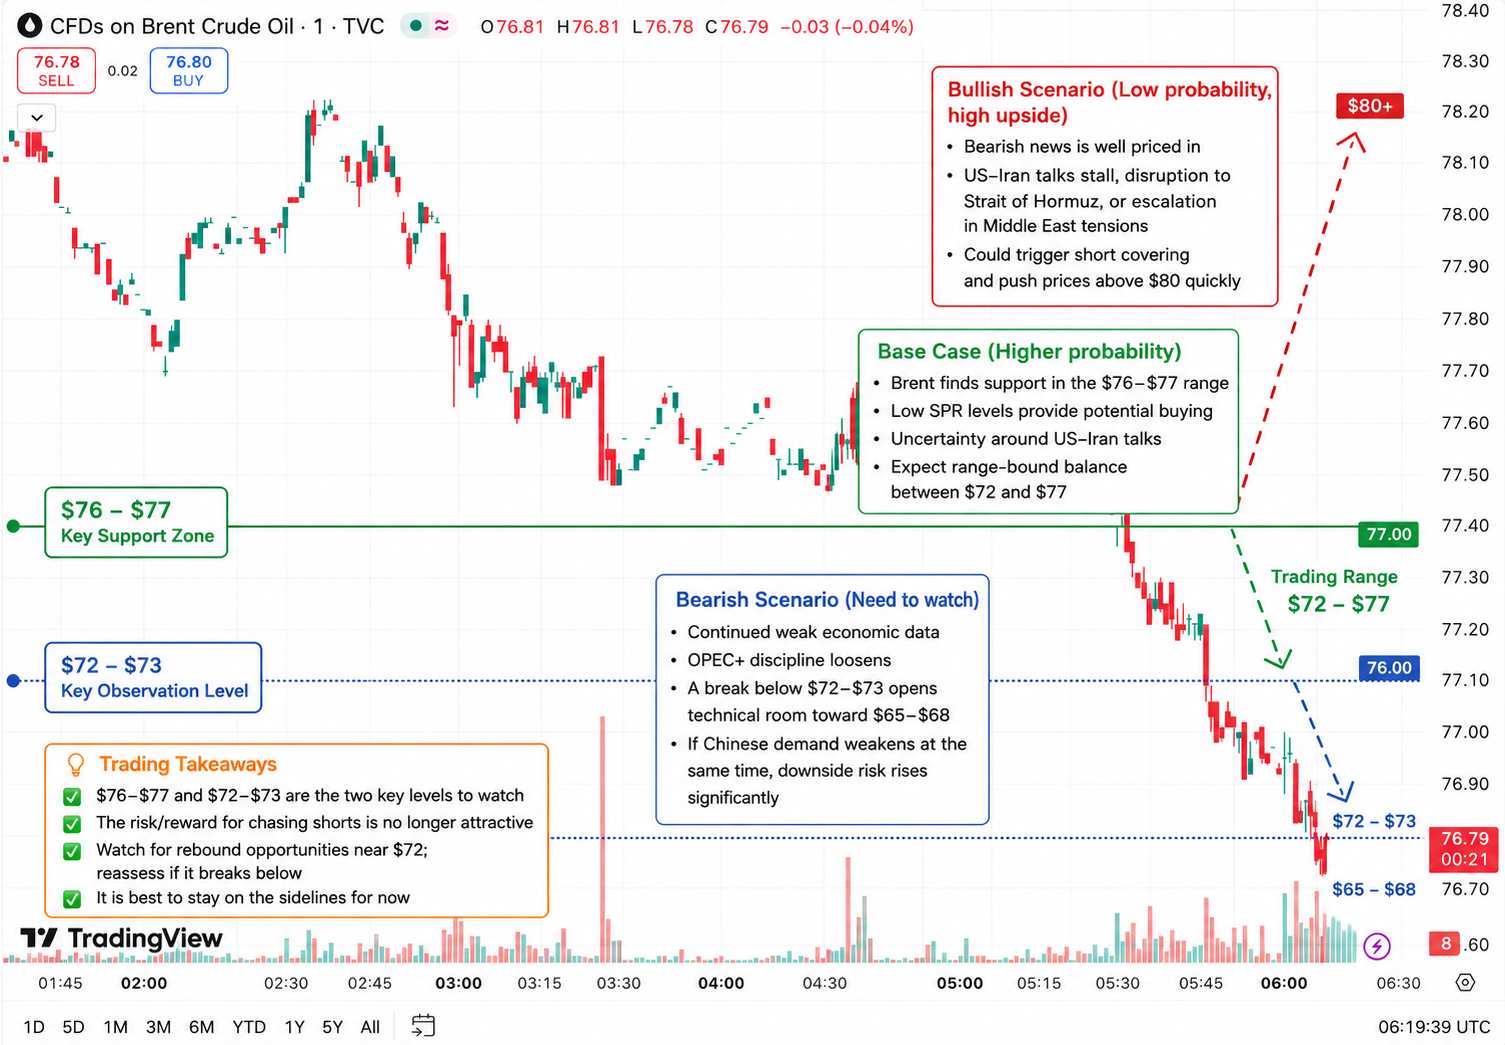
[Brent Crude Oil Price Trend, Source: TradingView]
Overall, bullish and bearish factors in the current crude oil market are intertwined, and institutional divergence on the outlook has widened significantly. Based on current information, we outline the potential trends under different scenarios as follows:
Base Case (Higher Probability): Brent finds support at $76 to $77, with low SPR levels providing potential buying interest, while U.S.-Iran negotiations remain uncertain. Prices are expected to seek a temporary equilibrium in the $72 to $77 range.
Bearish Case (Caution Warranted): Economic data continues to deteriorate or OPEC+'s production cut discipline relaxes. A break below $72 to $73 would technically open up room down to $65 to $68. If China's demand for crude oil slows in tandem, risks will rise significantly.
Bullish Case (Low Probability, High Elasticity): Bearish factors are already largely priced in. Stalled U.S.-Iran talks, transit disruptions in the Strait of Hormuz, or an escalation in the Middle East could all trigger short covering, quickly pushing prices back above $80.
The $76 to $77 and $72 to $73 ranges are two key levels to watch. The risk-reward ratio for chasing one-way shorts is no longer attractive. If prices drop close to $72, investors can look for rebound opportunities and reassess if it breaks below. Currently, a wait-and-see stance is recommended.
Recommended Articles


