

AUD/USD Price Forecast: More downside looks likely towards 0.6830
- AUD/USD slumps to near 0.6900 due to the US Dollar’s outperformance.
- The Fed is expected to deliver at least one interest rate hike this year.
- Australia’s headline CPI growth cools down further to 4% in May.
The AUD/USD pair is down 0.28% to near 0.6900 during the European trading session on Wednesday, the lowest level seen in over two months. The Aussie pair continues to decline as the US Dollar (USD) outperforms due to firm expectations that the Federal Reserve (Fed) will deliver at least one interest rate hike this year.
During press time, the US Dollar Index (DXY), which gauges the Greenback’s value against six major currencies, trades 0.17% higher to near 101.57.
The CME FedWatch tool shows that there is an almost 86% chance that the Fed will deliver atleast one interest rate hike by the year-end.
Hawkish Fed bets have accelerated as both headline and the core Consumer Price Index (CPI) have been accelerating in the past few months.
Meanwhile, the Australian Dollar (AUD) underperforms after the release of the mixed Australian CPI data for May. The headline CPI unexpectedly cools down to 4% Year-on-Year (YoY) from 4.2%, while it was expected to grow at a faster pace of 4.4%. The core CPI rose by 3.6% YoY, faster than 3.5% estimates and the previous reading of 3.4%.
AUD/USD technical analysis
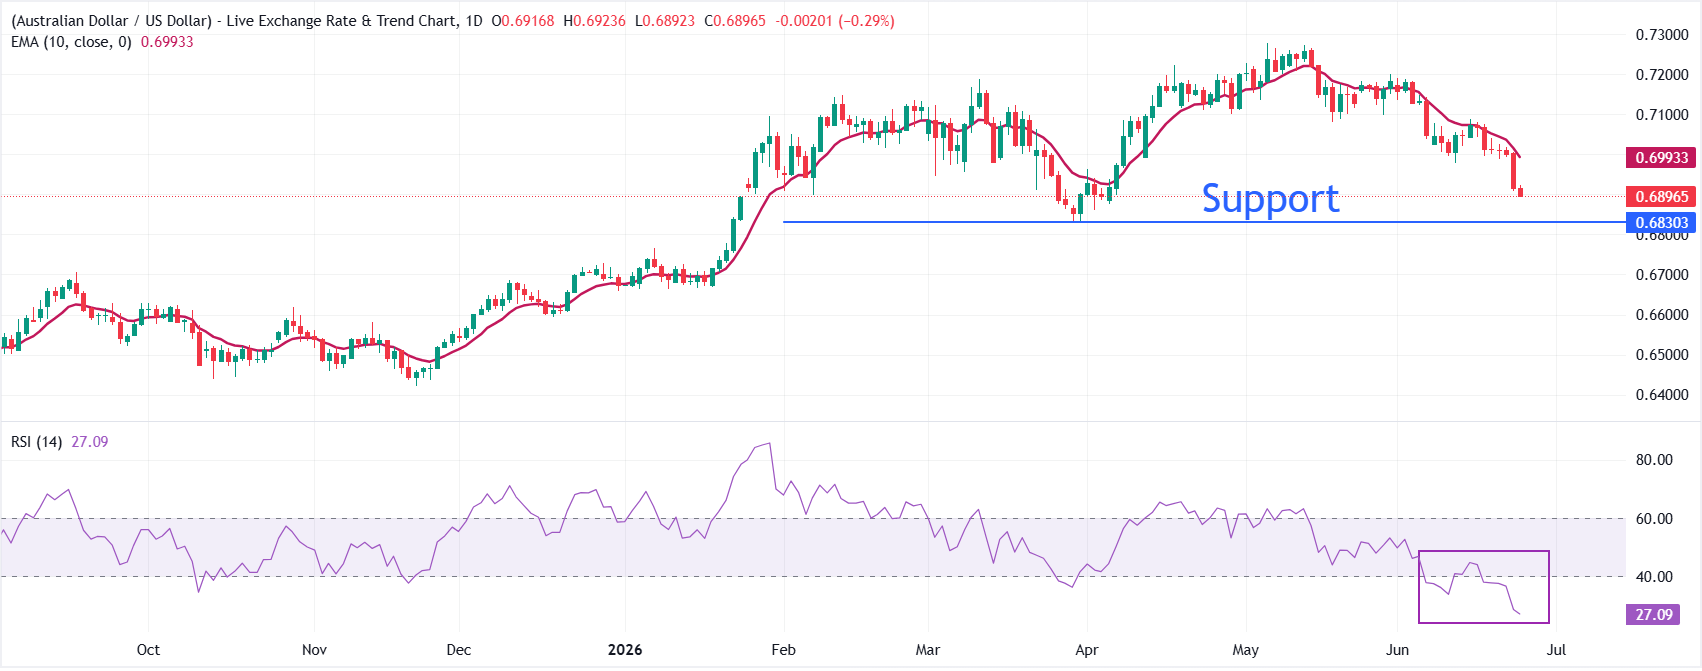
AUD/USD trades lower at around 0.6900, maintaining a bearish near-term bias as spot holds beneath the 10-day exponential moving average (EMA) at 0.6993.
The pair continues to trade below this short-term trend gauge, suggesting rallies are likely to face selling interest while the Relative Strength Index (RSI) at 27 remains in oversold territory, hinting that downside pressure is strong but becoming stretched.
On the topside, initial resistance is located at the 10-day EMA around 0.6993, and a daily close above this level would be needed to ease the immediate bearish tone. Looking down, the pair could extend its decline to the March 30 low at 0.6833.
(The technical analysis of this story was written with the help of an AI tool.)
Economic Indicator
Consumer Price Index (YoY)
The Consumer Price Index (CPI), released by the Australian Bureau of Statistics on a monthly basis, measures the changes in the price of a comprehensive basket of goods and services acquired by household consumers. The indicator is the primary measure of headline inflation after a new methodology was applied to transition from quarterly to monthly readings, applying to data from April 2024 onwards. The YoY reading compares prices in the reference month to the same month a year earlier. A high reading is seen as bullish for the Australian Dollar (AUD), while a low reading is seen as bearish.
Read more.Last release: Wed Jun 24, 2026 01:30
Frequency: Monthly
Actual: 4%
Consensus: 4.4%
Previous: 4.2%
Source: Australian Bureau of Statistics
Recommended Articles


