

Bitcoin (BTCUSD) Suddenly Goes down 1.26% on Jun 23: What's Driving This
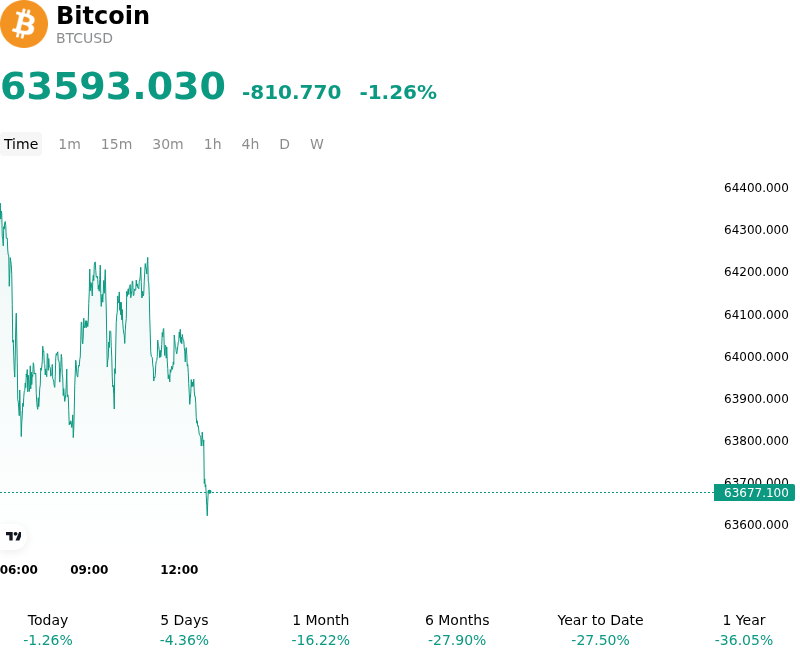
Bitcoin (BTCUSD) is down 1.26% at Jun 23 01:00(ET), now at $63593.03, with a 7-day down of 3.39%.
What is driving Bitcoin (BTCUSD)’s stock price down today?
The recent intraday pullback in Bitcoin reflects a combination of persistent institutional capital outflows, a hawkish shift in macroeconomic expectations, and a general reduction in risk appetite among market participants. Over the past month, the digital asset ecosystem has grappled with a significant retreat of institutional capital. Sustained net outflows from spot Bitcoin exchange-traded funds (ETFs) alongside a reduction in stablecoin supply have collectively removed billions of dollars from the market, highlighting a broader de-risking phase ahead of the summer. Without steady inflows from these investment vehicles to support spot prices, Bitcoin remains highly vulnerable to minor liquidity shocks and shifts in investor sentiment.
A primary catalyst for this cautious sentiment is the shifting outlook for global monetary policy. Recent economic indicators and policy signals have fueled concerns that the Federal Reserve will maintain a hawkish stance, potentially holding interest rates at elevated levels for longer than previously anticipated, or even keeping further hikes on the table. This prospect has pushed U.S. Treasury yields, particularly shorter-duration instruments, to multi-month highs. Higher yield environments directly diminish the appeal of non-yielding assets like Bitcoin, as institutional investors increasingly allocate capital to risk-free, cash-equivalent instruments. Furthermore, tighter global liquidity conditions reduce the volume of speculative capital flowing into digital asset markets.
Geopolitical developments have also introduced a layer of macro uncertainty that continues to weigh on the asset class. While fluctuations in international diplomatic negotiations occasionally offer brief reprieves, the underlying geopolitical friction keeps risk-averse behavior at the forefront. During these episodes of heightened risk-off sentiment, Bitcoin has historically tended to correlate more closely with equities and risk assets rather than acting as a safe-haven asset, prompting near-term traders to trim exposure.
On-chain metrics and market structure indicators confirm that the downside pressure has triggered a phase of investor capitulation rather than orderly profit-taking. Realized losses have spiked relative to realized profits, indicating that a subset of recent buyers is exiting positions at a loss due to the lack of upward momentum. Derivatives positioning has similarly shifted toward a more defensive posture, characterized by rising put option premiums and a declining call-to-put ratio, signaling that market participants are actively hedging against further downward movement.
In the absence of a clear dovish pivot from central banks or a resurgence in spot ETF inflows, Bitcoin remains stuck in a tight consolidation phase. Key technical resistance levels continue to cap immediate rebound attempts, leaving the market in search of a strong fundamental catalyst to reverse the current capital outflows and restore long-term structural momentum.
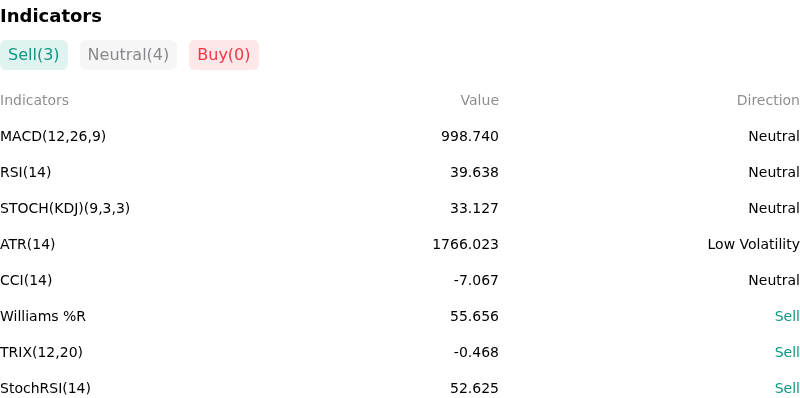
Technical Analysis of Bitcoin (BTCUSD)
Technically, Bitcoin (BTCUSD) shows a MACD (12,26,9) value of 998.740, indicating a neutral signal. The RSI at 39.638 suggests neutral condition and the Williams %R at 55.656 suggests sell condition. Please monitor closely.
More details about Bitcoin (BTCUSD)
Recent Events and Risks:
- Record-High Spot ETF Capital Flight: U.S. spot Bitcoin ETFs registered their largest rolling 30-day net outflow on record as of June 22, 2026, with institutional allocators withdrawing $6.35 billion over a six-week redemption streak. This sustained capital drain has removed key institutional buying support, leaving the market highly vulnerable to structural supply overhangs.
- Hawkish Federal Reserve Reset and Rising Yields: Following a hawkish policy pivot by new Fed Chair Kevin Warsh—driven by May CPI printing at 4.2%—markets are now pricing in a 36% probability of a July interest rate hike. This hawkish shift has propelled the U.S. Dollar Index to the 100.6–100.8 range and lifted short-term Treasury yields to cycle highs, severely increasing the holding opportunity cost of non-interest-bearing risk assets like Bitcoin.
- Aggressive Leverage Build-up and Liquidation Squeeze Risk: Derivatives market activity remains highly volatile, highlighted by fresh aggressive short-selling, including newly tracked wallets opening high-leverage 20x short positions. Traders warn that following the massive $3 billion liquidation cascade earlier this month, any renewed macro shock that breaches the immediate $62,000–$60,000 support band could trigger another forced leverage-unwinding event.
- Bearish Technical Formations and Fading Momentum: Technical indicators confirm that BTCUSD has failed to sustain its recent recovery attempts, slipping back below its 50-day Exponential Moving Average (EMA50) and forming a bearish flag break-and-retest pattern on the daily charts. A bearish divergence in relative strength indicators highlights fading buying strength, leaving the asset open to a probable retest of the $59,100 year-to-date low.
Recommended Articles


