


Solana Price Forecast: Warning signs emerge as SOL's long-term trendline comes under pressure
- Solana trades below $90 on Friday, testing a long-term support trendline after over 6% losses the previous day.
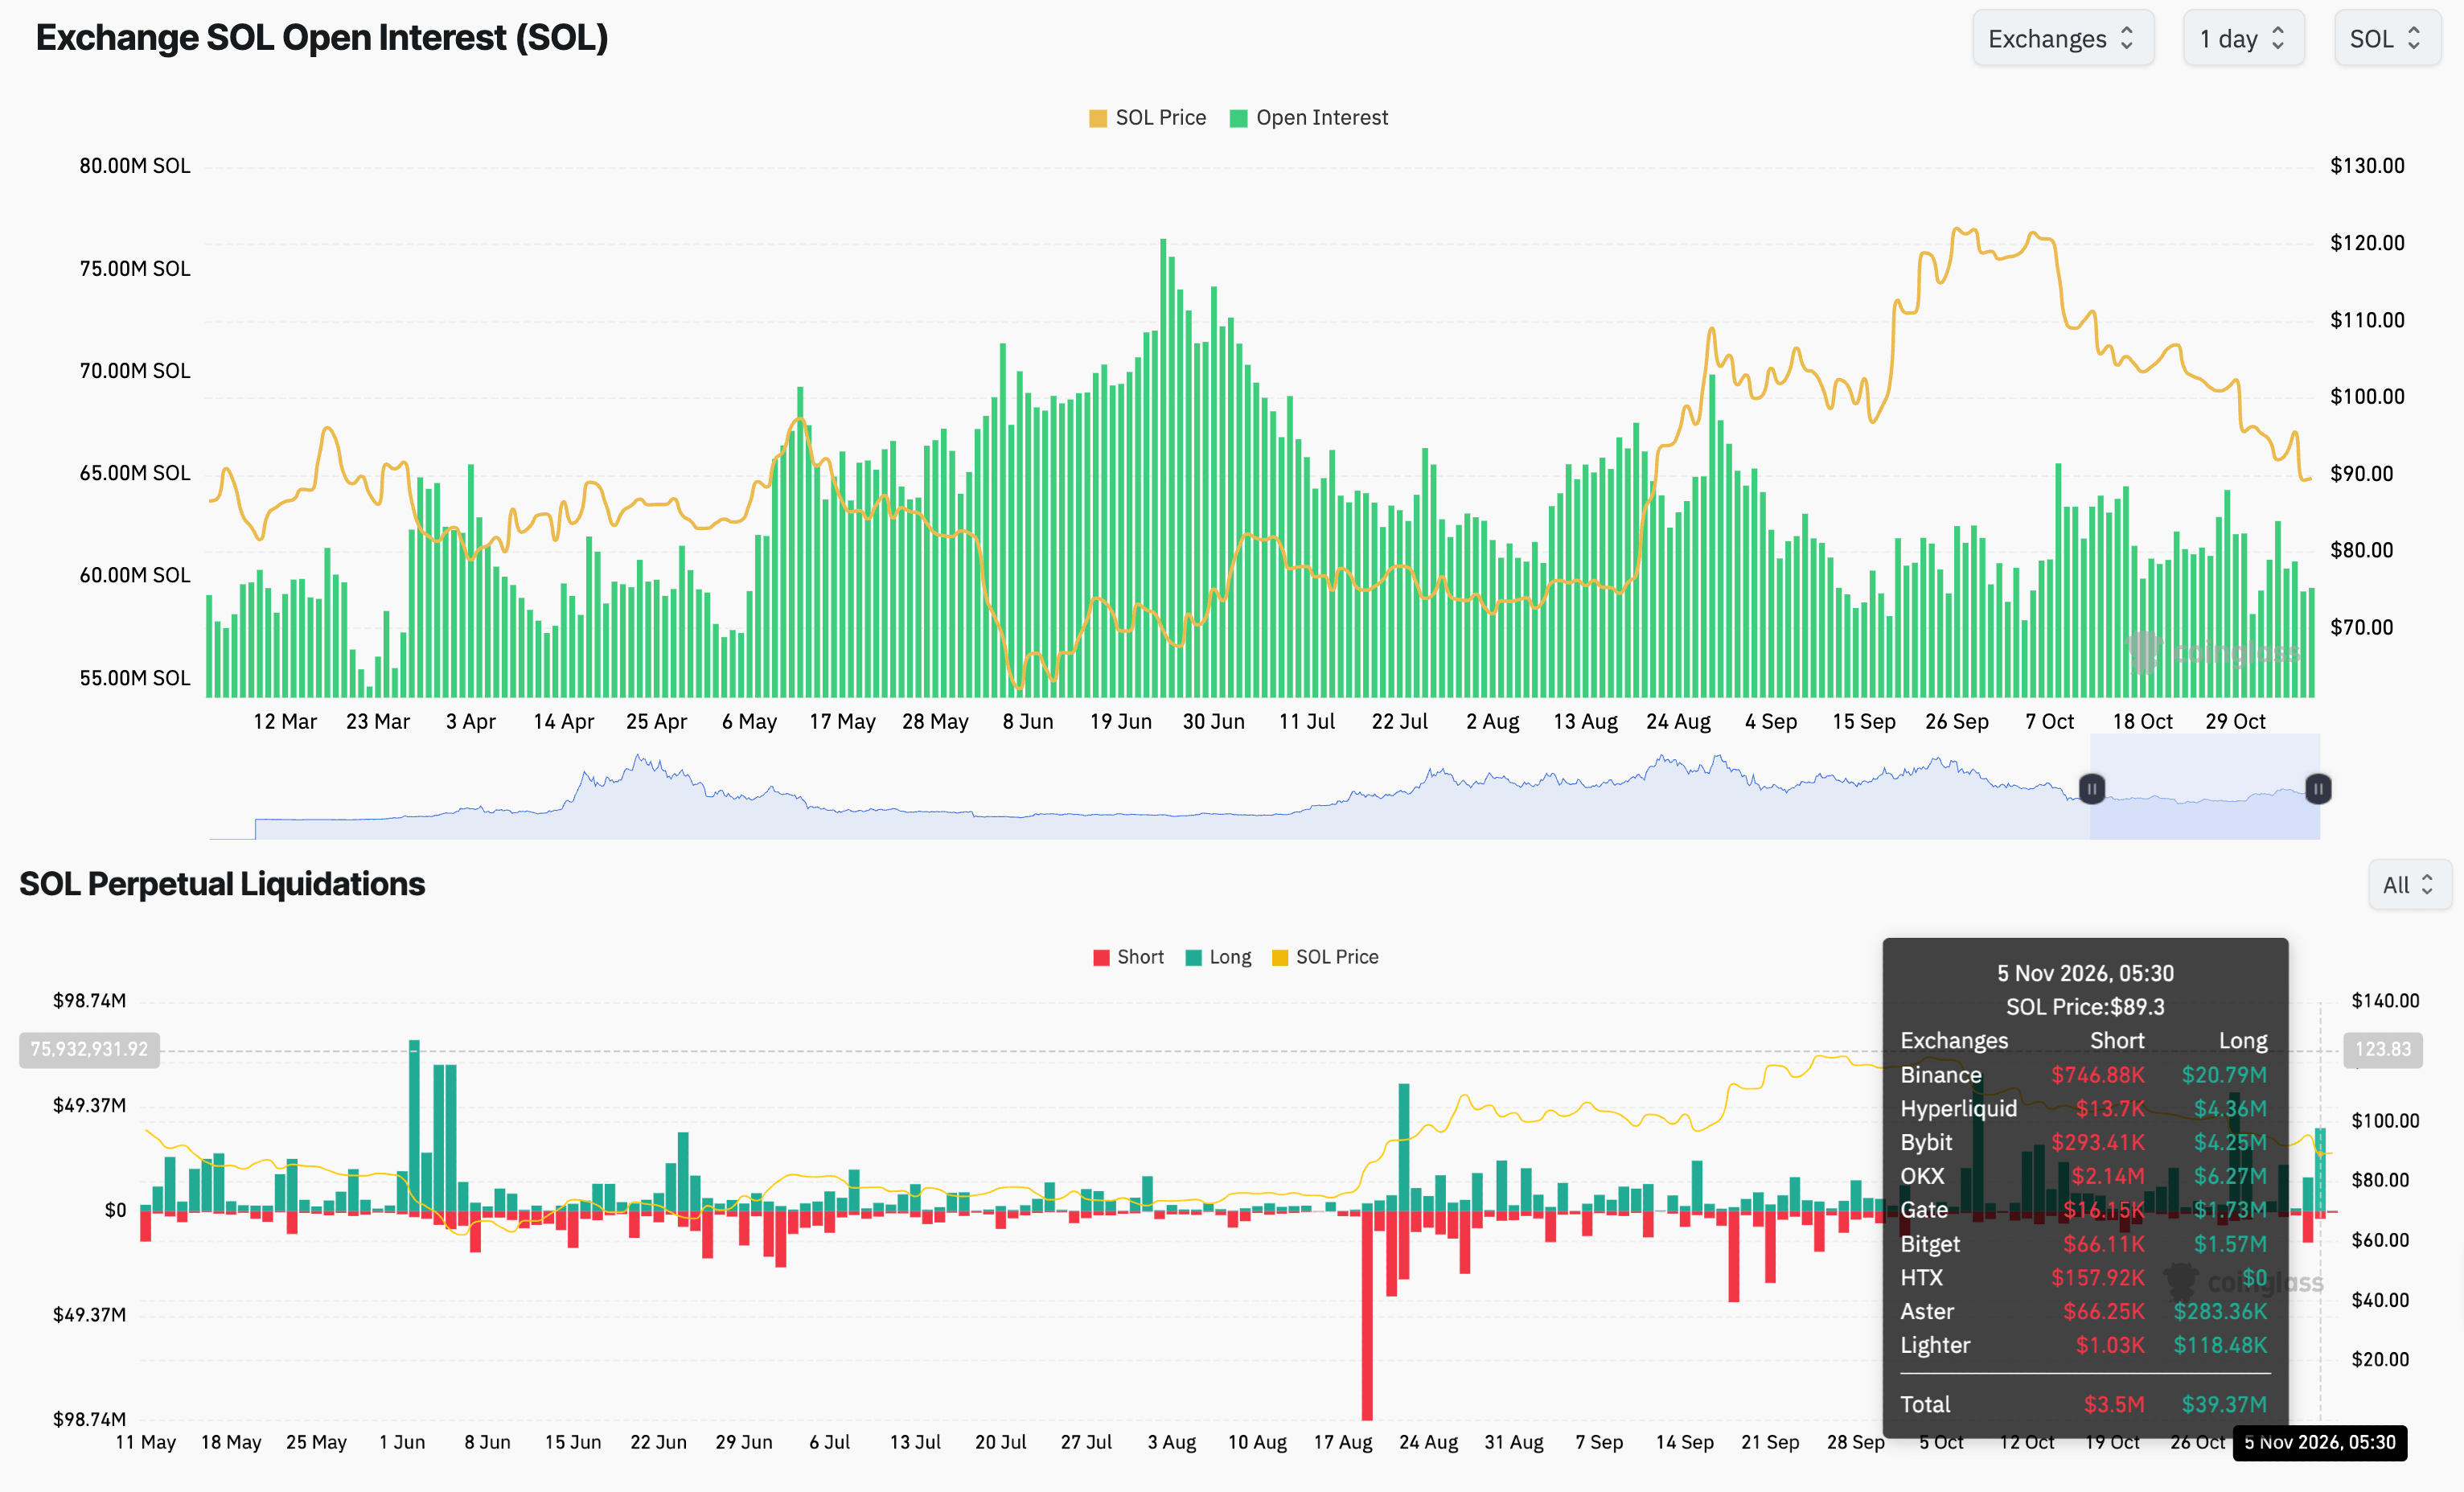
- Declining SOL futures Open Interest amid roughly $40 million liquidation on Thursday suggests a sell-side dominance.
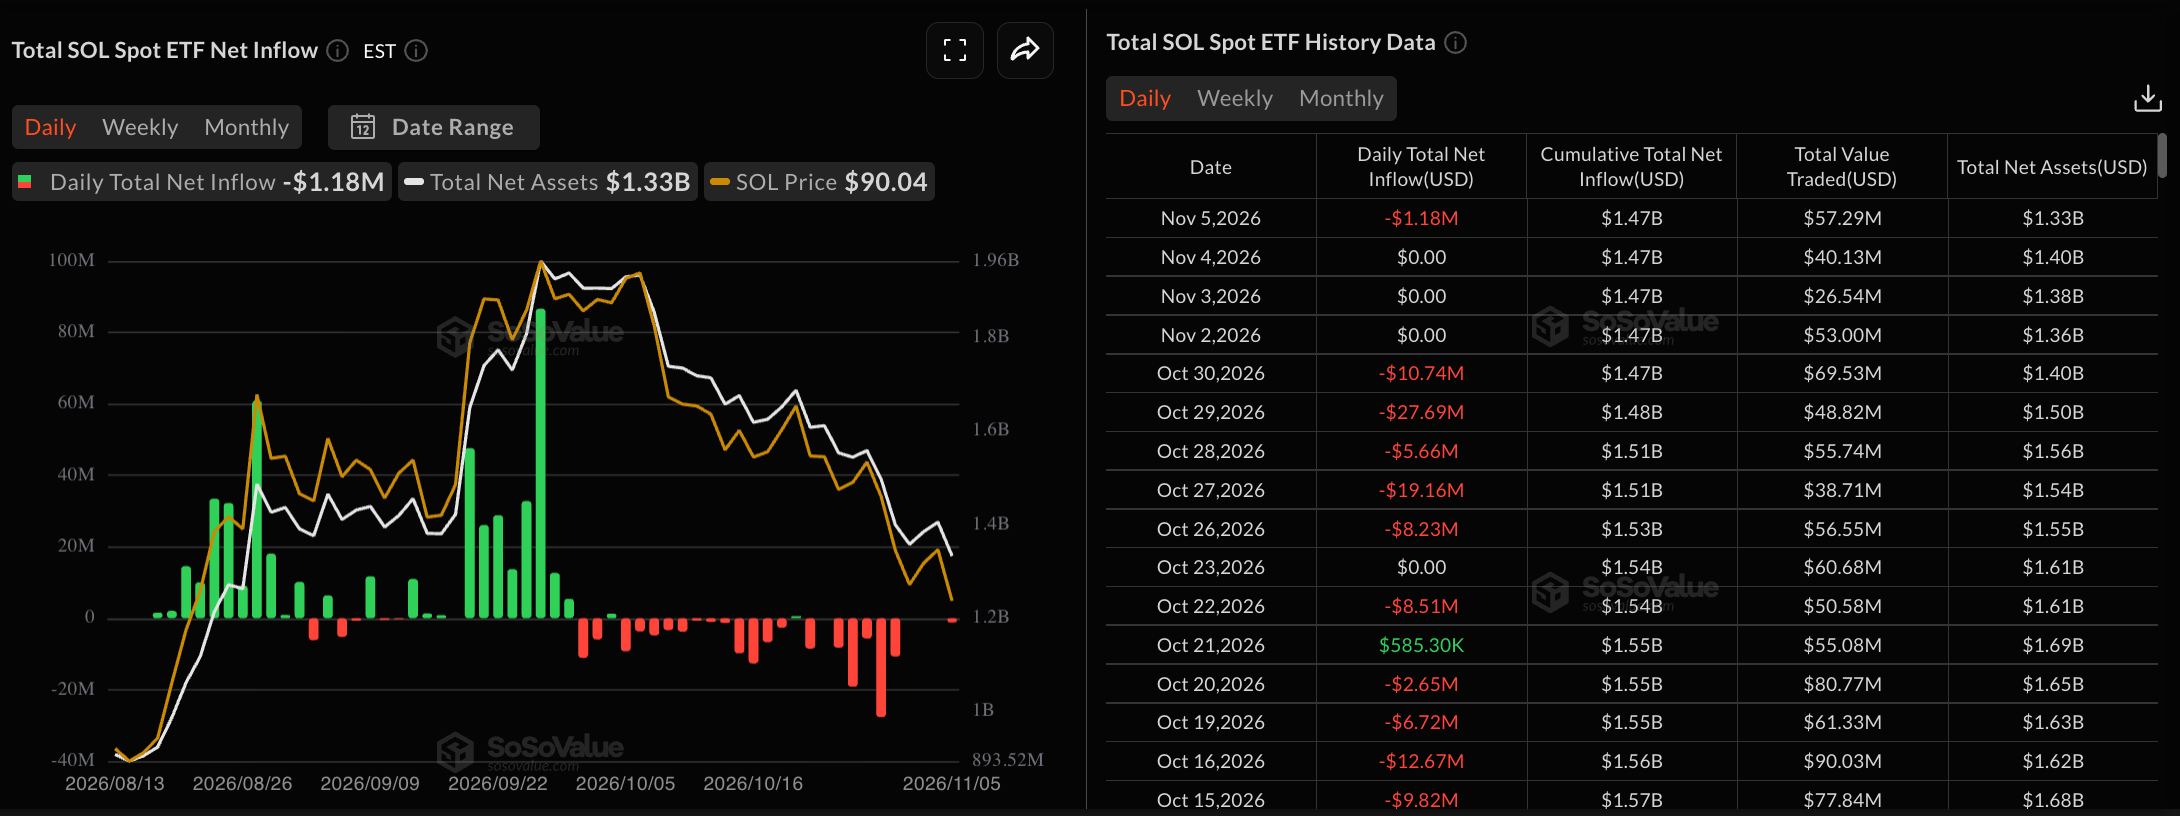
- SOL ETFs face persistent selling pressure, with $1.18 million in withdrawals on Thursday, after last week’s largest weekly outflow of $71.47 million.
Solana (SOL) trades at a two-month low below $90.00 on Friday, following over 6% losses the previous day as the broader cryptocurrency market hit over $1 billion in liquidations. Derivatives data show declining appeal for Solana among traders as Open Interest sinks while institutional investors withdrew $1.18 million from SOL-focused Exchange Traded Funds (ETFs), extending last week’s largest outflow of $71.47 million.
Technically, Solana could extend its decline toward the $70.00 round figure if the price slips below the $87.21 horizontal support.
Solana loses retail and institutional appeal
Institutional and retail investors’ risk appetite for Solana takes a hit as the broader cryptocurrency market sentiment declines amid macroeconomic uncertainty. Democrats sweeping the US midterms amid the ongoing AI debt crises fuels risk-off sentiment.
SOL-focused ETFs recorded $1.18 million in outflows on Thursday after three consecutive days of silence, suggesting that the institutional investors took a breather after last week’s $71.47 million withdrawals, marking the largest and fourth straight week of outflows.
On the retail side, CoinGlass data shows that SOL futures Open Interest (OI) is at 59.45 million SOL, down from 62.71 million on Monday, indicating an unwinding of positions so far this week. Total liquidation of $42.87 million on Thursday, led by $39.37 million in long liquidation, indicates that the buy-side positions were the majority as sellers regained dominance.
Solana’s fading appeal, with ETF outflows and declining OI, could further deepen the downside risk.
Technical outlook: Will Solana drop to $70?
Solana trades at $89.65 at press time on Friday, extending its sixth consecutive week of decline. SOL maintains a bearish near-term bias below the 200-day Exponential Moving Average (EMA) at $99.62, while the declining 50-day EMA at $101.92 risks crossing below the 200-day EMA, potentially signaling a Death Cross.
From a technical perspective, SOL tests a long-term rising support trendline, connecting the lows of June 6 and 25, around $89.83. A confirmed breakout below this support could threaten the $87.21 horizontal support, leading to a steeper correction toward the $70.58 floor, last tested on August 1.
Momentum on the daily charts shows a bearish bias, with the Relative Strength Index (RSI) at 29, hovering near oversold territory, and the declining Moving Average Convergence Divergence (MACD) below its signal line in negative territory.
On the topside, a potential rebound from the support trendline could test the 200-day EMA at $99.62, followed by the 50-day EMA at $101.92.
(The technical analysis of this story was written with the help of an AI tool. Know more.)
推薦文章


