


Bitcoin Price Forecast: US midterm elections set up a potential volatility shock for BTC
- Bitcoin holds above the key 200-day EMA but remains capped by the 100-day EMA, with a breakout in either direction likely to determine its next directional bias.
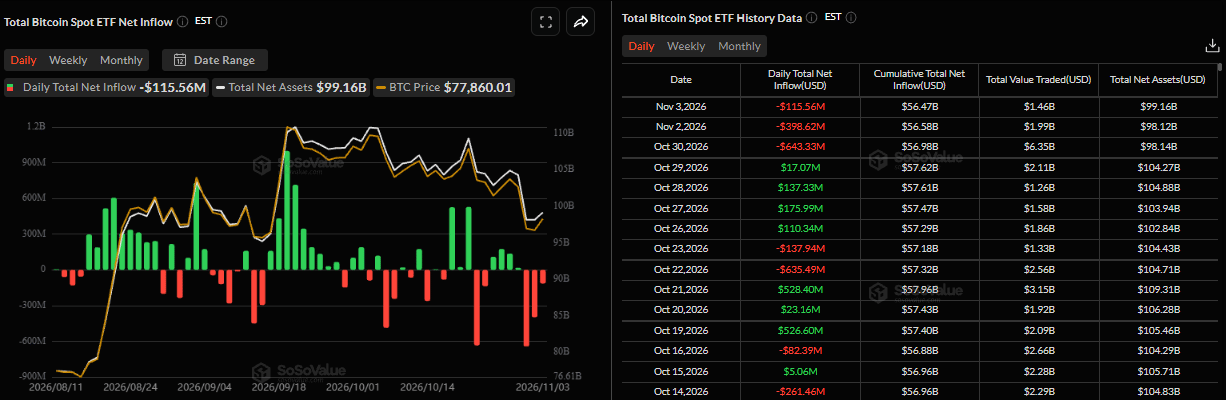
- BTC spot ETFs recorded mild outflows of $115.56 million on Tuesday, suggesting investors remained cautious ahead of the US midterm election results.
- Analysts remain bullish on BTC but expect a significant price swing in either direction, favoring volatility-based strategies over directional bets.
Bitcoin (BTC) hovers between key 100-day and 200-day Exponential Moving Averages (EMAs) on Wednesday. BTC's price action suggests a consolidation phase, with a breakout in either direction likely to determine its next directional bias. Institutional investors have remained cautious ahead of the US midterm election results, with spot Bitcoin Exchange Traded Funds (ETFs) recording mild outflows of $115.56 million on Tuesday.
Meanwhile, K33 Research analysts remain bullish on the Crypto King but expect a potential volatility shock in either direction, favoring volatility-based strategies over directional bets.
Cautions investors with a slight bearish tilt
Institutional demand continues to weaken so far this week. SoSoValue data show that BTC spot ETFs recorded a mild outflow of $115.56 million on Tuesday after a $398.62 million outflow on Monday. The consecutive days of withdrawals suggest investors remain cautious ahead of the US midterm election results, maintaining a slight bearish bias toward BTC. If this outflow trend continues and intensifies throughout this week, BTC could see a deeper correction.
Analysts expect a significant price swing in either direction amid US midterm elections
A K33 Research report on Tuesday identified the US midterm elections as a major catalyst for market volatility this week. Democrats have since secured control of both the House of Representatives and the Senate, setting the stage for a divided government and potential political gridlock during the remainder of US President Donald Trump's term, an outcome K33 Research considers the most market-friendly scenario.
The report further explained that the divergence between Bitcoin's Chicago Mercantile Exchange (CME) futures and perpetual (perp) futures positioning has triggered a significant shift in K33's proprietary regime indicator. Historical comparisons suggest heightened BTC volatility without a clear directional bias, as previous regimes have produced both sharp drawdowns and significant rallies.
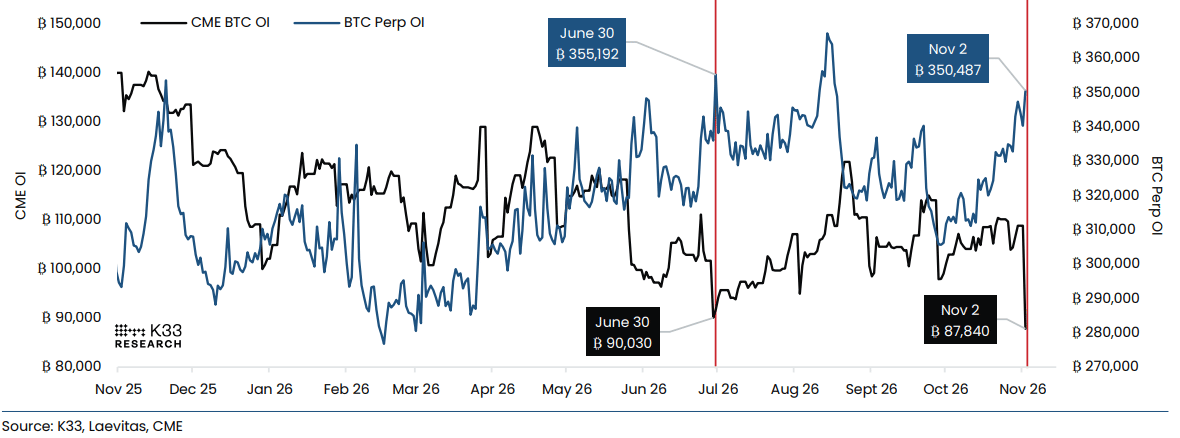
“While we remain bullish on BTC and believe the bottom is in, thin support and elevated leverage leave room for further downside and amplified liquidation-driven moves,” the analyst added.
Moreover, with three-month implied volatility near historically low levels, K33 favors positioning for volatility rather than direction, particularly through long straddles that could benefit from substantial Bitcoin price movements following the election.
Bitcoin technical outlook: Consolidates between 100-day and 200-day EMAs
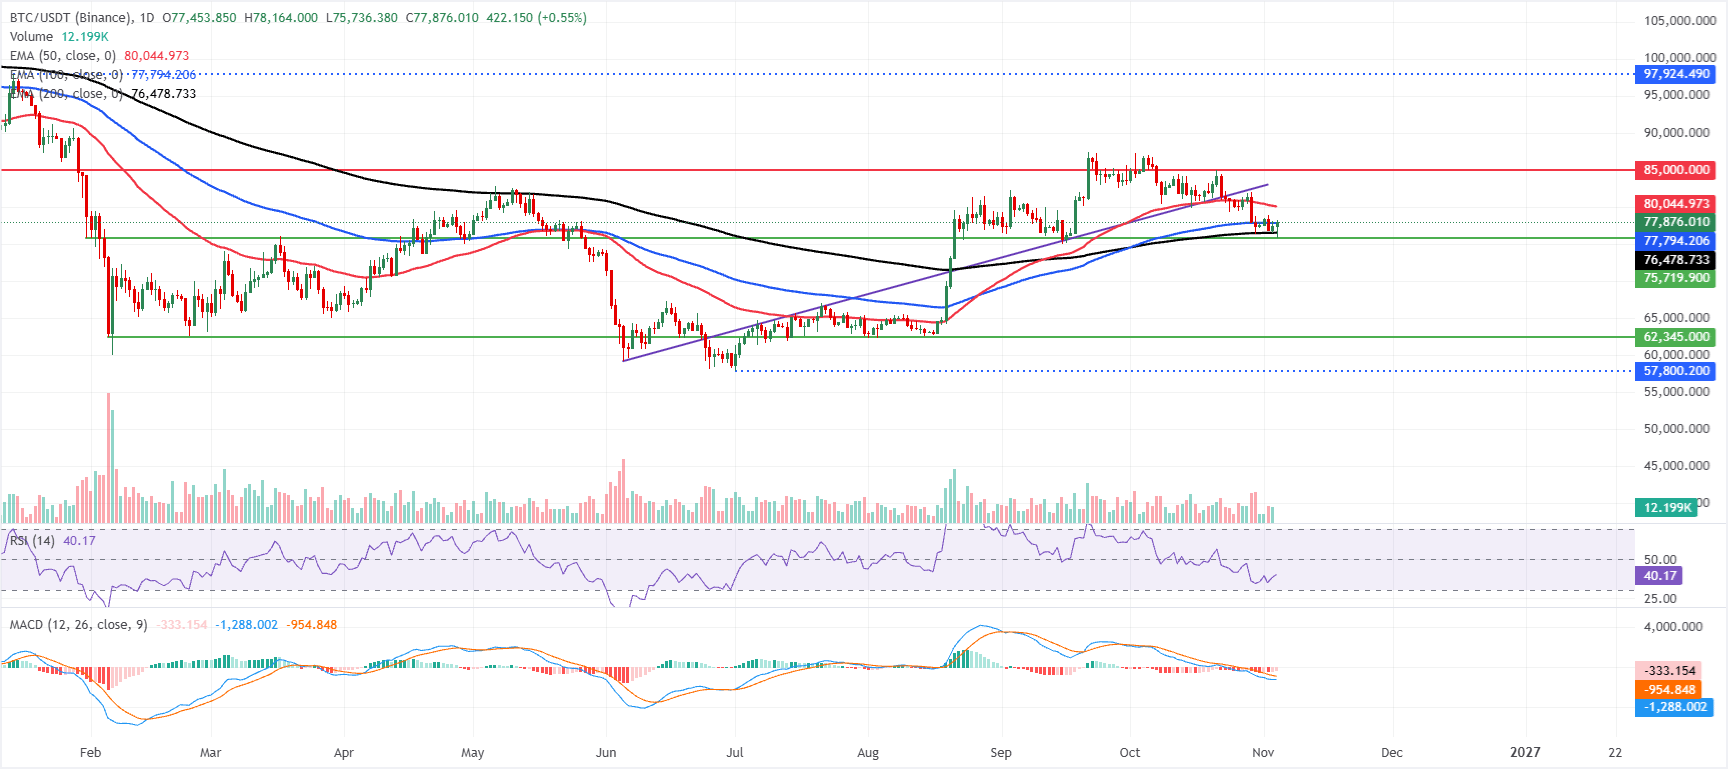
Bitcoin price trades at $77,876 at the time of writing on Wednesday, consolidating between the 100-day EMA and 200-day EMA. Meanwhile, BTC is still capped by the 50-day EMA at $80,044, which limits the topside and hints at a consolidative bias.
The Relative Strength Index (RSI) near 40 suggests subdued bullish momentum on the daily chart. At the same time, the Moving Average Convergence Divergence (MACD) histogram remains negative, indicating a weak profile that reinforces the idea of a range-bound market under nearby resistance.
On the topside, a successful daily close above the 100-day EMA at $77,794 supports a mild bullish outlook. The next target is the 50-day EMA at $80,044, followed by the horizontal barrier at $85,000, where previous supply is likely to re-emerge if price extends higher.
On the downside, a failure to close above the 100-day EMA could extend the correction to the initial support at the 200-day EMA near $76,479. A daily close below this level would weaken BTC structure and open the door to a broader corrective phase.
(The technical analysis of this story was written with the help of an AI tool. Know more.)
Bitcoin, altcoins, stablecoins FAQs
Bitcoin is the largest cryptocurrency by market capitalization, a virtual currency designed to serve as money. This form of payment cannot be controlled by any one person, group, or entity, which eliminates the need for third-party participation during financial transactions.
Altcoins are any cryptocurrency apart from Bitcoin, but some also regard Ethereum as a non-altcoin because it is from these two cryptocurrencies that forking happens. If this is true, then Litecoin is the first altcoin, forked from the Bitcoin protocol and, therefore, an “improved” version of it.
Stablecoins are cryptocurrencies designed to have a stable price, with their value backed by a reserve of the asset it represents. To achieve this, the value of any one stablecoin is pegged to a commodity or financial instrument, such as the US Dollar (USD), with its supply regulated by an algorithm or demand. The main goal of stablecoins is to provide an on/off-ramp for investors willing to trade and invest in cryptocurrencies. Stablecoins also allow investors to store value since cryptocurrencies, in general, are subject to volatility.
Bitcoin dominance is the ratio of Bitcoin's market capitalization to the total market capitalization of all cryptocurrencies combined. It provides a clear picture of Bitcoin’s interest among investors. A high BTC dominance typically happens before and during a bull run, in which investors resort to investing in relatively stable and high market capitalization cryptocurrency like Bitcoin. A drop in BTC dominance usually means that investors are moving their capital and/or profits to altcoins in a quest for higher returns, which usually triggers an explosion of altcoin rallies.
推薦文章


