


WTI Price Forecast: Clinging to a key support at the 200-day SMA near $86.00
- WTI Oil prices hold just above $86 after falling nearly 15% so far this week.
- Trump's defeat in the midterm elections has boosted hopes of a quick end to Iran's war.
- The technical picture shows price action clinging to support at the key 200-day SMA.
Oil prices are showing their sharpest weekly decline in months, as the landslide Democratic victory in the US midterm elections has boosted hopes of an end to the war against Iran. The US benchmark West Texas Intermediate (WTI) barrel has dropped 14.25% so far this week, trading at $87.50 at the time of writing after testing support at the 200-day Simple Moving Average (SMA) near $86.00.
Crude prices plummeted on Wednesday as the resounding defeat of US President Donald Trump in the midterm elections confirmed the disapproval of the Republicans’ policies, mainly the war in Iran and the consequences of the energy shock stemming from it.
Trump said on Wednesday that he does not regret the intervention in Iran, but he also affirmed that the US has no immediate plans to resume the hostilities in an interview with the Financial Times. Also on Wednesday, Vice President JD Vance pointed out to Iran's war as the main reason for the election results, which has boosted hopes that the government will look for a quick exit from the conflict
Meanwhile, Iran's Islamic Republican Guard Corps (IRGC) said on Thursday that two Oil tankers caught fire after attempting to cross the Strairtt of Hormuz through what they called "an unauthorised route". This is keeping Crude prices from falling further amid ongoing concerns about supply disruptions.
Technical Analysis: WTI is testing key support around $86.00
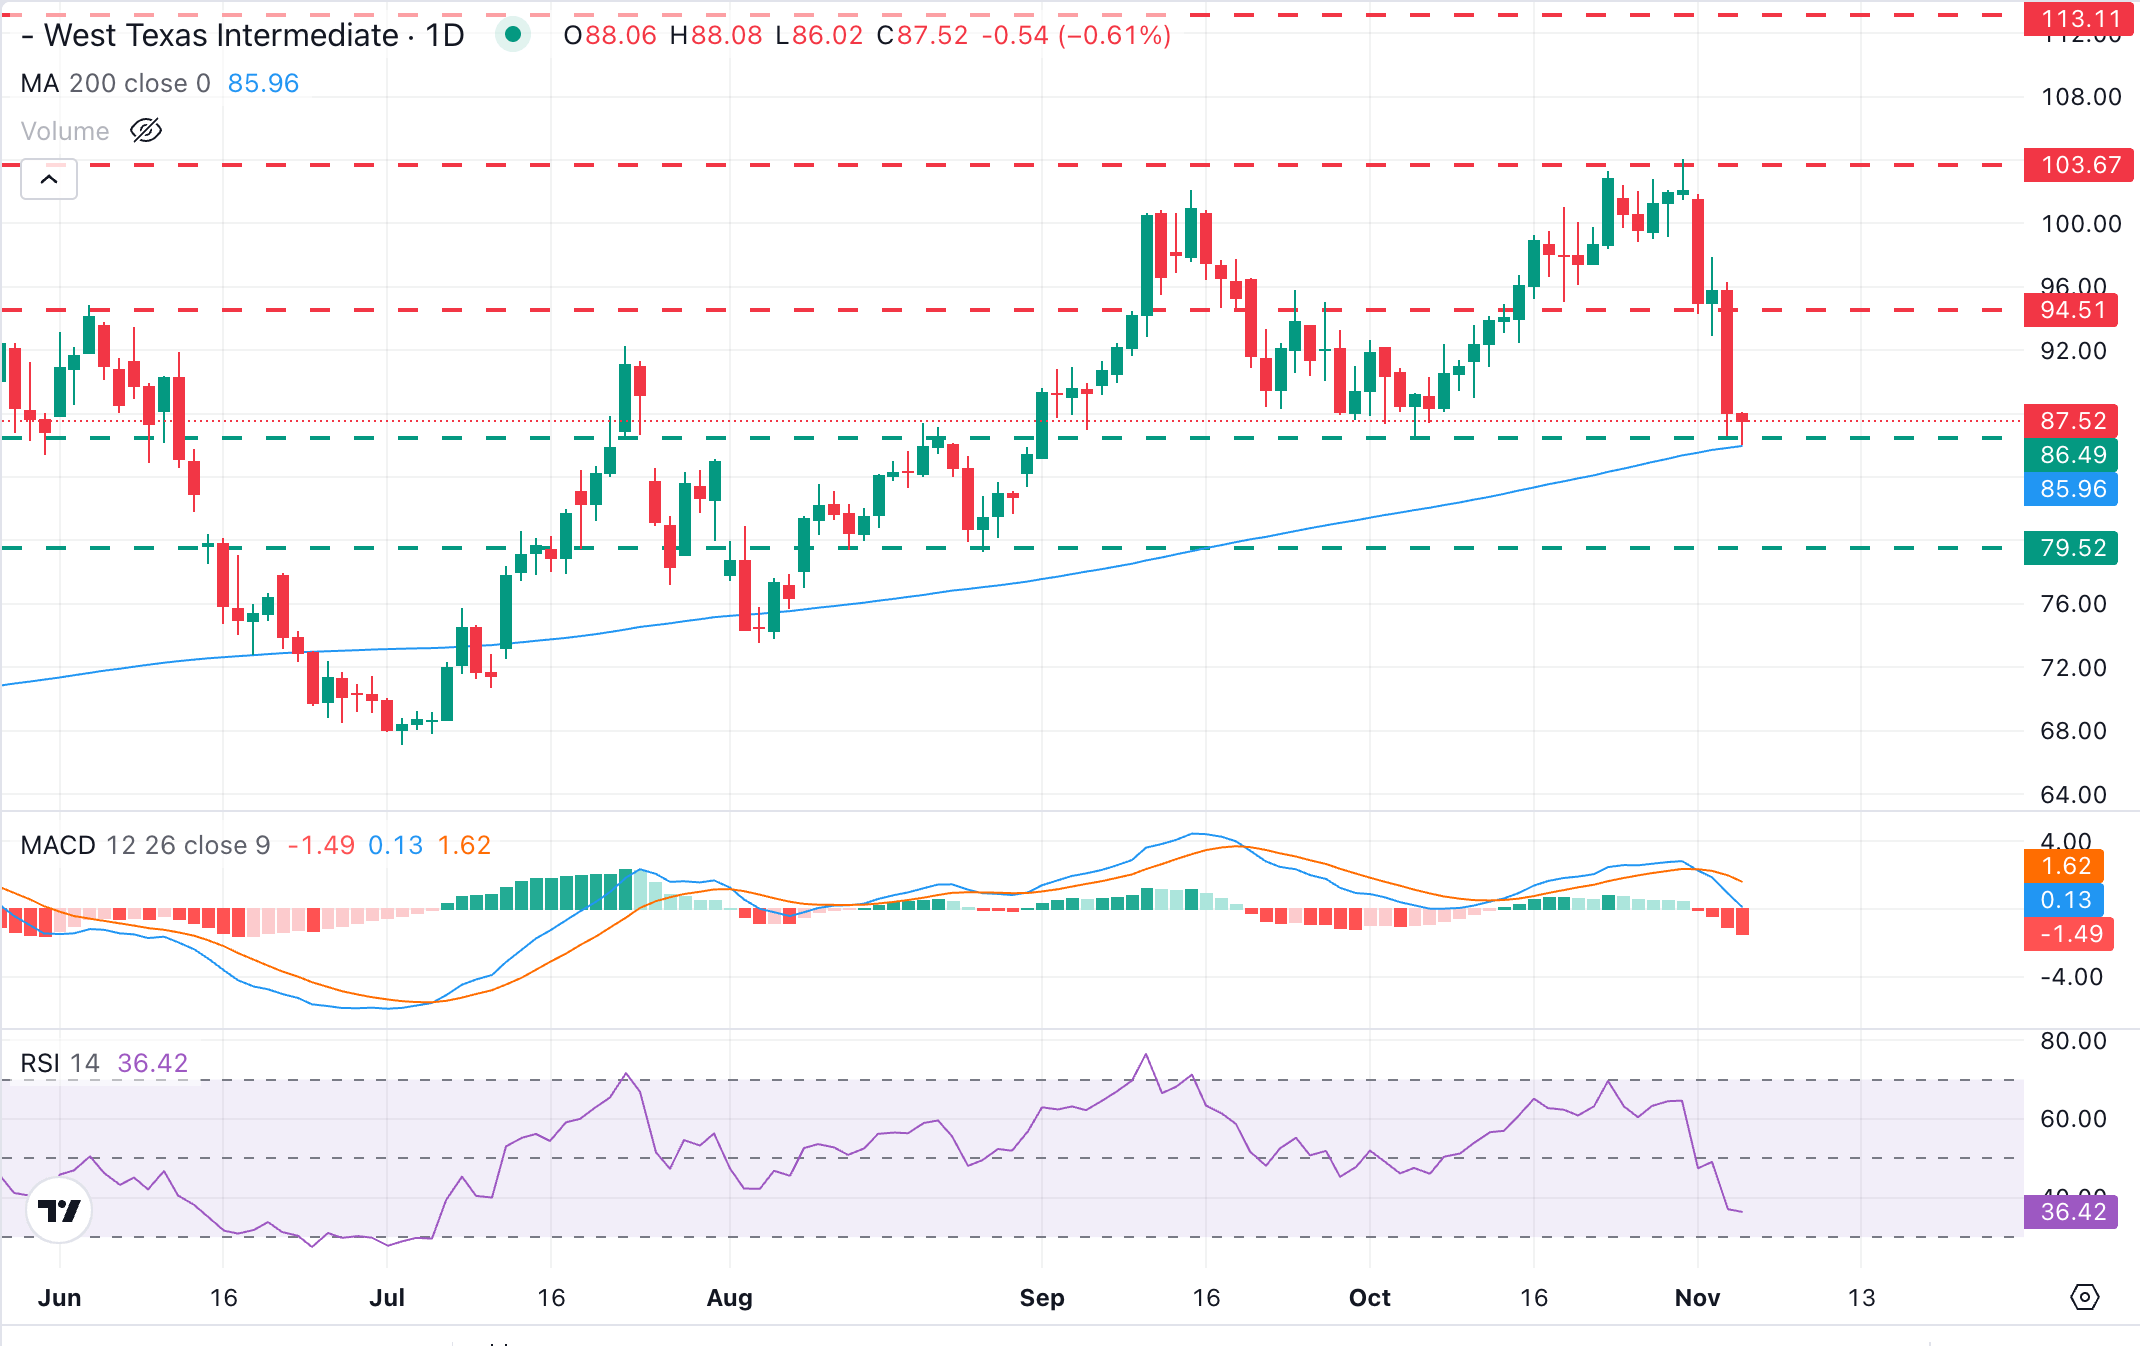
WTI US Oil trades at $87.52, holding marginally above the 200-day simple moving average (SMA) with momentum deteriorating sharply. The Relative Strength Index (RSI) in the daily chart has slid to 36.5, and the Moving Average Convergence Divergence (MACD) line has crossed below the Signal line, with the histogram turning more negative, which highlights that the recent pullback is gaining traction despite the still-positive broader trend backdrop.
A confirmation below the mentioned $86.00 area will be seen as a signal of a trend shift, and increase pressure towards the late August lows near $79.30 and the August 3 low near $73.50. On the topside, first resistance emerges at the previous support area around $94.50 (November 2 low), ahead of last week's highs above $103.67.
(The technical analysis of this story was written with the help of an AI tool. Know more.)
WTI Oil FAQs
WTI Oil is a type of Crude Oil sold on international markets. The WTI stands for West Texas Intermediate, one of three major types including Brent and Dubai Crude. WTI is also referred to as “light” and “sweet” because of its relatively low gravity and sulfur content respectively. It is considered a high quality Oil that is easily refined. It is sourced in the United States and distributed via the Cushing hub, which is considered “The Pipeline Crossroads of the World”. It is a benchmark for the Oil market and WTI price is frequently quoted in the media.
Like all assets, supply and demand are the key drivers of WTI Oil price. As such, global growth can be a driver of increased demand and vice versa for weak global growth. Political instability, wars, and sanctions can disrupt supply and impact prices. The decisions of OPEC, a group of major Oil-producing countries, is another key driver of price. The value of the US Dollar influences the price of WTI Crude Oil, since Oil is predominantly traded in US Dollars, thus a weaker US Dollar can make Oil more affordable and vice versa.
The weekly Oil inventory reports published by the American Petroleum Institute (API) and the Energy Information Agency (EIA) impact the price of WTI Oil. Changes in inventories reflect fluctuating supply and demand. If the data shows a drop in inventories it can indicate increased demand, pushing up Oil price. Higher inventories can reflect increased supply, pushing down prices. API’s report is published every Tuesday and EIA’s the day after. Their results are usually similar, falling within 1% of each other 75% of the time. The EIA data is considered more reliable, since it is a government agency.
OPEC (Organization of the Petroleum Exporting Countries) is a group of 12 Oil-producing nations who collectively decide production quotas for member countries at twice-yearly meetings. Their decisions often impact WTI Oil prices. When OPEC decides to lower quotas, it can tighten supply, pushing up Oil prices. When OPEC increases production, it has the opposite effect. OPEC+ refers to an expanded group that includes ten extra non-OPEC members, the most notable of which is Russia.
推薦文章


