Litecoin Price Forecast: LTC fee collection hits 7-month high as bullish momentum builds 

แหล่งที่มา Fxstreet
  • Litecoin price consolidates within a falling wedge pattern, with a breakout likely to trigger a rally.
  • On-chain and derivatives data paint a bullish outlook as a spike in fee collection and bullish bets reach the highest monthly level.
  • The technical outlook signals fading bearish momentum, reinforcing the case for an upcoming upside move.

Litecoin (LTC) price trades within a falling wedge pattern around $112.5 at the time of writing on Thursday, with a breakout likely to trigger a rally ahead. On-chain activity and derivatives data support a bullish outlook as LTC’s fee collection hits a seven-month high and bullish bets reach their highest monthly level. The technical momentum suggests that bulls may soon regain control, opening the door for a potential rally.

Litecoin’s growing interest among traders

According to Artemis Terminal data, Litecoin fee collection has spiked from $1,000 on Saturday to $2,100 on Monday, the highest level since January 26, indicating a growing interest among traders and liquidity in the LTC chain.
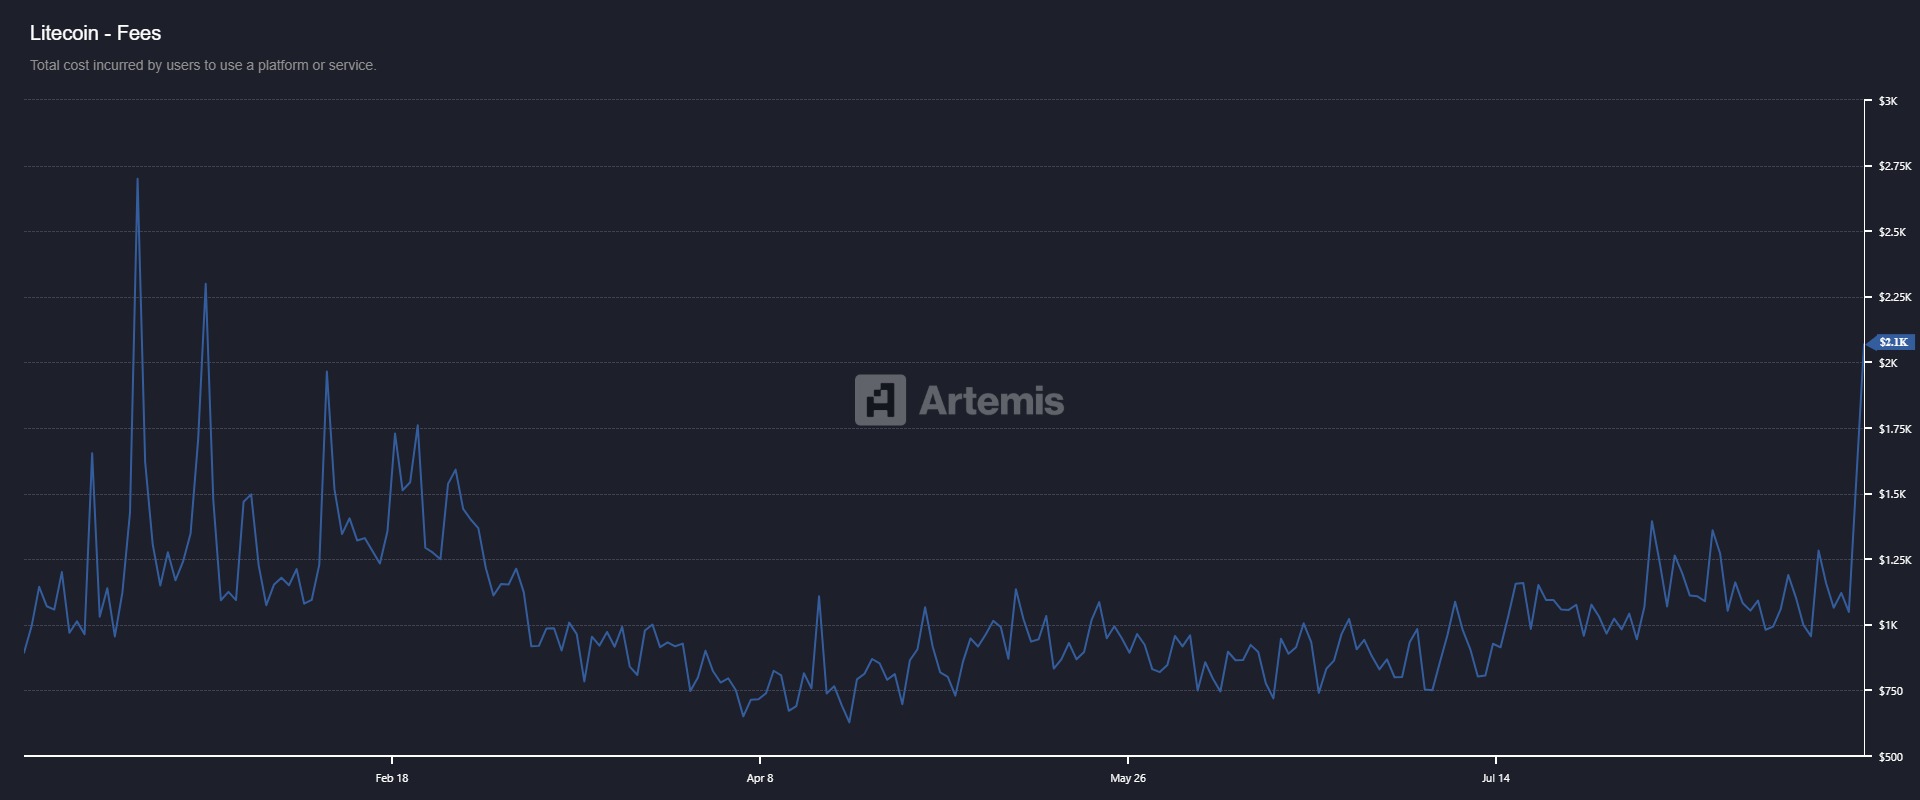
Litecoin fees chart. Source: Artemis

Litecoin fees chart. Source: Artemis

Coinglass’s long-to-short ratio of LTC further supports the bullish outlook. The ratio currently stands at 1.11, the highest level over a month, indicating traders are betting on the asset price to rally.

Litecoin long-to-short chart. Source: Coinglass

Apart from these, LTC hash rate has tripled in just over 18 months, signaling stronger network security and growing miner confidence in the ecosystem.
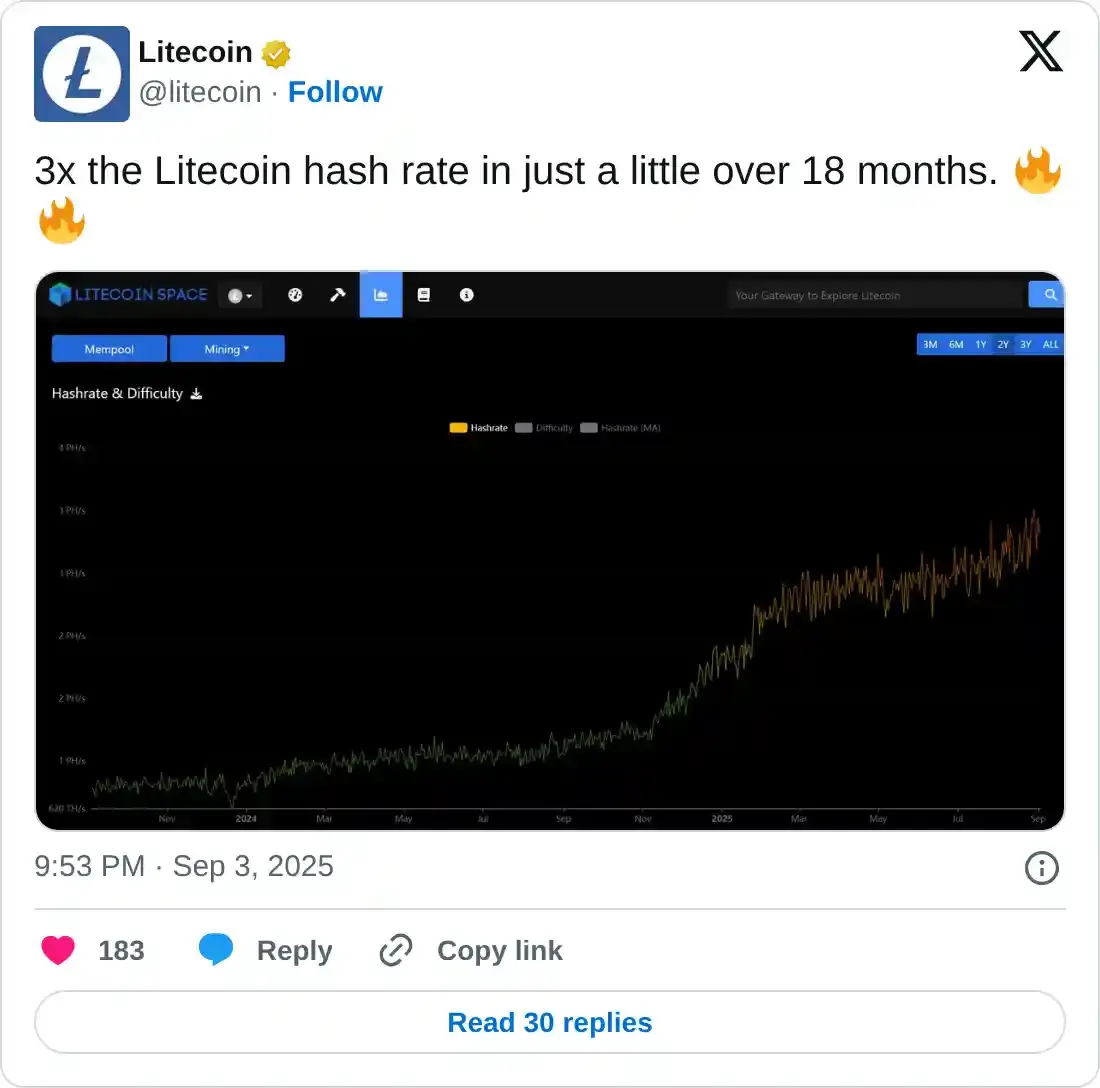
https://twitter.com/litecoin/status/1963359805973958696

Litecoin Price Forecast: LTC could rally if it breaks above the falling wedge pattern

Litecoin price trades within the falling wedge pattern (drawn by connecting multiple highs and lows with two trendlines since early August). A breakout of this pattern generally favors the bulls. LTC price found support around its 100-day EMA at $106.13 on Monday and recovered 4% in the next two days. At the time of writing on Thursday, it trades around $112.54.

If LTC breaks above the upper boundary of the wedge pattern, it could extend the rally toward its August 14 high of $134.29.

The Relative Strength Index (RSI) on the daily chart reads 48, nearing its neutral level of 50, indicating a fading of bearish momentum. The Moving Average Convergence Divergence (MACD) lines are also nearing each other with decreasing red histogram bars, suggesting a bullish crossover could happen in the coming sessions.
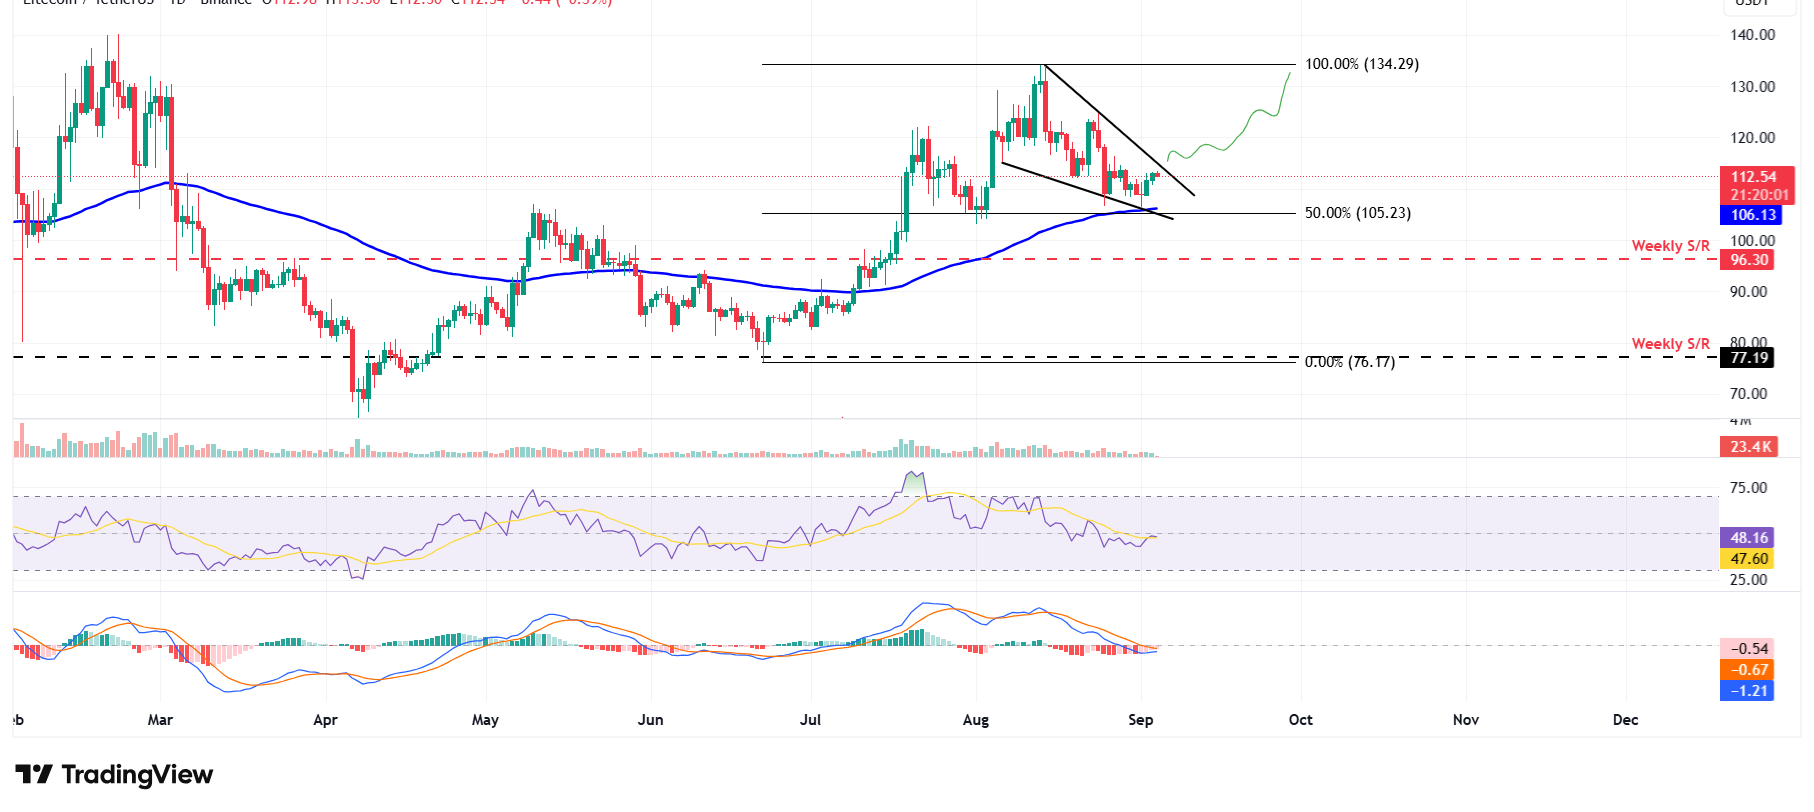
LTC/USDT daily chart 

LTC/USDT daily chart 

However, if LTC faces a correction, it could extend the decline to find support around its 100-day EMA at $106.13.

ข้อจำกัดความรับผิดชอบ: เพื่อการอ้างอิงเท่านั้น ผลการดำเนินงานในอดีตไม่ได้บ่งบอกถึงผลลัพธ์ในอนาคต
placeholder
คว้าโอกาสในการกู้คืนชิป: หุ้น Semiconductor 10 ตัวที่น่าลงทุนในปี 2566หากปี 2564 เป็นปีเก็บเกี่ยวของนักลงทุน semiconductor หลังจากประสบปัญหาผลประกอบการตกต่ำในปี 2565 ที่ผ่านมานี้ นักลงทุนจะลงทุนในหุ้นเซมิคอนดักเตอร์ในปี 2566 อย่างไร บทความนี้มีคำตอบ หุ้นเซมิคอนดักเตอร์ 10 ตัวที่ควรค่าแก่การลงทุน
ผู้เขียน  Mitrade
วันที่ 13 มิ.ย. 2023
หากปี 2564 เป็นปีเก็บเกี่ยวของนักลงทุน semiconductor หลังจากประสบปัญหาผลประกอบการตกต่ำในปี 2565 ที่ผ่านมานี้ นักลงทุนจะลงทุนในหุ้นเซมิคอนดักเตอร์ในปี 2566 อย่างไร บทความนี้มีคำตอบ หุ้นเซมิคอนดักเตอร์ 10 ตัวที่ควรค่าแก่การลงทุน
placeholder
Top 3 Price Prediction Bitcoin, Ethereum, Ripple: BTC, ETH and XRP show strength ahead of Trump’s inaugurationBitcoin’s (BTC) price continues to trade green, trading above $100,900 on Friday after rallying almost 7% so far this week.
ผู้เขียน  FXStreet
1 เดือน 17 วัน ศุกร์
Bitcoin’s (BTC) price continues to trade green, trading above $100,900 on Friday after rallying almost 7% so far this week.
placeholder
ทองคําทำสถิติสูงสุดใหม่ ขาขึ้นยังไม่พร้อมที่จะยอมแพ้แม้จะมีสภาวะซื้อมากเกินไปราคาทองคำแตะระดับสูงสุดเป็นประวัติการณ์ใหม่ที่ประมาณ $3,547 ในช่วงเซสชันเอเชียวันพุธ แม้ว่าจะมีปัญหาในการสร้างโมเมนตัมต่อไป เนื่องจากตลาดกระทิงดูเหมือนจะลังเลท่ามกลางสภาวะซื้อมากเกินไป
ผู้เขียน  FXStreet
เมื่อวาน 01: 47
ราคาทองคำแตะระดับสูงสุดเป็นประวัติการณ์ใหม่ที่ประมาณ $3,547 ในช่วงเซสชันเอเชียวันพุธ แม้ว่าจะมีปัญหาในการสร้างโมเมนตัมต่อไป เนื่องจากตลาดกระทิงดูเหมือนจะลังเลท่ามกลางสภาวะซื้อมากเกินไป
placeholder
GBP/JPY ยอมแพ้การปรับตัวขึ้นเล็กน้อยที่ 199.00; แนวโน้มขาลงยังคงได้รับการสนับสนุนท่ามกลาง JPY ที่อ่อนค่าคู่ GBPJPY ดึงดูดผู้ขายรายใหม่หลังจากการปรับตัวขึ้นในช่วงตลาดลงทุนเอเชียไปยังระดับที่สูงกว่า 199.00 และถอยกลับลงมาที่ช่วงล่างสุดของช่วงราคารายวันในชั่วโมงสุดท้าย
ผู้เขียน  FXStreet
เมื่อวาน 05: 56
คู่ GBPJPY ดึงดูดผู้ขายรายใหม่หลังจากการปรับตัวขึ้นในช่วงตลาดลงทุนเอเชียไปยังระดับที่สูงกว่า 199.00 และถอยกลับลงมาที่ช่วงล่างสุดของช่วงราคารายวันในชั่วโมงสุดท้าย
placeholder
การคาดการณ์ราคาเงิน: XAG/USD ลดลงจากจุดสูงสุดในรอบ 14 ปี; ไม่สามารถทำลายระดับ $41.00 ได้ราคาโลหะเงิน (XAG/USD) ปรับตัวลดลงเล็กน้อยจากบริเวณระดับ 41.00 ดอลลาร์ หรือระดับสูงสุดในรอบ 14 ปีที่แตะในช่วงเซสชั่นเอเชียเมื่อวันพุธที่ผ่านมา โลหะเงินซื้อขายอยู่ที่ประมาณ 40.70 ดอลลาร์ ลดลงเกือบ 0.50% ในวันนี้ แม้ว่าการปรับฐานที่มีนัยสำคัญดูเหมือนจะยังไม่เกิดขึ้น
ผู้เขียน  FXStreet
23 ชั่วโมงที่แล้ว
ราคาโลหะเงิน (XAG/USD) ปรับตัวลดลงเล็กน้อยจากบริเวณระดับ 41.00 ดอลลาร์ หรือระดับสูงสุดในรอบ 14 ปีที่แตะในช่วงเซสชั่นเอเชียเมื่อวันพุธที่ผ่านมา โลหะเงินซื้อขายอยู่ที่ประมาณ 40.70 ดอลลาร์ ลดลงเกือบ 0.50% ในวันนี้ แม้ว่าการปรับฐานที่มีนัยสำคัญดูเหมือนจะยังไม่เกิดขึ้น
ตราสารที่เกี่ยวข้อง
goTop
quote