
Pi Network Price Forecast: Large transactions suggest whale accumulation of over 2 million PI
- Pi Network edges lower, extending the previous week’s downfall below $0.50.
- Top whales bought over 2 million PI tokens, while CEXs' wallet balances grow.
- The technical outlook shows a bearish bias, suggesting a potential retest of $0.40 as bullish momentum fades.
Pi Network (PI) edges lower by nearly 1% and trades at $0.45 at press time on Tuesday as the available wallet balance of centralized exchanges (CEX) grows, suggesting increased supply pressure. However, the large transactions over the last 24 hours reveal two whale transactions acquiring over 2 million PI tokens. Still, the technical outlook suggests a bearish bias, indicating a potential retest of the $0.40 mark.
Whales are on a buying spree amid rising CEX levels
PiScan's data shows the CEXs’ wallet balances rising to 373.60 million PI tokens with a net inflow of 2.41 million PI tokens in the last 24 hours. The rising deposits on CEX suggest increased selling pressure from investors.
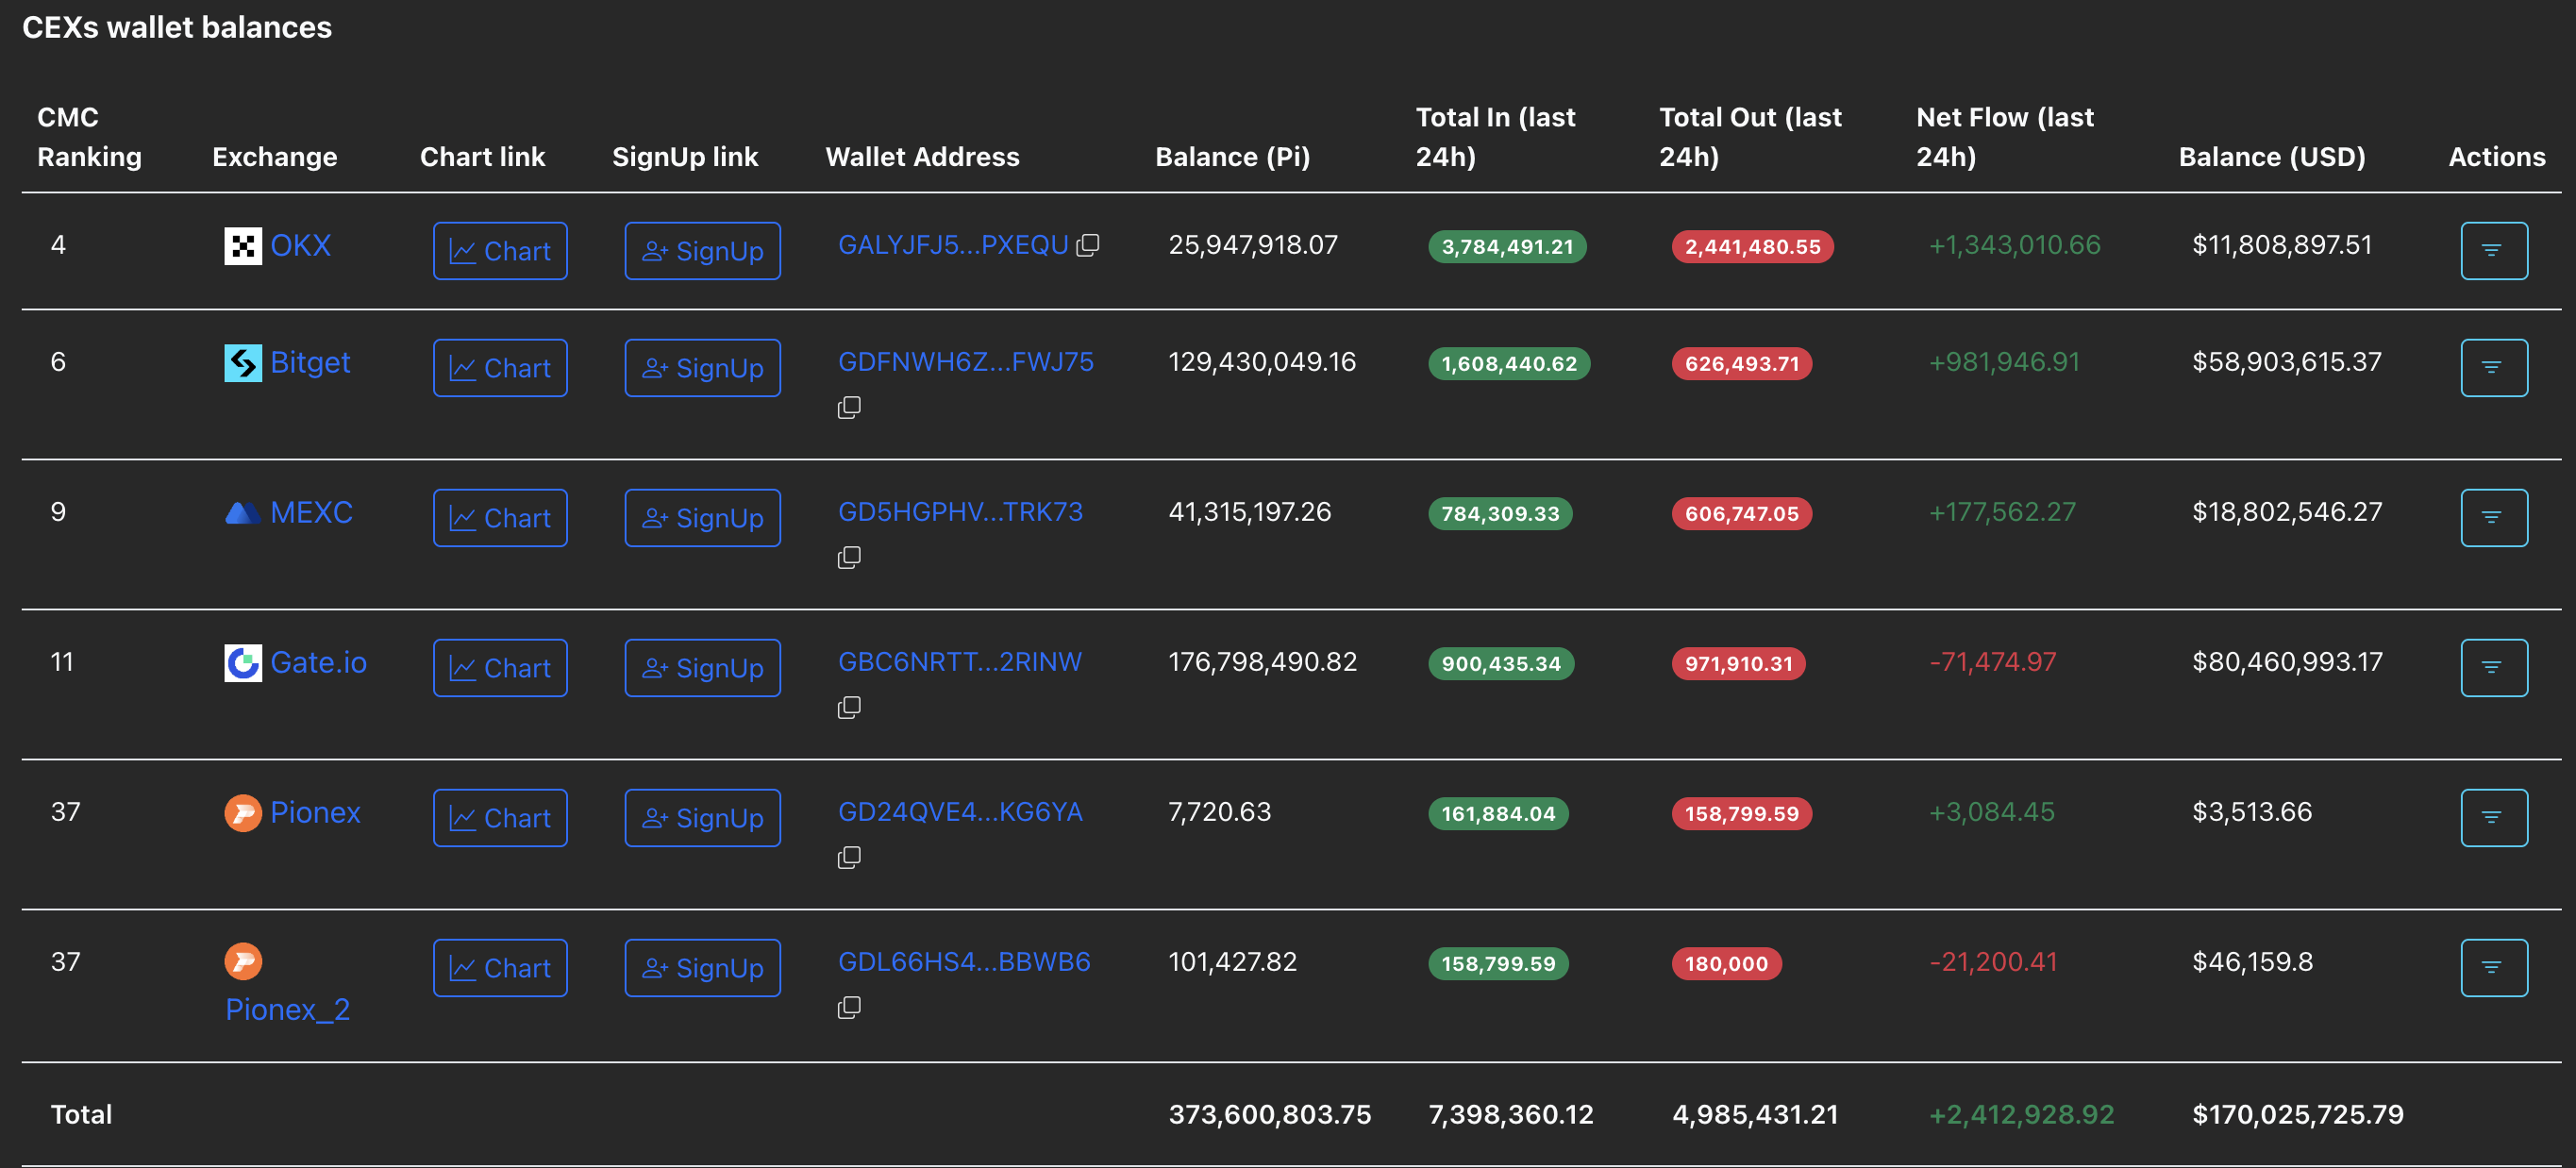
CEXs' wallet balances. Source: PiScan
Amid the rising supply pressure, the large transactions over the last 24 hours highlight two whale transactions withdrawing over 2 million PI tokens from the OKX exchange. The “GASWBD…J2AODM” withdrew 1.66 million PI tokens, while the “GBVD3M…4ZLRVM” acquired 400,000 PI tokens. It is worth noting that the whale "GASWBD…J2AODM" has acquired 7.92 million PI tokens in the last five days.
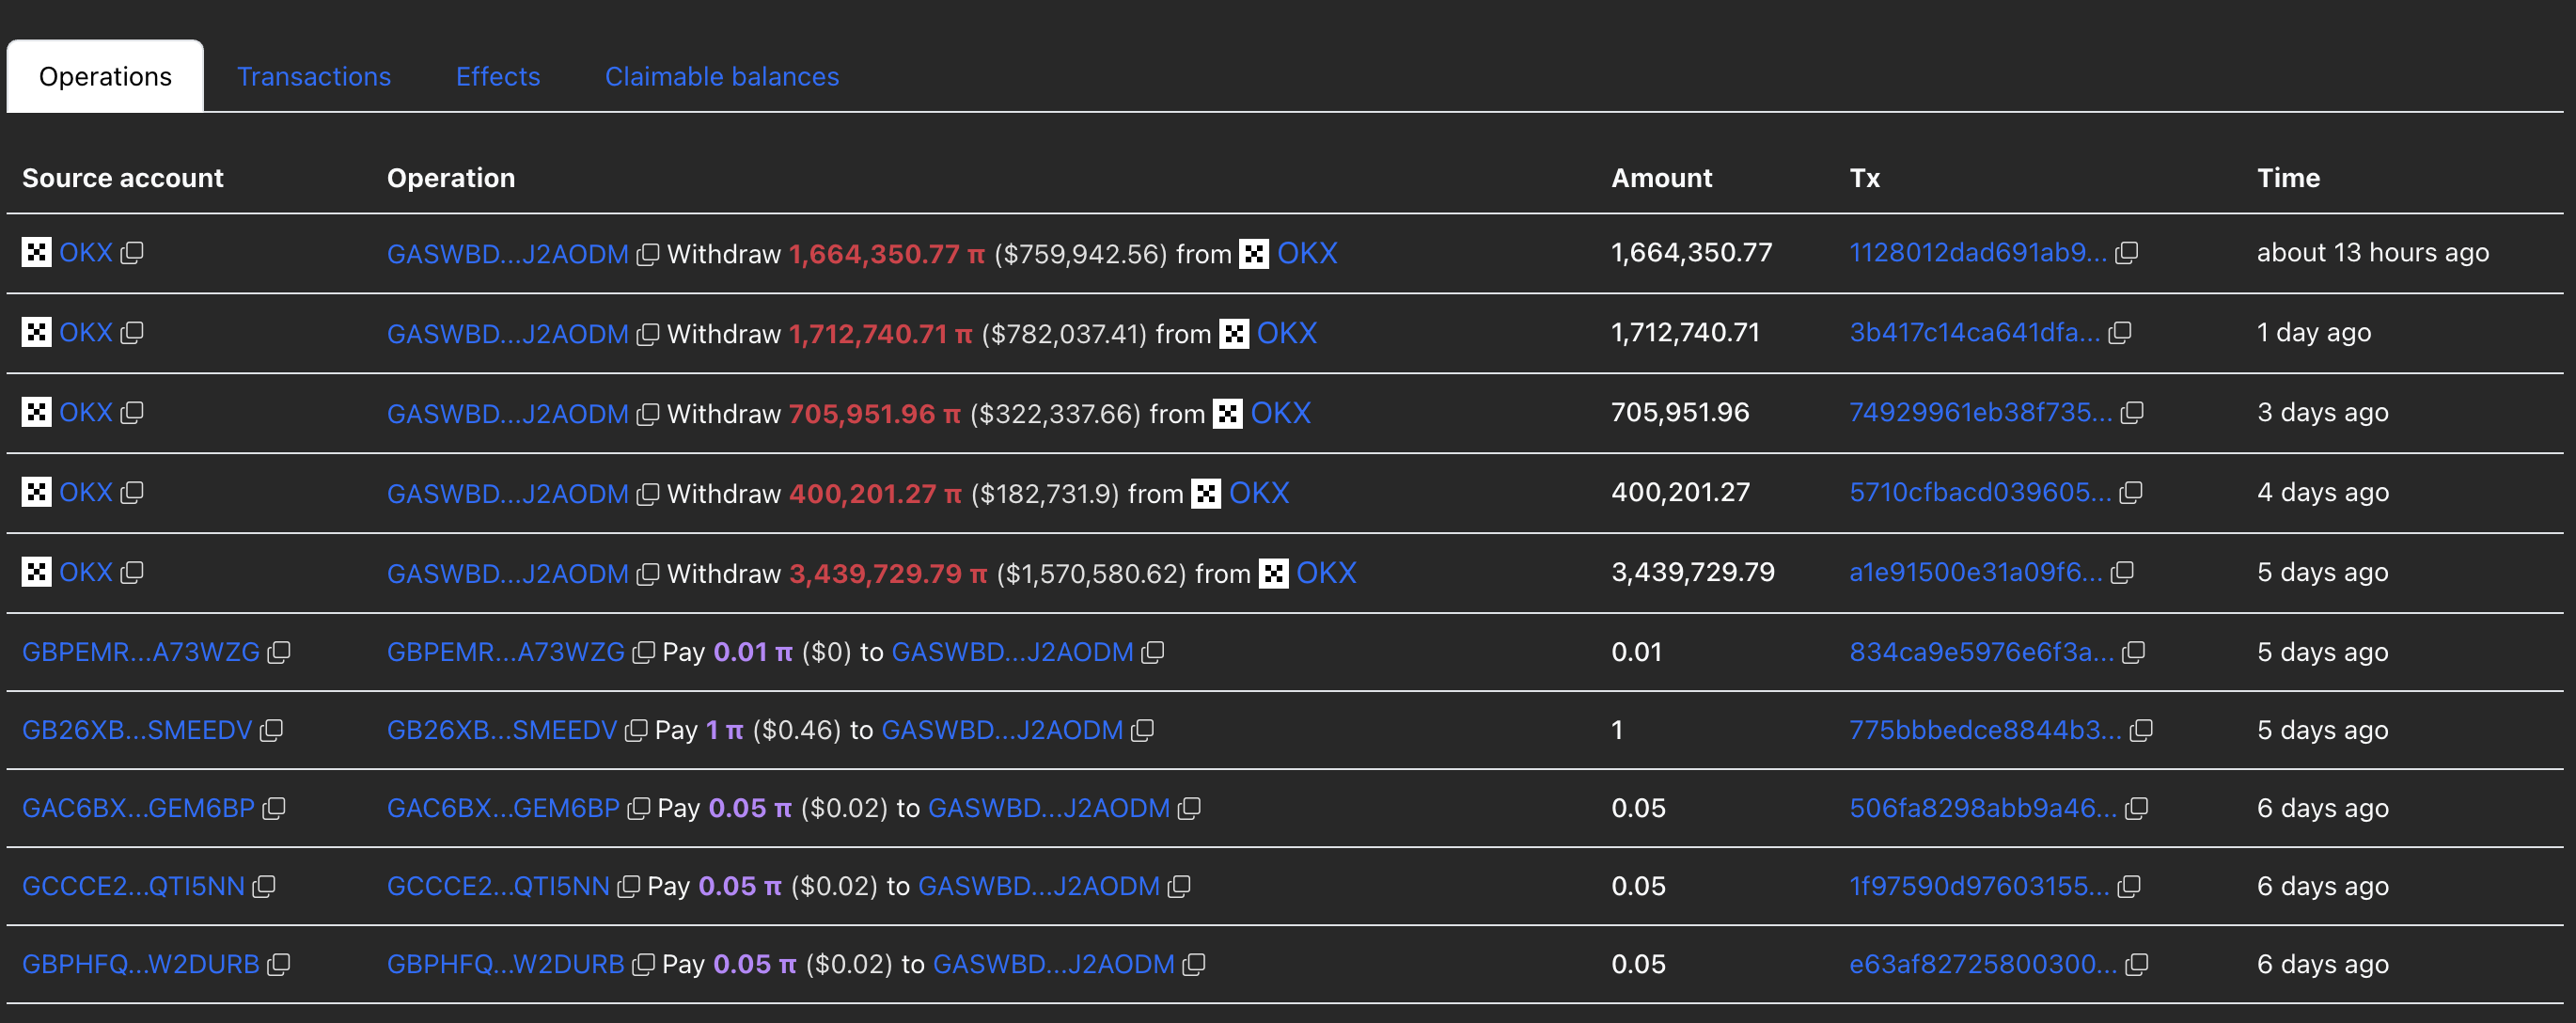
Pi whale's account overview. Source: PiScan
The whales’ purchases almost match the total supply inflow of all exchanges, suggesting heightened confidence.
Pi Network eyes $0.40 retest as bullish momentum fades
Pi Network ticks lower by nearly 1% at press time on Tuesday following Monday's decline. As PI extends the 12% drop from last week, the declining trend eyes the $0.40 round figure, last tested on June 13.
The technical indicators remain muted, with the Relative Strength Index (RSI) hovering around 33 on the daily chart, slightly above the oversold boundary. A dip below the oversold boundary at 30 would signal increased selling pressure.
The Moving Average Convergence/Divergence (MACD) indicator displays a declining trend in the MACD and signal lines in the negative territory. Still, a decrease in red histogram bars hints at a potential crossover, which sidelined investors could consider a buy signal.
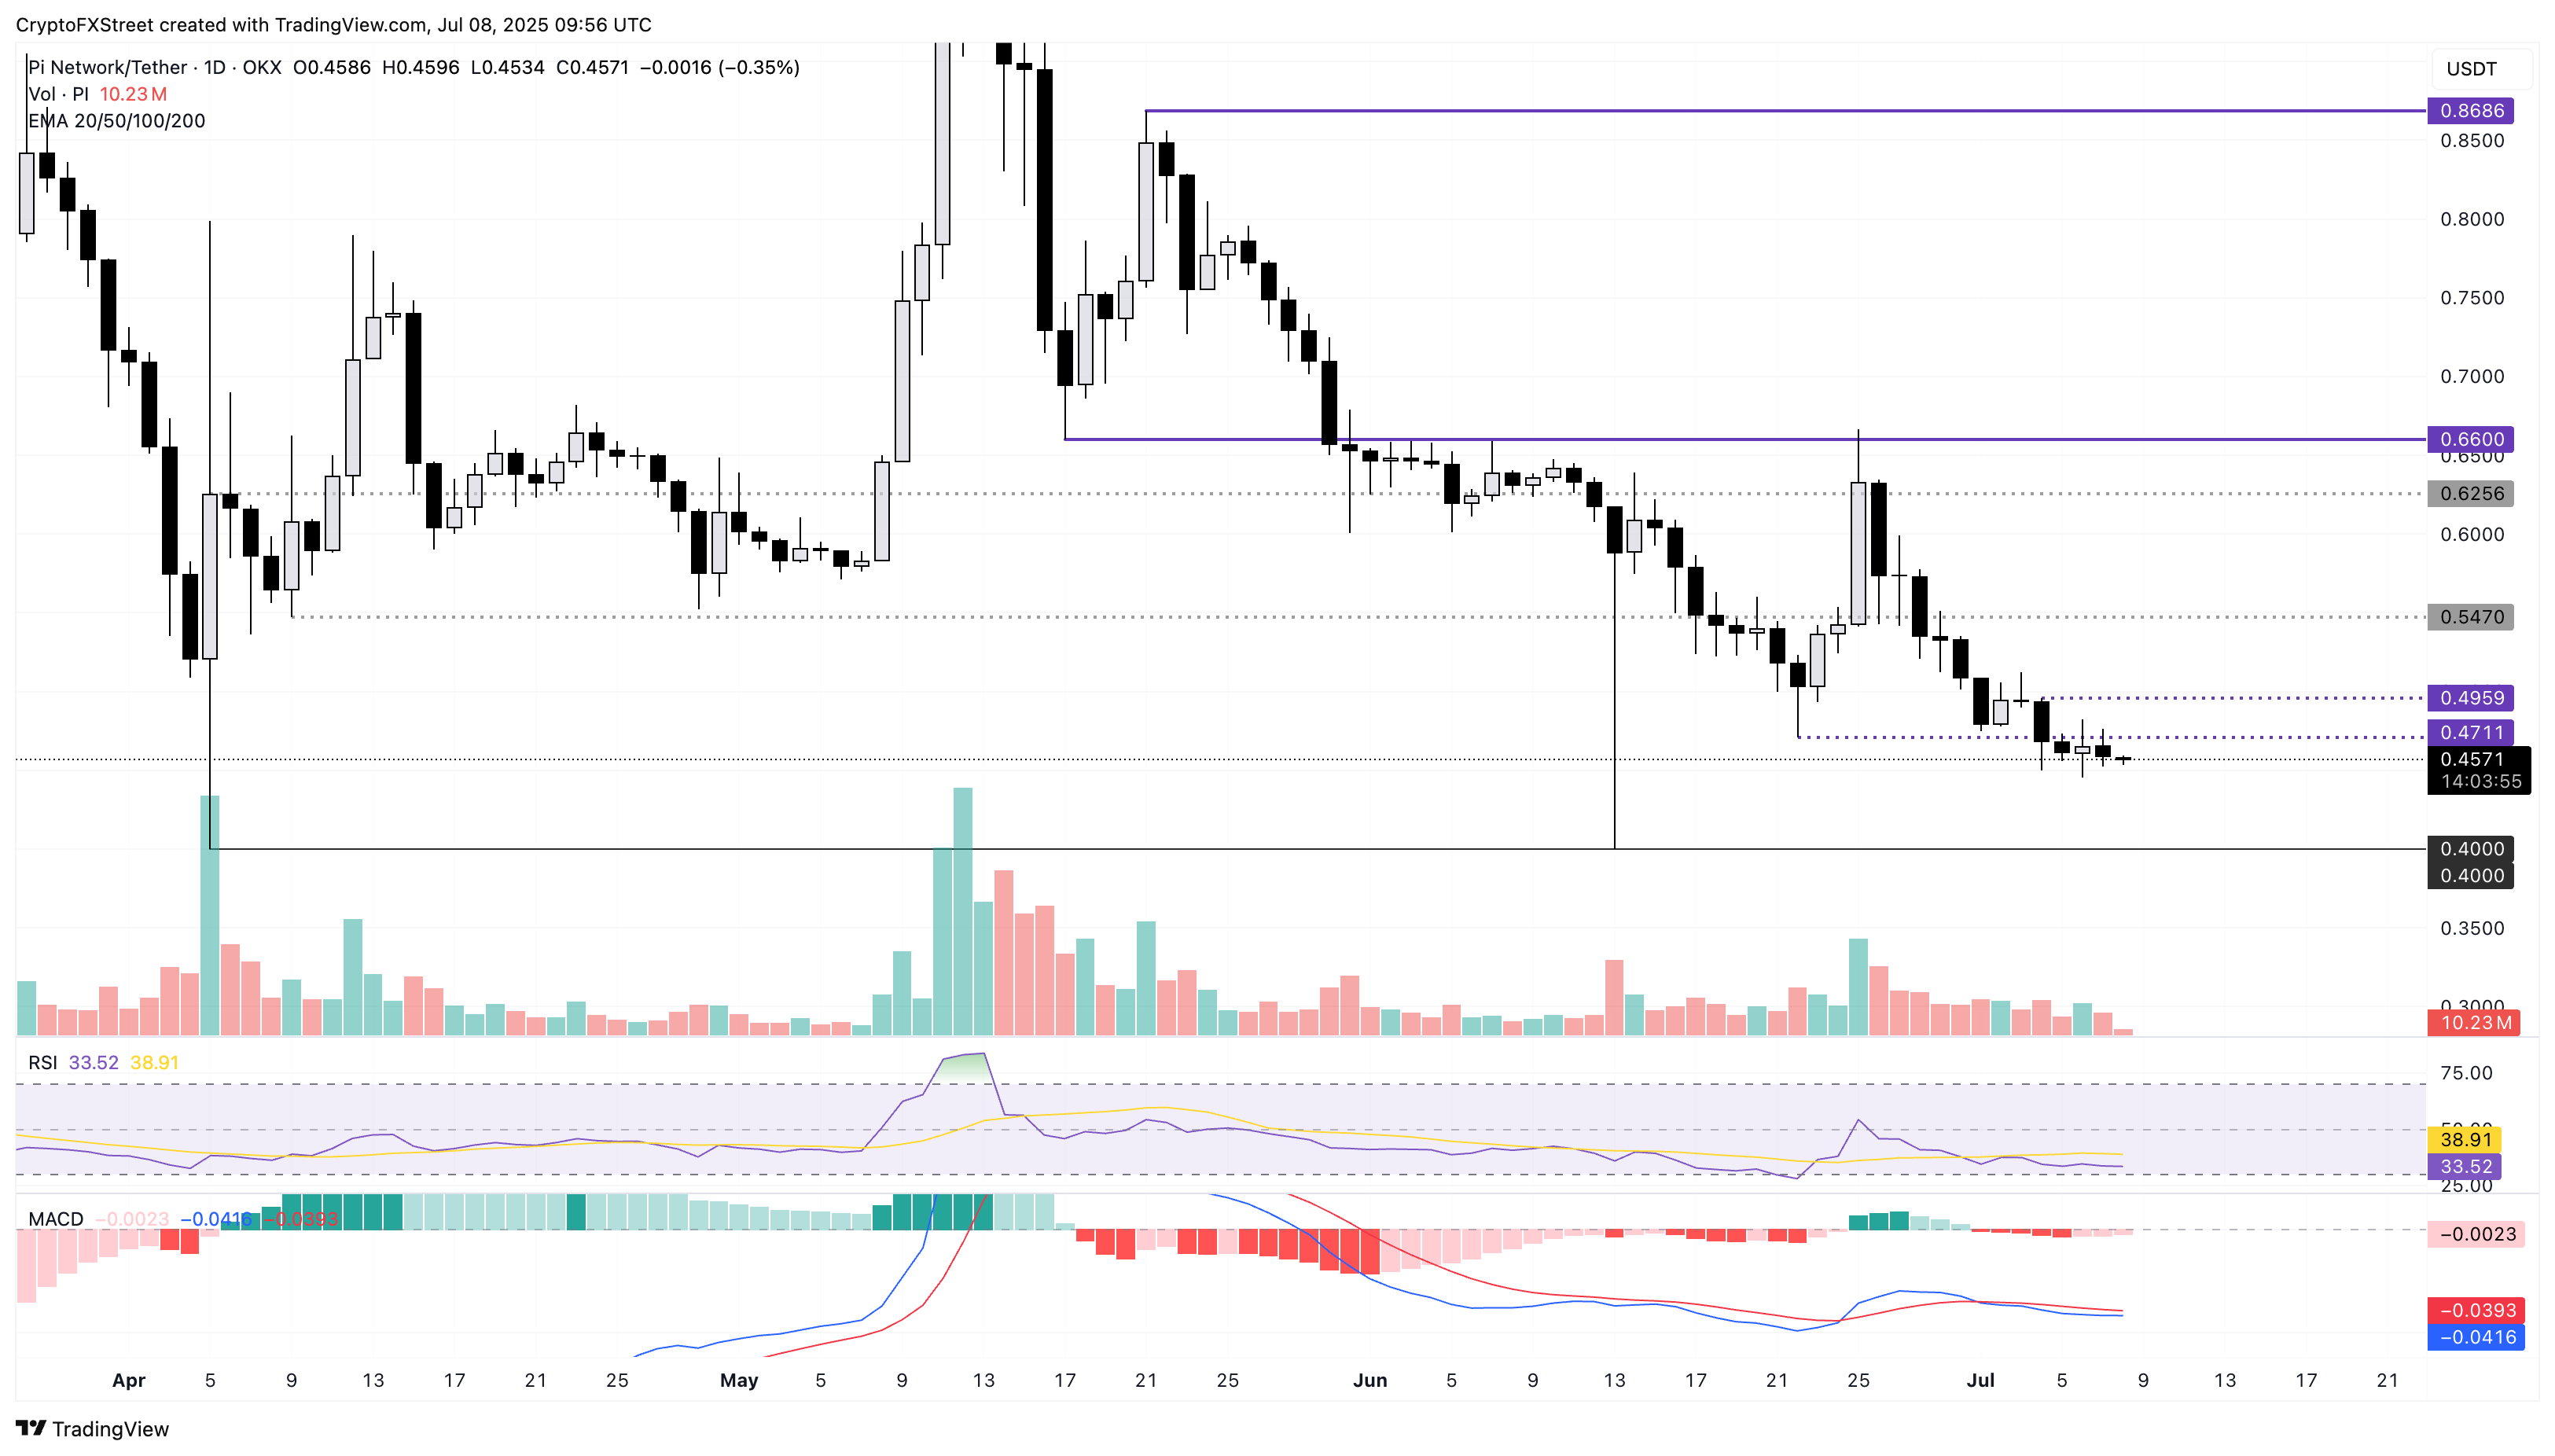
PI/USDT daily price chart.
However, to restart an uptrend, Pi Network must overcome Friday's bearish candle with a daily close above the $0.50 psychological mark. In such a scenario, the uptrend in PI could reach the $0.54 mark last tested on June 29.
Bitcoin, altcoins, stablecoins FAQs
Bitcoin is the largest cryptocurrency by market capitalization, a virtual currency designed to serve as money. This form of payment cannot be controlled by any one person, group, or entity, which eliminates the need for third-party participation during financial transactions.
Altcoins are any cryptocurrency apart from Bitcoin, but some also regard Ethereum as a non-altcoin because it is from these two cryptocurrencies that forking happens. If this is true, then Litecoin is the first altcoin, forked from the Bitcoin protocol and, therefore, an “improved” version of it.
Stablecoins are cryptocurrencies designed to have a stable price, with their value backed by a reserve of the asset it represents. To achieve this, the value of any one stablecoin is pegged to a commodity or financial instrument, such as the US Dollar (USD), with its supply regulated by an algorithm or demand. The main goal of stablecoins is to provide an on/off-ramp for investors willing to trade and invest in cryptocurrencies. Stablecoins also allow investors to store value since cryptocurrencies, in general, are subject to volatility.
Bitcoin dominance is the ratio of Bitcoin's market capitalization to the total market capitalization of all cryptocurrencies combined. It provides a clear picture of Bitcoin’s interest among investors. A high BTC dominance typically happens before and during a bull run, in which investors resort to investing in relatively stable and high market capitalization cryptocurrency like Bitcoin. A drop in BTC dominance usually means that investors are moving their capital and/or profits to altcoins in a quest for higher returns, which usually triggers an explosion of altcoin rallies.
บทความแนะนำ


