Fartcoin Price Forecast: Investors sell off as decline in social chatter risks further losses

แหล่งที่มา Fxstreet
  • Fartcoin extends the losses for the third consecutive day, putting pressure on a crucial support zone. 
  • Santiment’s data suggests a significant decline in social chatter on Fartcoin as hype around the meme coin wanes. 
  • The technical outlook suggests a potential drop to $0.71 if the long-standing support floor fractures. 

Fartcoin (FARTCOIN) loses steam, softening by 1% at press time on Thursday and hinting at its third consecutive daily red candle. Amid the gradual decline of social chatter around Fartcoin, the token risks a potential drop below a crucial support level.

Fartcoin's social chatter and optimism drop

Santiment’s social volume indicator indicates a low chatter period in Fartcoin. The indicator calculates the total number of social media messages that have the term Fartcoin. Investors may find the low-chatter period to be an entry opportunity before the next interest spike catalyzes a bullish phase.

Adding credence to low chatter, the social dominance of Fartcoin is down to 0.25% out of the combined social volume of the top 100 cryptocurrencies. Further up, the weighted sentiment around Fartcoin’s social activity stands at -0.275, pointing to a bearish bias. 
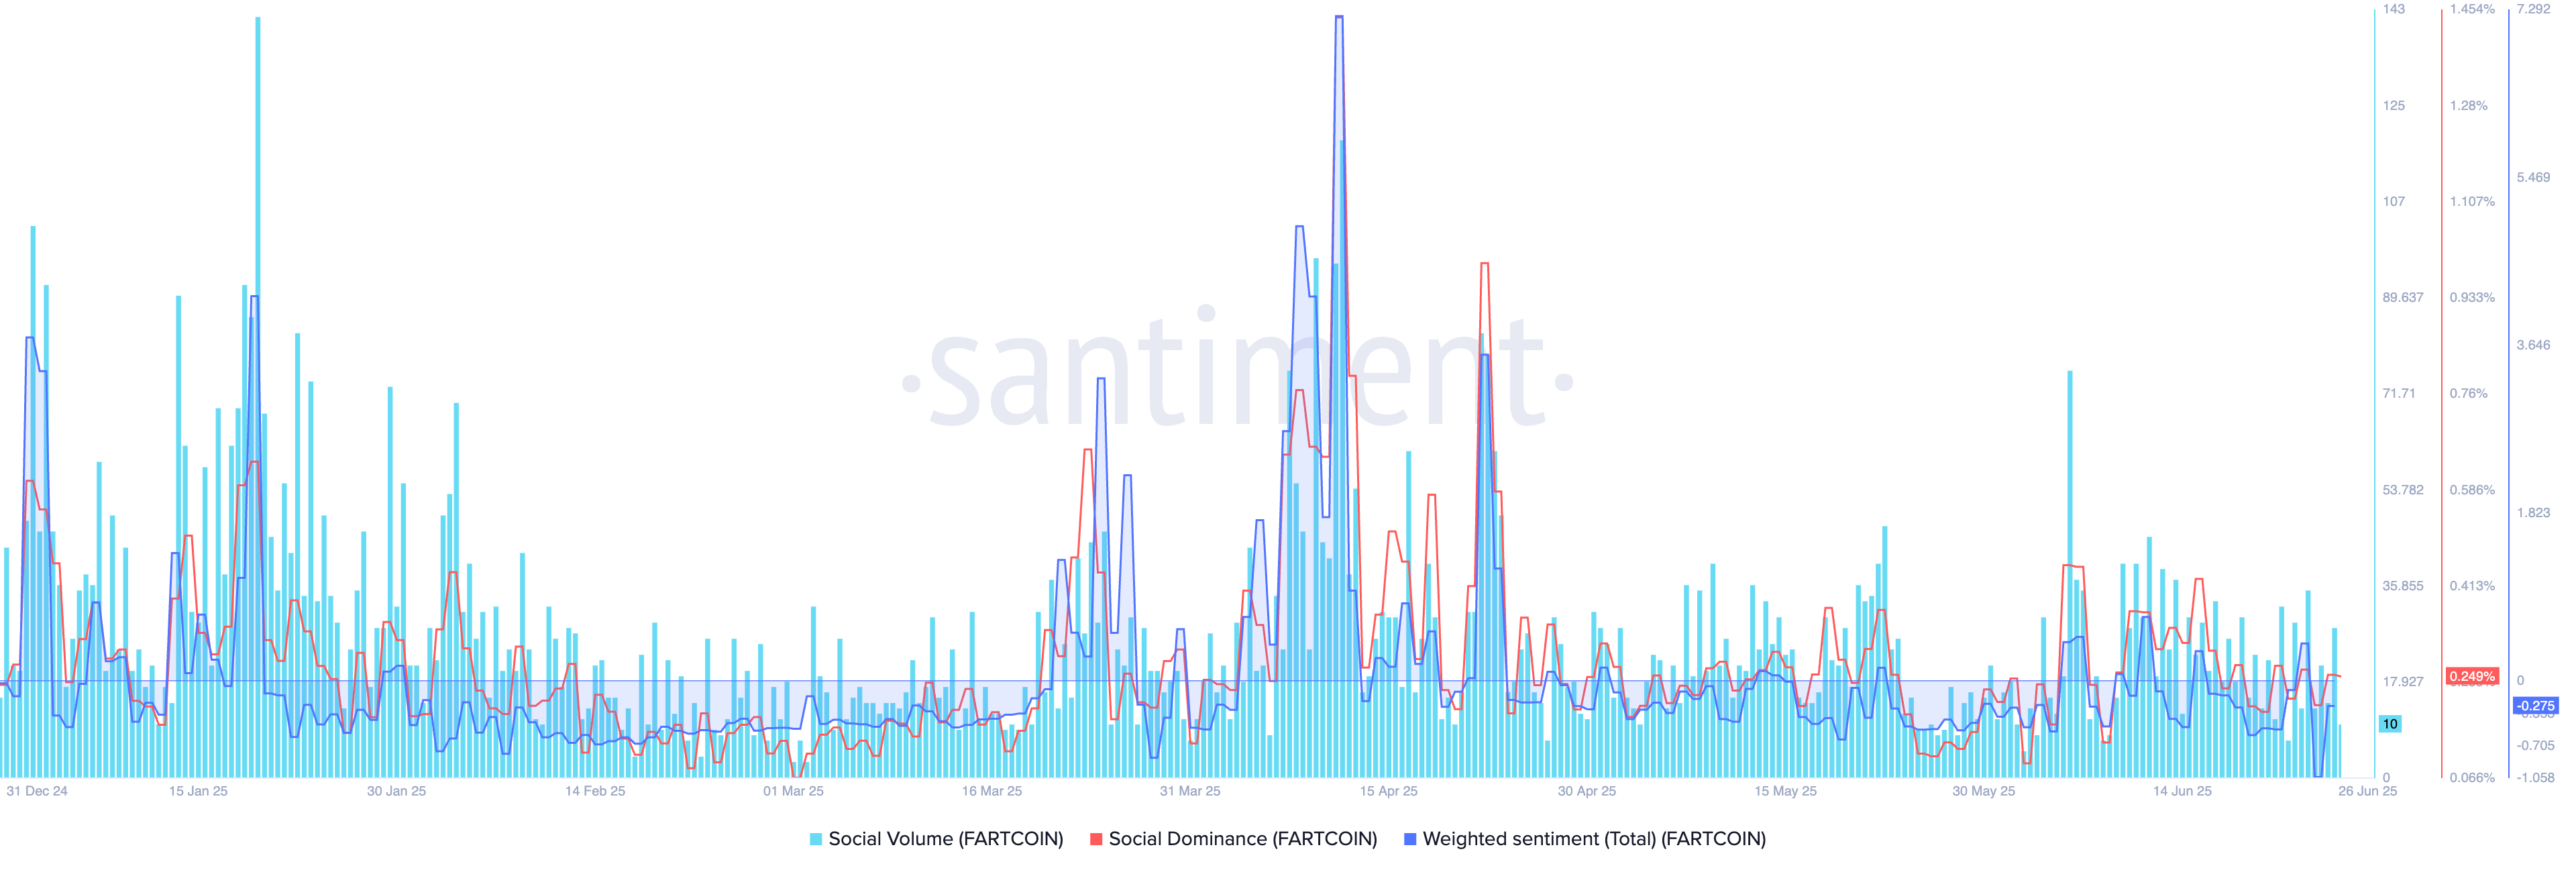
Fartcoin social data. Source: Santiment

CoinGlass’ data shows that derivatives traders are low on optimism, as Fartcoin Open Interest (OI) drops to $562 million at the time of writing, from a peak of $606 million on Wednesday. A slip in OI relates to outflowing capital from derivatives markets as new or additional purchases halt. 

Fartcoin Open Interest. Source: Coinglass

Fartcoin risks a support zone fallout

Fartcoin edges lower by 1% at the time of writing on Thursday as it breaks below the $1.00 psychological level. Inching closer to the $0.92 support zone, marked by a green band on the daily chart below, the meme coin gradually erases the 12% surge from Monday. 

A daily close below the $0.92 support floor, which has been in place since May 7, could extend the declining trend to $0.71, marked by the April 18 low. 

The Moving Average Convergence/Divergence (MACD) indicator maintains a declining trend with its signal line on the daily chart. However, the diminishing red histogram bars signal a potential trend reversal if the MACD line crosses above the signal line. Investors could consider this crossover as a buying opportunity. 

Still, the Relative Strength Index (RSI) reverses from the mid-line to 42, indicating another surge in selling pressure. 
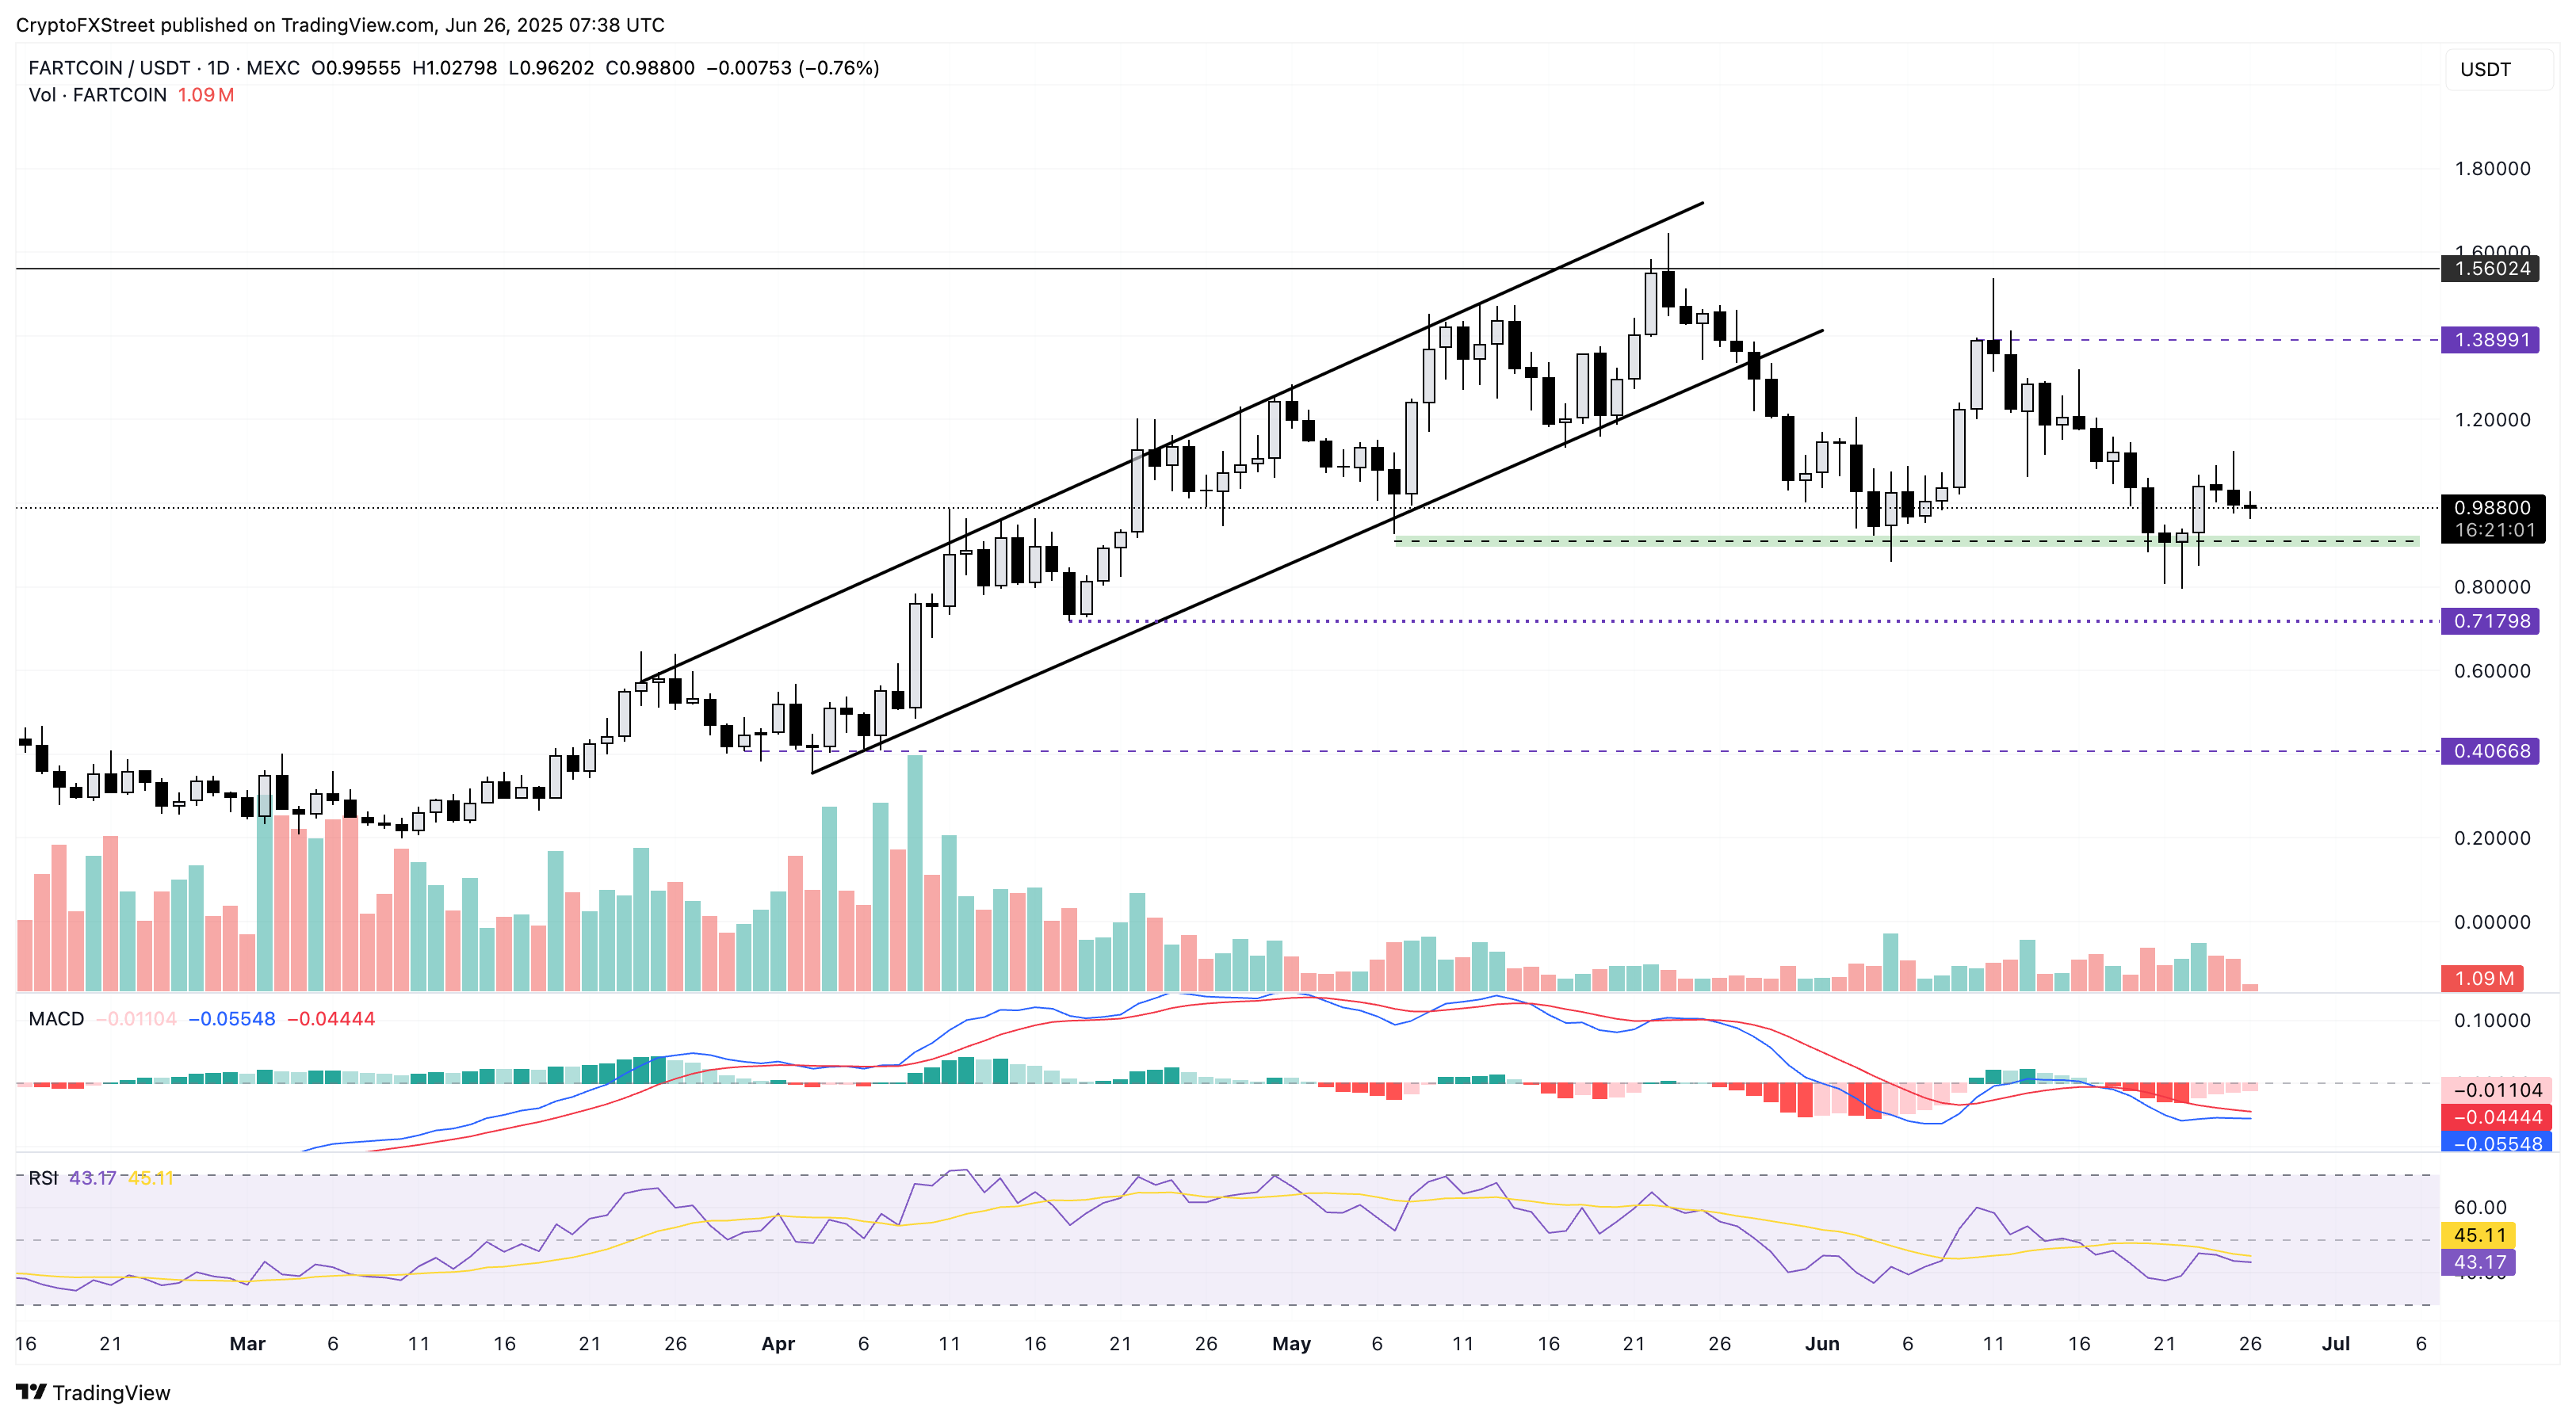
FARTCOIN/USDT daily price chart.

However, a potential bounce back in Fartcoin from the $0.92 support band could propel the meme coin towards $1.38, the highest close in June.

ข้อจำกัดความรับผิดชอบ: เพื่อการอ้างอิงเท่านั้น ผลการดำเนินงานในอดีตไม่ได้บ่งบอกถึงผลลัพธ์ในอนาคต
placeholder
Bitcoin เพิ่มขึ้นหลังจาก MicroStrategy ประกาศแผนการขายหุ้นเพิ่มในวันพฤหัสบดี Bitcoin เพิ่มขึ้นเนื่องจาก MicroStrategy ประกาศว่ามีแผนจะขายหุ้นเพิ่มเติมเพื่อรวบรวมกองทุนใหม่และใช้จ่ายกับสกุลเงินดิจิทัลมากขึ้น ตามรายงานล่าสุดของ Bloomberg สกุลเงินดิจิทัลที่ใหญ่ที่สุดในโลกเพิ่มขึ้น 0.32% เป็น 98,747 ดอลลาร์ในเวลา 11:30 น. ในสิงคโปร์ โดยมีจุดสูงสุดระหว่างวันเริ่มต้นที่ 99,876.70 ดอลลาร์ เช่นเดียวกับ Dogecoin , Ether และอื่นๆ […]
ผู้เขียน  Cryptopolitan
วันที่ 26 ธ.ค. 2024
ในวันพฤหัสบดี Bitcoin เพิ่มขึ้นเนื่องจาก MicroStrategy ประกาศว่ามีแผนจะขายหุ้นเพิ่มเติมเพื่อรวบรวมกองทุนใหม่และใช้จ่ายกับสกุลเงินดิจิทัลมากขึ้น ตามรายงานล่าสุดของ Bloomberg สกุลเงินดิจิทัลที่ใหญ่ที่สุดในโลกเพิ่มขึ้น 0.32% เป็น 98,747 ดอลลาร์ในเวลา 11:30 น. ในสิงคโปร์ โดยมีจุดสูงสุดระหว่างวันเริ่มต้นที่ 99,876.70 ดอลลาร์ เช่นเดียวกับ Dogecoin , Ether และอื่นๆ […]
placeholder
ราคาน้ำมัน WTI เพิ่มขึ้นเหนือ $62.00 ขณะที่ OPEC+ รักษาโควตาน้ำมันน้ำมันดิบเวสต์เทกซัสอินเตอร์มีเดียต (WTI) ซึ่งเป็นเกณฑ์มาตรฐานน้ำมันดิบของสหรัฐฯ ซื้อขายอยู่ที่ประมาณ 62.15 ดอลลาร์ในช่วงเวลาการซื้อขายของเอเชียในวันพฤหัสบดี ราคา WTI ขยับสูงขึ้นจากความกังวลเกี่ยวกับอุปทานหลังจาก OPEC+ ตกลงที่จะคงนโยบายการผลิตไว้ไม่เปลี่ยนแปลง
ผู้เขียน  FXStreet
5 เดือน 29 วัน พฤหัส
น้ำมันดิบเวสต์เทกซัสอินเตอร์มีเดียต (WTI) ซึ่งเป็นเกณฑ์มาตรฐานน้ำมันดิบของสหรัฐฯ ซื้อขายอยู่ที่ประมาณ 62.15 ดอลลาร์ในช่วงเวลาการซื้อขายของเอเชียในวันพฤหัสบดี ราคา WTI ขยับสูงขึ้นจากความกังวลเกี่ยวกับอุปทานหลังจาก OPEC+ ตกลงที่จะคงนโยบายการผลิตไว้ไม่เปลี่ยนแปลง
placeholder
EUR/USD ขึ้นแม้ว่า PMI ของสหภาพยุโรปจะอ่อนแอ ขณะที่ความขัดแย้งในตะวันออกกลางครอบงำความเชื่อมั่นยูโร (EUR) แข็งค่าขึ้นเมื่อเทียบกับดอลลาร์สหรัฐ (USD) ในวันจันทร์ แม้ว่าอารมณ์ของตลาดจะยังคงซบเซาท่ามกลางวิกฤตในตะวันออกกลาง
ผู้เขียน  FXStreet
6 เดือน 24 วัน อังคาร
ยูโร (EUR) แข็งค่าขึ้นเมื่อเทียบกับดอลลาร์สหรัฐ (USD) ในวันจันทร์ แม้ว่าอารมณ์ของตลาดจะยังคงซบเซาท่ามกลางวิกฤตในตะวันออกกลาง
placeholder
การคาดการณ์ราคา EUR/JPY: ขึ้นไปที่ 169.00 ใกล้กับขอบบนของกรอบราคาขาขึ้นEUR/JPY ปรับตัวกลับจากการขาดทุนเมื่อเร็วๆ นี้ที่บันทึกไว้ในเซสชั่นก่อนหน้า โดยเคลื่อนไหวอยู่ที่ประมาณ 168.80 ในช่วงชั่วโมงการซื้อขายของยุโรปในวันพุธ จากการวิเคราะห์ทางเทคนิคของกราฟรายวัน คู่สกุลเงินข้ามนี้ยังคงอยู่ภายในรูปแบบกรอบราคาขาขึ้น ซึ่งช่วยเสริมแนวโน้มขาขึ้น
ผู้เขียน  FXStreet
เมื่อวาน 09: 57
EUR/JPY ปรับตัวกลับจากการขาดทุนเมื่อเร็วๆ นี้ที่บันทึกไว้ในเซสชั่นก่อนหน้า โดยเคลื่อนไหวอยู่ที่ประมาณ 168.80 ในช่วงชั่วโมงการซื้อขายของยุโรปในวันพุธ จากการวิเคราะห์ทางเทคนิคของกราฟรายวัน คู่สกุลเงินข้ามนี้ยังคงอยู่ภายในรูปแบบกรอบราคาขาขึ้น ซึ่งช่วยเสริมแนวโน้มขาขึ้น
placeholder
WTI ยังคงลดลงต่ำกว่า 64.50 ดอลลาร์จากความเสี่ยงด้านอุปทานในตะวันออกกลางที่ลดลงน้ำมันดิบเวสต์เทกซัสอินเตอร์มีเดียต (WTI) เกณฑ์มาตรฐานน้ำมันดิบของสหรัฐฯ ซื้อขายอยู่ที่ประมาณ 64.45 ดอลลาร์ในช่วงเวลาการซื้อขายของเอเชียในวันพฤหัสบดี ราคาของ WTI ยังคงปรับตัวลดลงหลังจากที่ประธานาธิบดีสหรัฐฯ โดนัลด์ ทรัมป์ ได้ผลักดันให้มีการหยุดยิงระหว่างอิสราเอลและอิหร่าน
ผู้เขียน  FXStreet
10 ชั่วโมงที่แล้ว
น้ำมันดิบเวสต์เทกซัสอินเตอร์มีเดียต (WTI) เกณฑ์มาตรฐานน้ำมันดิบของสหรัฐฯ ซื้อขายอยู่ที่ประมาณ 64.45 ดอลลาร์ในช่วงเวลาการซื้อขายของเอเชียในวันพฤหัสบดี ราคาของ WTI ยังคงปรับตัวลดลงหลังจากที่ประธานาธิบดีสหรัฐฯ โดนัลด์ ทรัมป์ ได้ผลักดันให้มีการหยุดยิงระหว่างอิสราเอลและอิหร่าน
goTop
quote