
Bitcoin Price Forecast: BTC rebounds to $102,000 as MetaPlanet buys the dip, geopolitical fears linger
- Bitcoin price recovers slightly above $102,000 on Tuesday after dipping to $98,200, hinting at a short-term recovery.
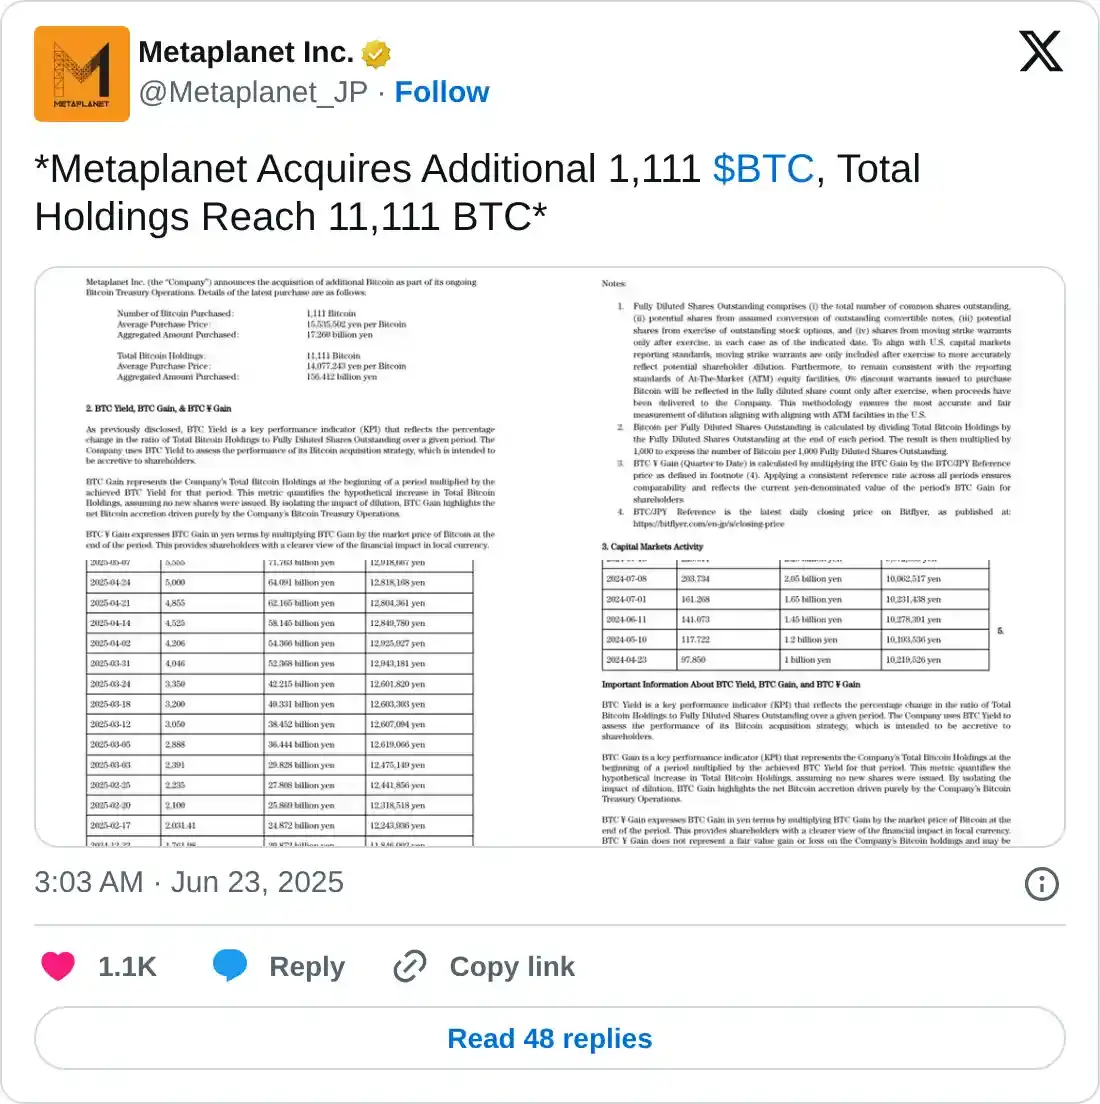
- MetaPlanet announces that it has added 1,111 BTC, bringing its total holding to 11,111 BTC.
- US attack on Iran sparks market-wide risk aversion on Sunday, triggering $656.56 million in liquidations.
Bitcoin (BTC) price rebounds slightly, trading around $102,000 at the time of writing on Monday after dipping to $98,200 the previous day. Institutional investors further supported the price recovery as MetaPlanet added 1,111 BTC to its treasury reserve. However, traders should be cautious as the US attack on Iran sparked market-wide risk aversion on Sunday, triggering over $656 million in liquidations.
Bitcoin dips to $98,200 as the US strikes on Iran’s nuclear sites
Bitcoin price dipped to $98,200 on Sunday as the Middle East conflict took a new turn over the weekend. US President Donald Trump announced late Saturday that his country had attacked Iran’s three nuclear sites. This geopolitical conflict has triggered a risk-off sentiment in the global markets, with BTC dipping below its $100,000 mark during the weekend.

According to CoinGlass, the liquidation chart indicates that 187,016 traders were liquidated, resulting in a total liquidation value of over $656.12 million in the last 24 hours. The largest single liquidation order happened on HTX - BTC-USDT, with a value of $35.45 million.
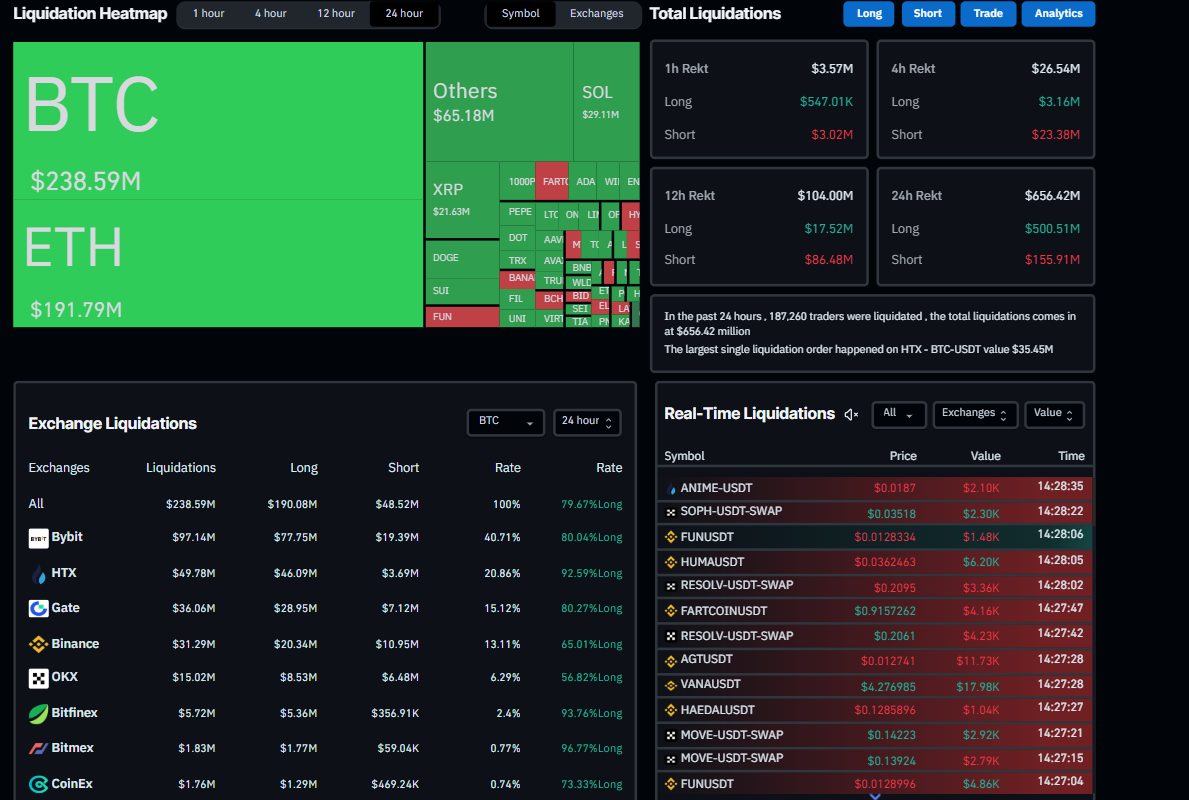
Liquidation Heatmap chart. Source: CoinGlass
Iran's response to the US attack could be another event of concern for Bitcoin traders this week, which raises the risk of spillover and a broader conflict in the Middle East and could trigger deeper losses in risky assets such as Bitcoin.
MetaPlanet buys BTC price dips
Despite the escalating war, Bitcoin institutional demand starts the week on a positive note. Japanese investment firm Metaplanet announced on Monday that it has purchased an additional 1,111 BTC, bringing the total holding to 11,111 BTC.
Bitcoin Price Forecast: BTC price could recover to fill the CME gap before declining
BTC/USDT daily chart shows that its price closed below its 50-day Exponential Moving Average at $102,942 on Saturday and declined by 1.13%, reaching a low of $98,200 the following day. At the time of writing on Monday, it recovers slightly, trading at around $101,800.
Bitcoin's price action suggests two possibilities.
The first case would be a slight recovery in its price towards its 50-day EMA level at $102,968 and the volume profile POC (Point of Control) at $103,800, the price level with the highest traded volume since early April. These levels, between $102,968 and $103,800, would form a key resistance zone.
In the second case, the BTC futures CME (Chicago Mercantile Exchange) 4-hour chart also shows a gap between $101,705 and $103,365. Weekend BTC moves cause this price gap. Historically, the market tends to fill these gaps before resuming its ongoing trend. In such a case, BTC could recover toward its CME gap, which roughly coincides with the levels mentioned above, before resuming its downward trend.
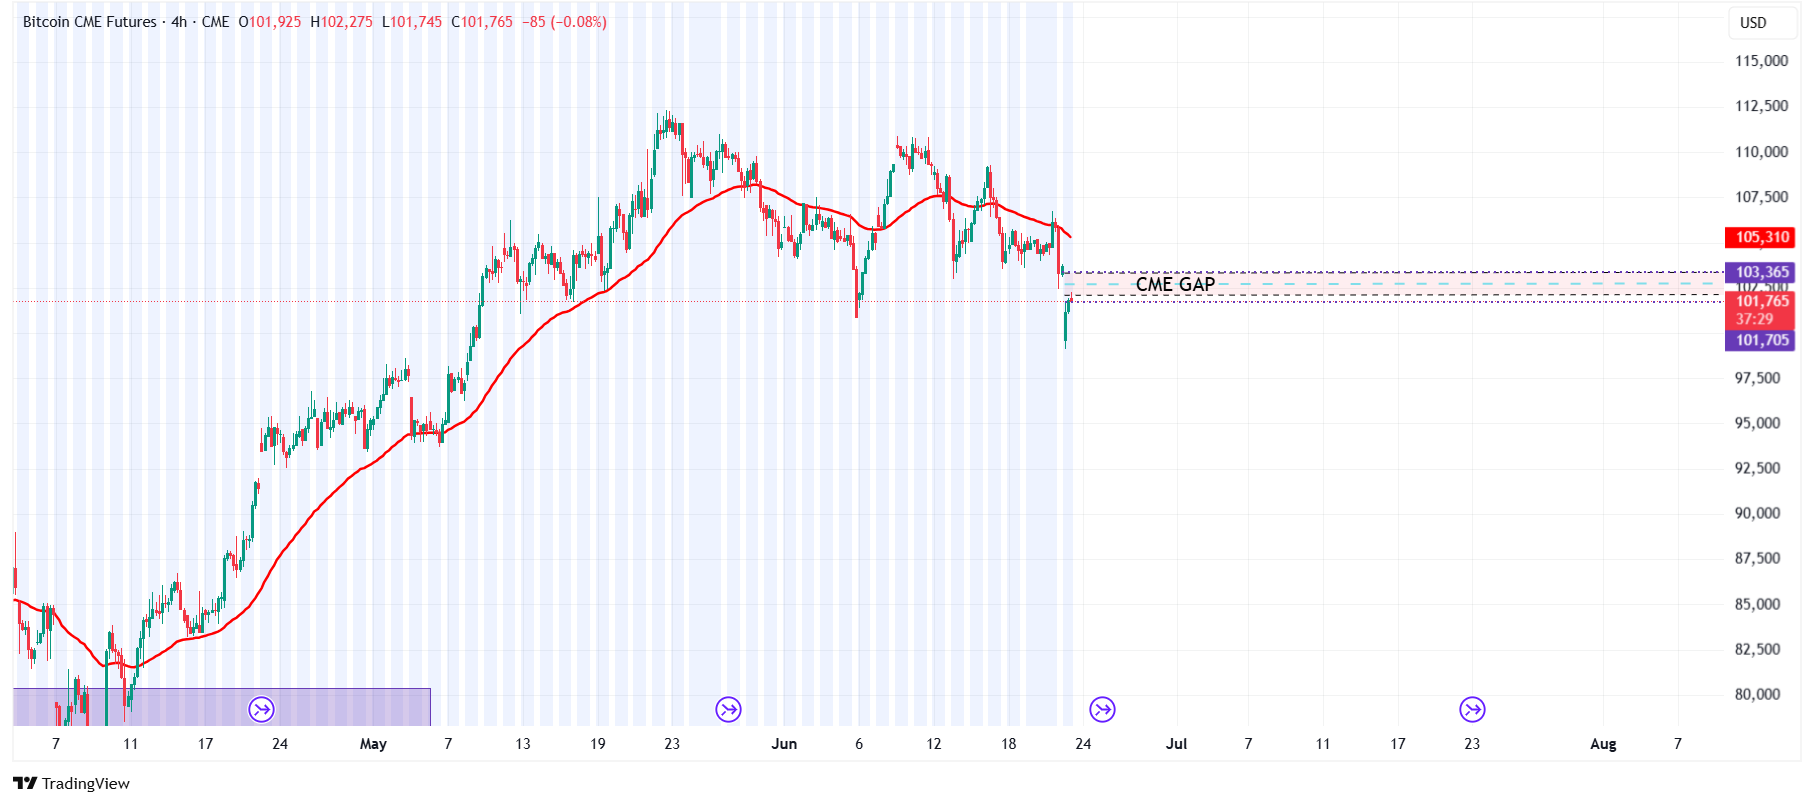
BTC CME 4hr chart
If BTC faces rejection from these levels, it could extend the decline toward its Sunday low of $98,200.
The Relative Strength Index (RSI) on the daily chart reads 39 above its oversold condition and points upward towards its neutral level of 50, indicating some signs of recovery. However, if the RSI continues to decline, BTC could experience a sharp correction.
The Moving Average Convergence Divergence (MACD) on the daily chart showed a bearish crossover. It also highlights a rising red histogram bar below its neutral level, suggesting bearish strength and indicating the continuation of a downward trend.
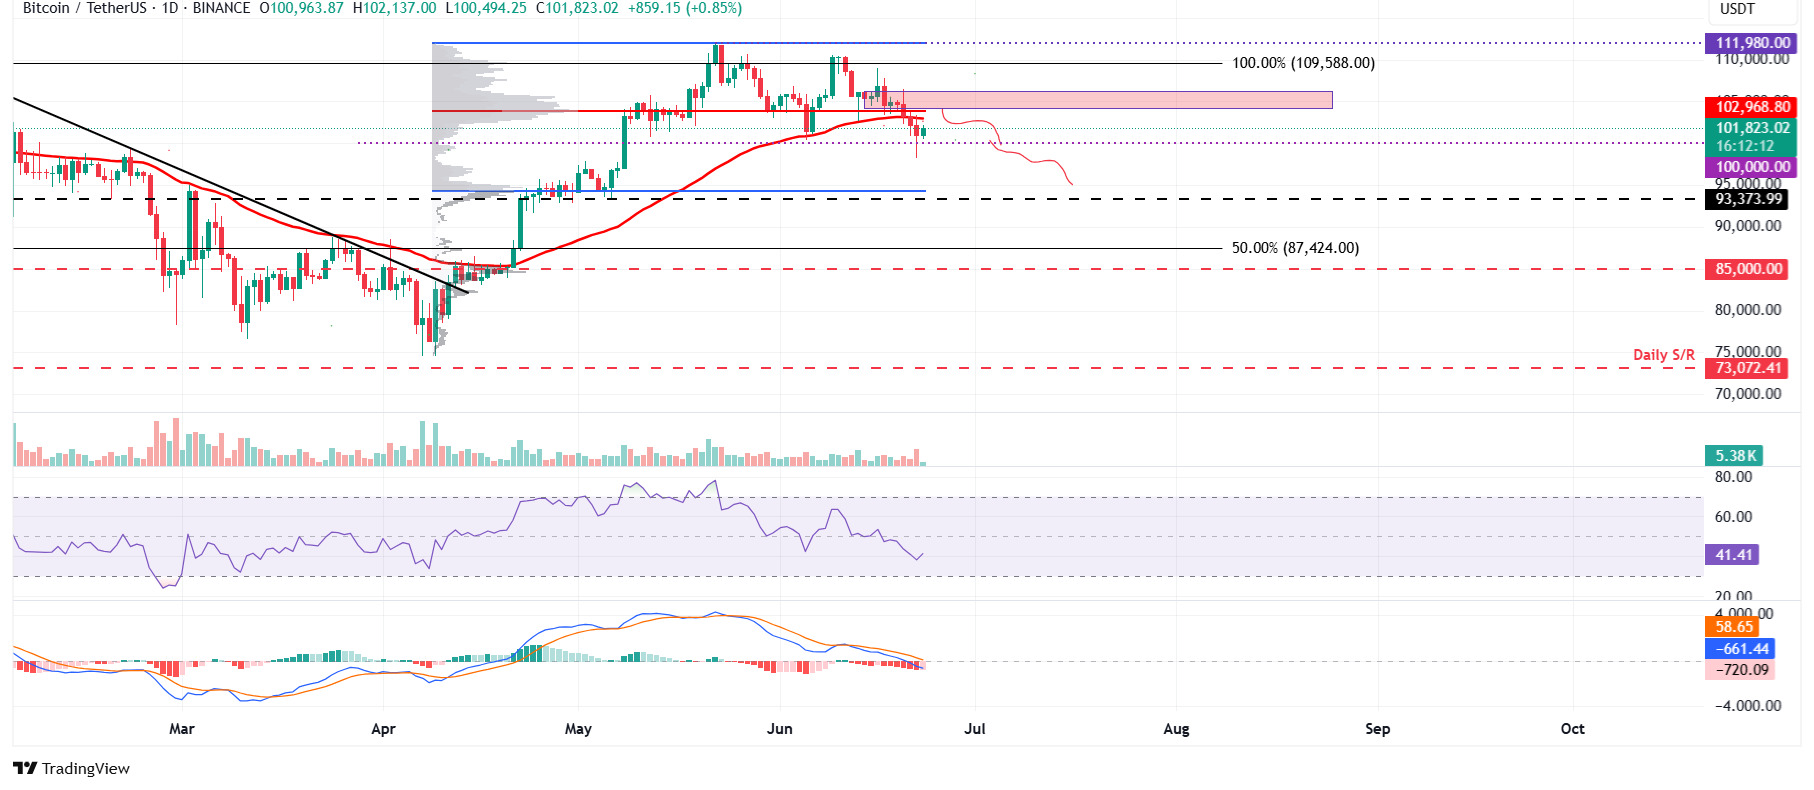
BTC/USDT daily chart
However, if BTC closes above $103,800 on a daily basis, it could extend the recovery toward its next resistance level at $109,588.
Bitcoin, altcoins, stablecoins FAQs
Bitcoin is the largest cryptocurrency by market capitalization, a virtual currency designed to serve as money. This form of payment cannot be controlled by any one person, group, or entity, which eliminates the need for third-party participation during financial transactions.
Altcoins are any cryptocurrency apart from Bitcoin, but some also regard Ethereum as a non-altcoin because it is from these two cryptocurrencies that forking happens. If this is true, then Litecoin is the first altcoin, forked from the Bitcoin protocol and, therefore, an “improved” version of it.
Stablecoins are cryptocurrencies designed to have a stable price, with their value backed by a reserve of the asset it represents. To achieve this, the value of any one stablecoin is pegged to a commodity or financial instrument, such as the US Dollar (USD), with its supply regulated by an algorithm or demand. The main goal of stablecoins is to provide an on/off-ramp for investors willing to trade and invest in cryptocurrencies. Stablecoins also allow investors to store value since cryptocurrencies, in general, are subject to volatility.
Bitcoin dominance is the ratio of Bitcoin's market capitalization to the total market capitalization of all cryptocurrencies combined. It provides a clear picture of Bitcoin’s interest among investors. A high BTC dominance typically happens before and during a bull run, in which investors resort to investing in relatively stable and high market capitalization cryptocurrency like Bitcoin. A drop in BTC dominance usually means that investors are moving their capital and/or profits to altcoins in a quest for higher returns, which usually triggers an explosion of altcoin rallies.
บทความแนะนำ


