
Top Crypto Gainers Price Prediction: OKB, IP, HYPE post gains, shrug off Bitcoin’s dip to $100,000
- OKB edges higher on Monday after three consecutive bearish days, undermining the pullback over the weekend.
- Story bounces off a falling channel’s support trendline, signaling a potential trend reversal.
- HYPE edges higher on Monday, extending the weekend’s recovery stemming from a support trendline that has been held since April.
The broader cryptocurrency market experiences a surge in selling pressure as Bitcoin (BTC) dips close to $100,000 at press time on Monday. Against this backdrop, the majority of top altcoins trade in the red while OKB (OKB), Story (IP), and Hyperliquid (HYPE) hold bullish momentum.
At the time of writing, Bitcoin is trading lower for its fifth consecutive bearish day, as bulls struggle to hold above $100,000 following the 24-hour low of $98,200 on Sunday. A close below $100,000 could send BTC crashing towards Sunday’s low, extending the broader market's downfall.
Alternatively, a hold-off at the psychological level could increase cases of altcoins rising against the bearish tide.
OKB’s trend reversal gains strength
OKB records a jump of over 6% at press time on Monday, marking a bullish start to the week. With a bullish engulfing candle forming, OKB undermines the three-day drop, testing the $50 psychological support level.
A close above $53.88 will mark a new high daily close price in June, potentially extending the uptrend towards $56.17, last tested on May 10.
Turning to momentum indicators, the Moving Average Convergence/Divergence (MACD) indicator nears its signal line for a bullish crossover, indicating a potential trend reversal.
The Relative Strength Index (RSI) at 55 takes another sharp reversal, crossing above the halfway line, which projects a resurgence of bullish momentum. The indicator supports upside potential with room for growth before reaching the overbought conditions.
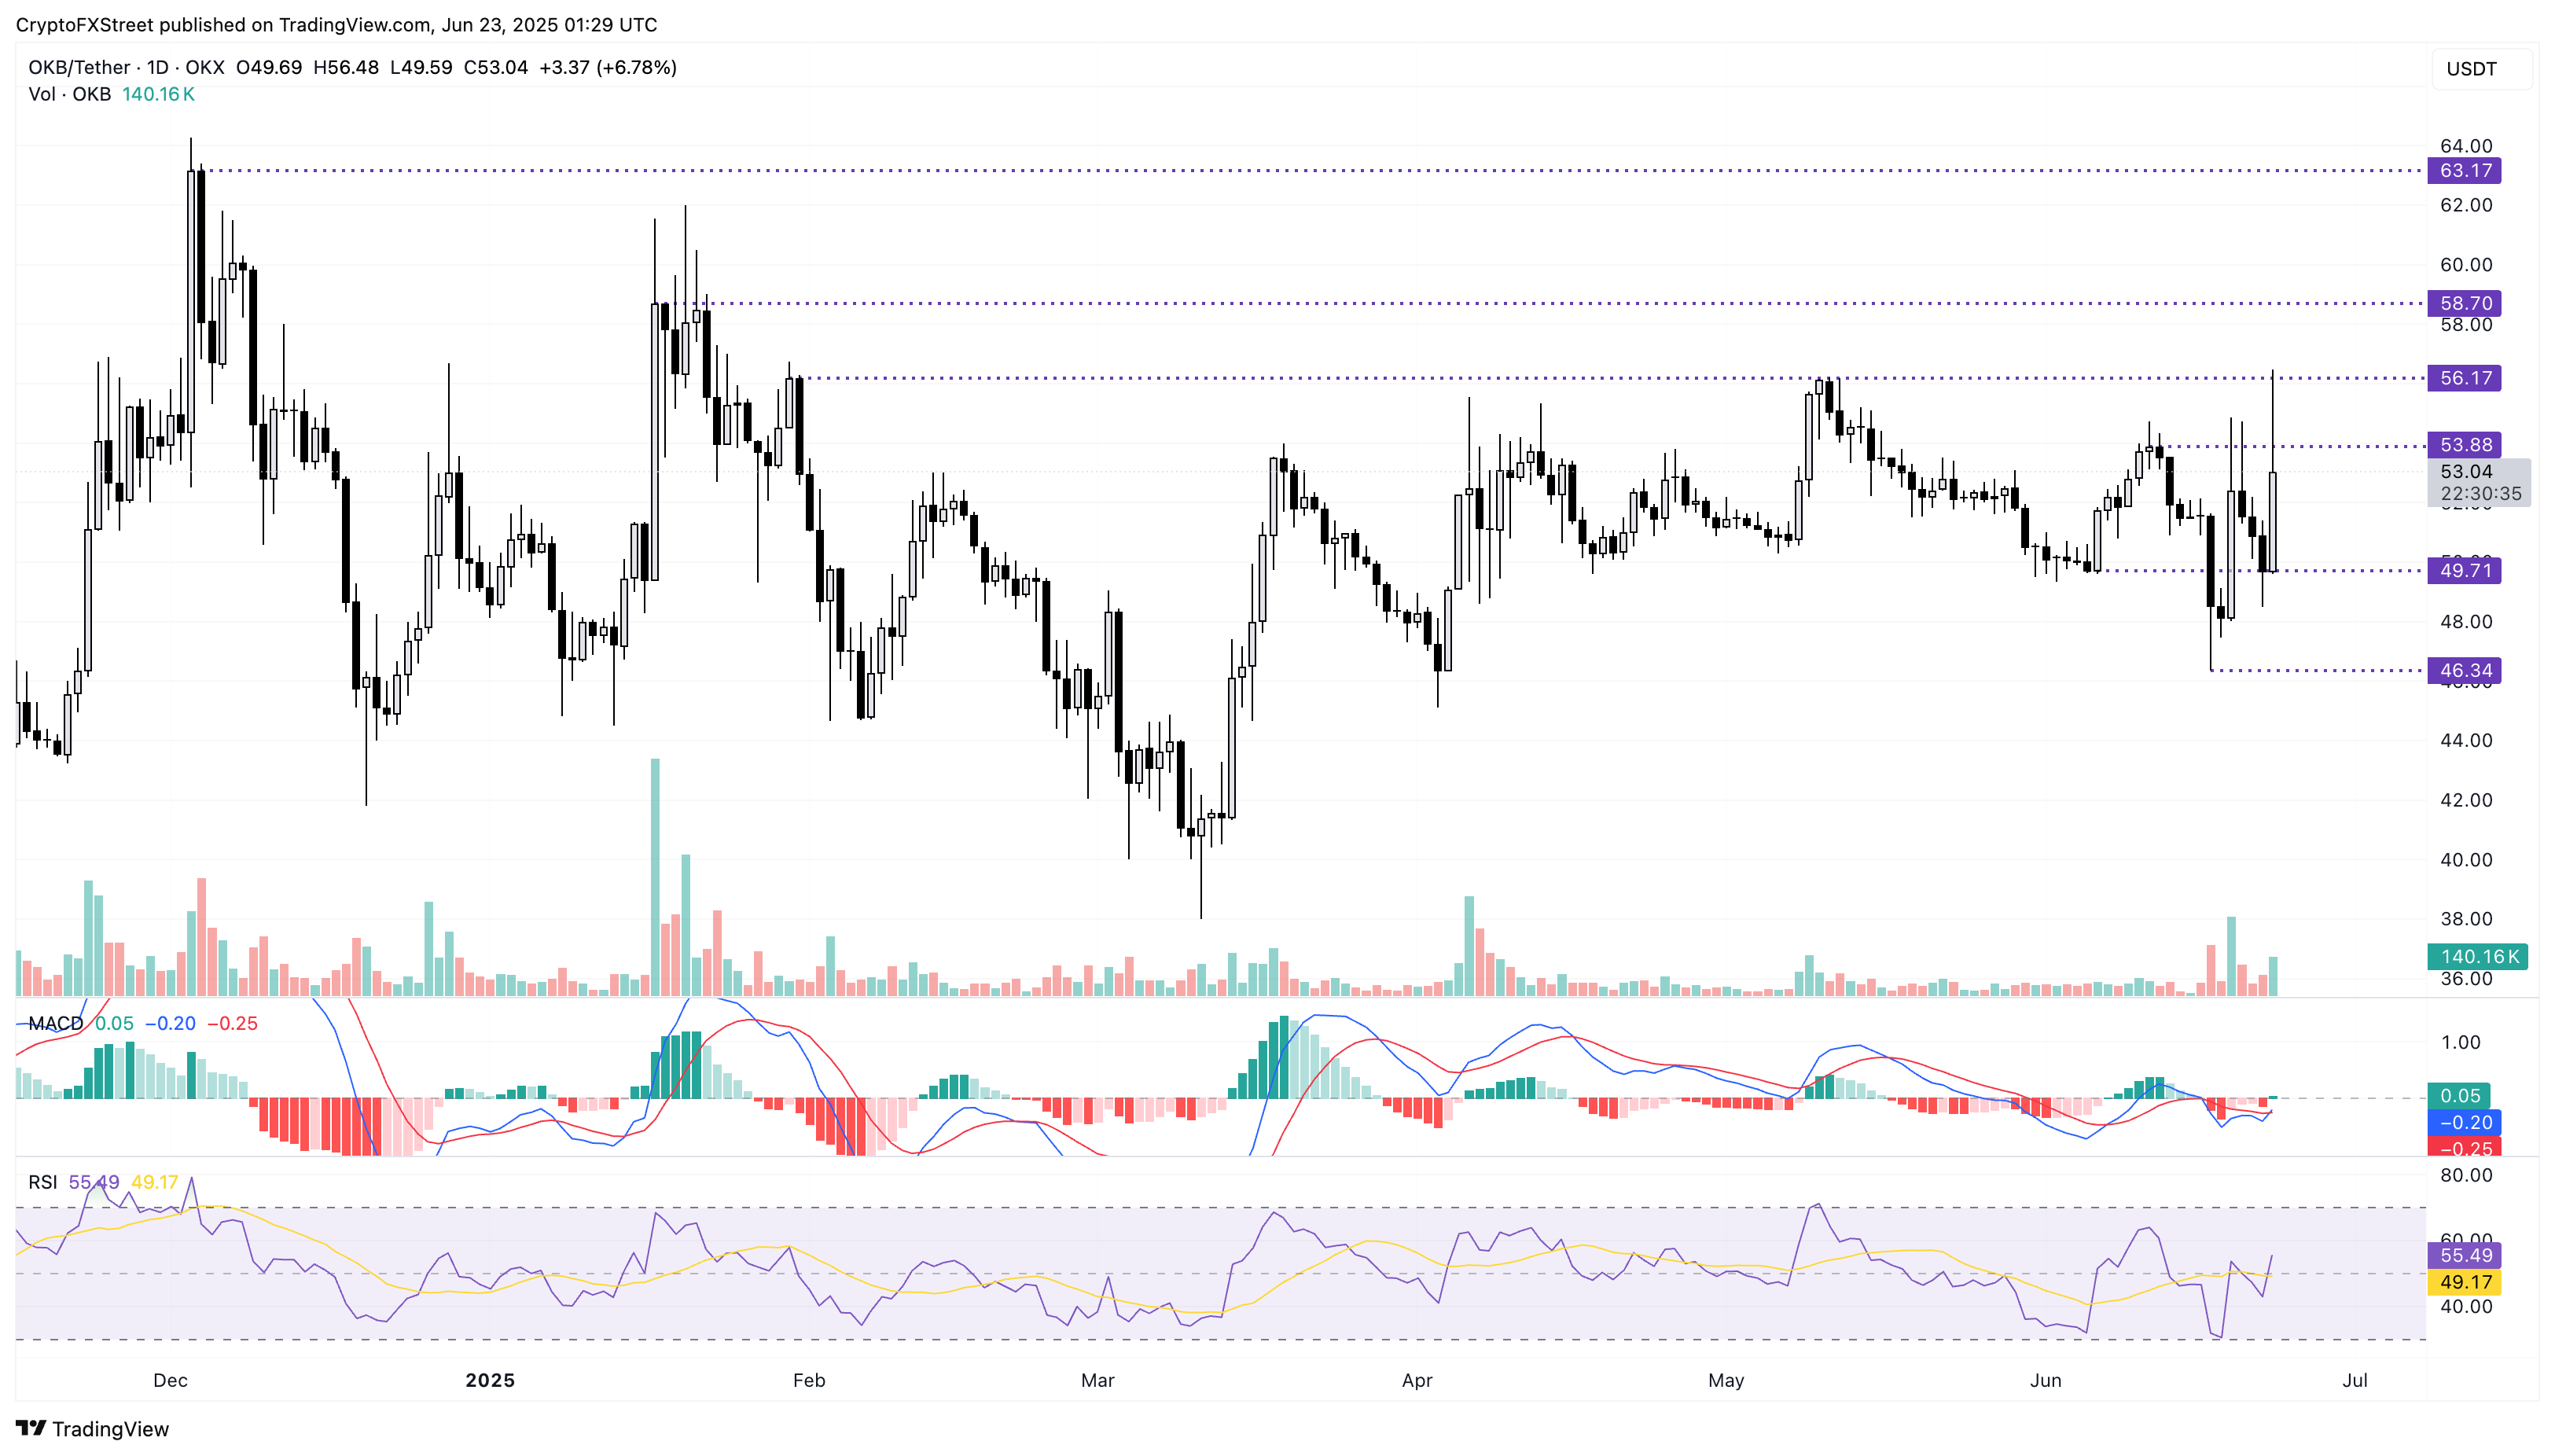
OKB/USDT daily price chart.
However, the 24-hour high at $56.48 creates a long upper shadow as seen in the bearish reversal last week. A failure to close above $53.88 could prolong a sideways trend.
Story to bounce back within a falling channel
Story edges higher by 10%, crossing the $3 mark at press time on Monday, suggesting a trend reversal from a support trendline formed by the lows on March 7, April 7, and June 19. To put a falling channel in perspective, a resistance trendline formed by lower highs on February 26, March 25, May 11, and May 22 runs parallel to the support trendline.
Story targets the upper trendline near $3.78, aligned with the closing price on May 30.
The MACD indicator reverses within the negative territory, concurrent with the declining red histogram bars. A potential bullish crossover between the MACD and signal lines, with bullish histograms rising above the zero line, is considered a buy signal.
The RSI at 38 springs from the oversold zone, signaling a boost in bullish momentum and a potential upswing within the channel before it reaches overbought conditions.
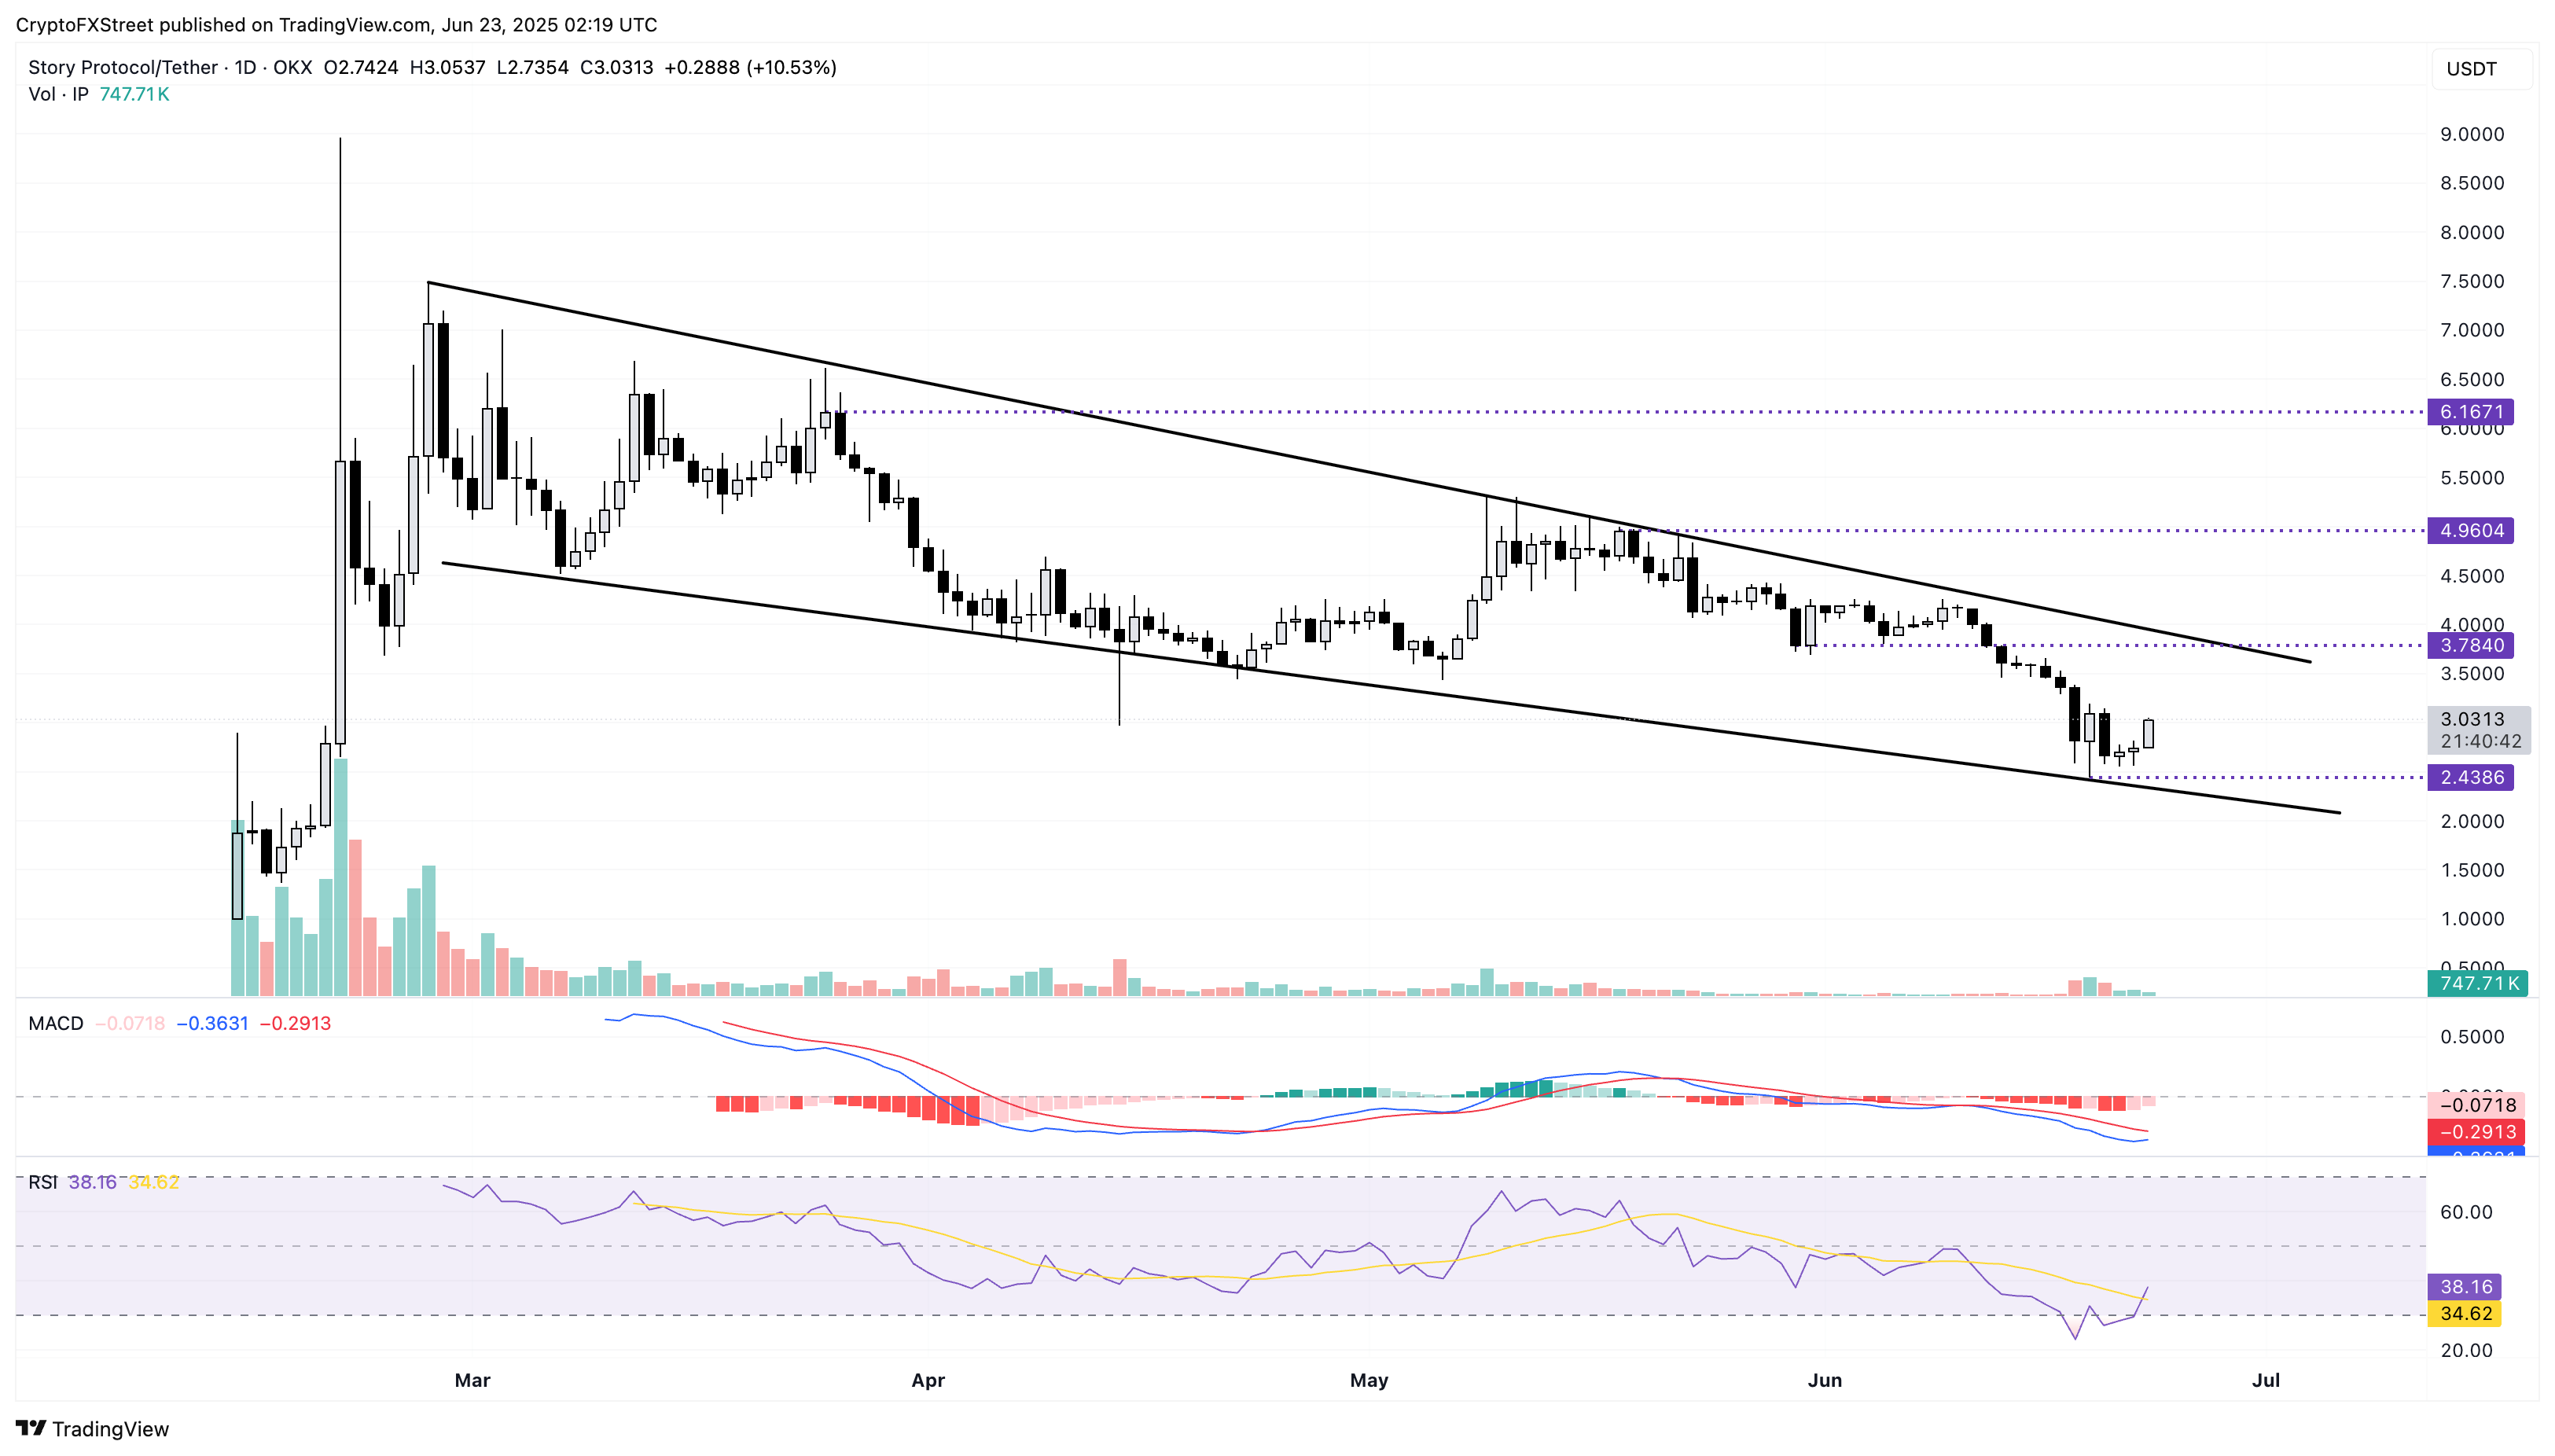
IP/USDT daily price chart.
If Story loses the intraday gains, it could retest last week’s low at $2.43.
HYPE regains bullish momentum at key trendline
Hyperliquid reports a minor growth of under 1% at the time of writing on Monday. HYPE marks the third consecutive bullish candle, extending the 7% weekend recovery.
A support trendline formed higher lows on April 7, April 28, May 6, and June 20. The immediate resistance for HYPE aligns with the May 25 swing high at $39.05.
The MACD indicator inches closer towards its signal line for a bullish crossover, considered a trend reversal and buy signal. The RSI at 49 reverses towards the halfway line as bullish momentum replenishes, indicating a potential uptrend continuation.
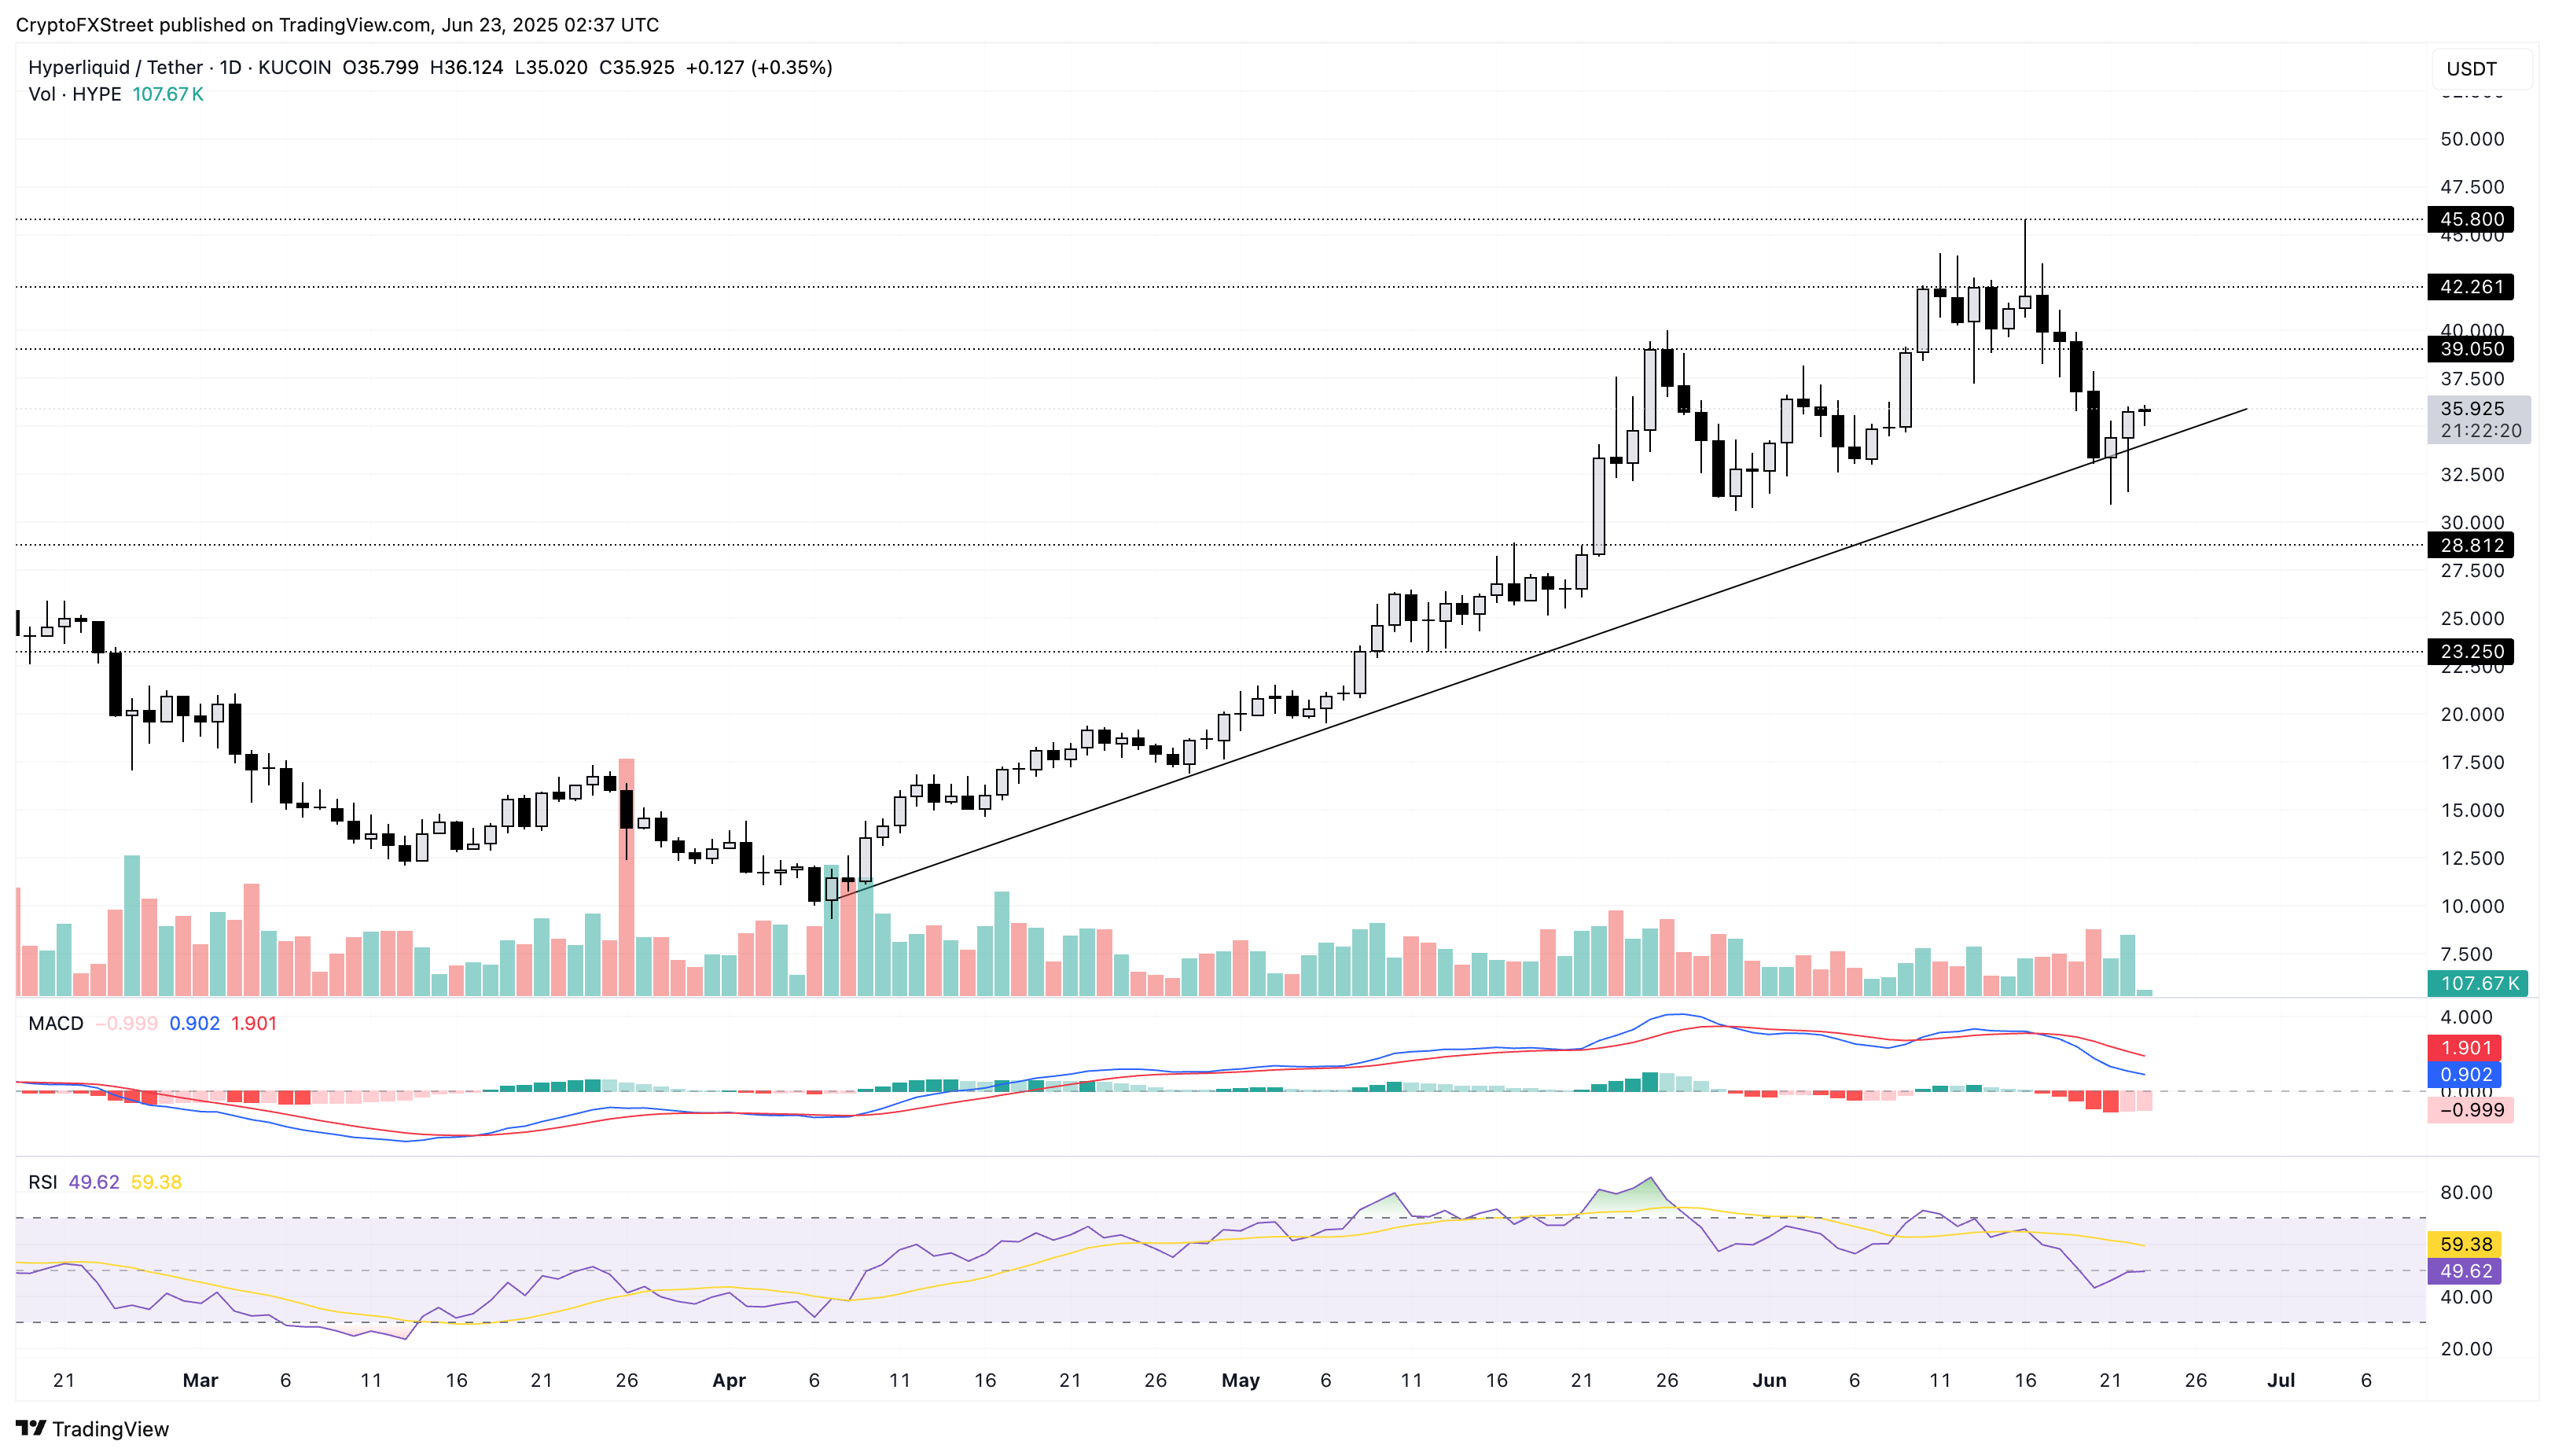
HYPE/USDT daily price chart.
However, if HYPE closes under the support trendline, aligning with Sunday’s opening price at $34.40, it could extend the decline to $28.81, last tested on May 17.
บทความแนะนำ


