
Top 3 Price Prediction: Bitcoin, Ethereum, Ripple – BTC, ETH and XRP poised for volatility ahead of US CPI
- Bitcoin price hovers around $109,800 on Wednesday, just 2.2% shy of its all-time high.
- Ethereum price closes above its upper range at $2,724, suggesting a potential rally ahead.
- XRP finds support around its 50-day EMA at $2.26, with recovery on the cards.
Bitcoin (BTC), Ethereum (ETH), and Ripple (XRP) are showing early signs of strength as BTC is nearing its all-time highs, ETH is breaking past its consolidation, and XRP is finding support around its key level. The upcoming US Consumer Price Index (CPI) data release on Wednesday could serve as a catalyst, bringing volatility to these top three cryptocurrencies.
Bitcoin inches away from its record highs
Bitcoin price retested and found support around its 50-day Exponential Moving Average (EMA) at $101,000 on Friday, and then recovered sharply over the next three days. BTC closed above its key resistance level of $106,406 on Monday and hovered around $110,000 the next day. At the time of writing on Wednesday, it is trading slightly down at around $109,600.
If BTC continues its upward trend, it could extend the rally to retest its May 22 all-time high of $111,980.
The Relative Strength Index (RSI) on the daily chart reads 61, above its neutral level of 50, indicating strong bullish momentum. Moreover, the Moving Average Convergence Divergence (MACD) also showed a bullish crossover on Tuesday, giving buy signals and indicating an upward trend.
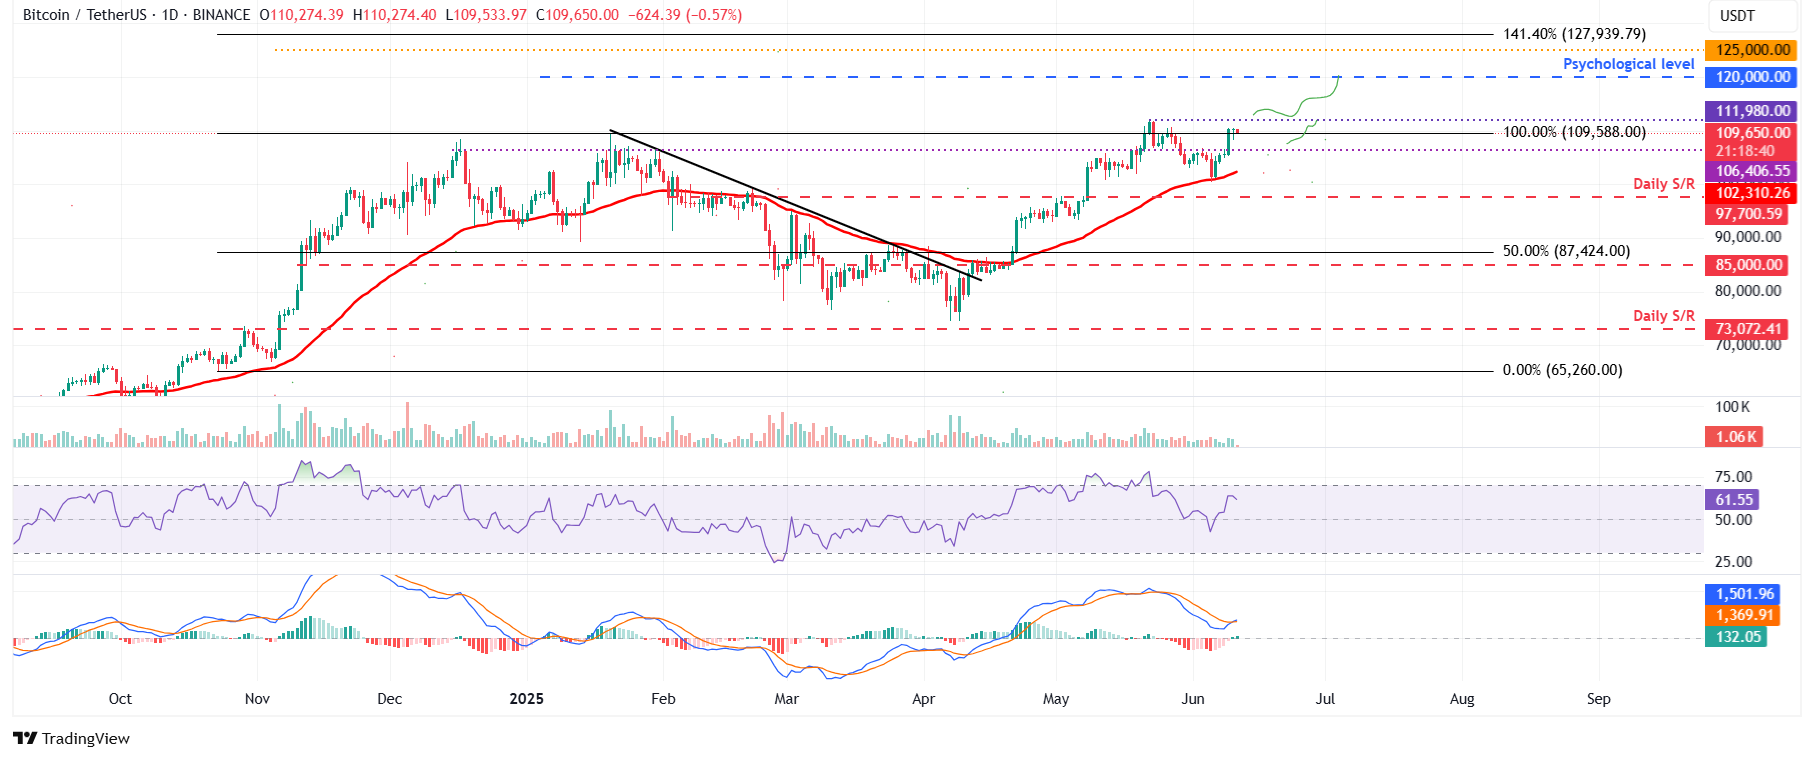
BTC/USDT daily chart
However, if BTC faces a correction, it could extend the decline to retest its daily support level at $106,406.
Ethereum bulls target the $3,000 mark as it closes above its key resistance
Ethereum price has been consolidating between $2,461 and $2,724 since mid-May and closed above the upper boundary at $2,724 on Tuesday. At the time of writing on Wednesday, it trades slightly down around $2,774.
If the $2,724 holds as support, the ETH price could extend the rally to retest its key psychological level of $3,000.
The RSI on the daily chart reads 64, above its neutral level of 50, indicating strong bullish momentum. The MACD indicator on the daily chart is about to flip a bullish crossover. If the MACD generates this bullish crossover, it would provide a buying signal and suggest an upward trend ahead.
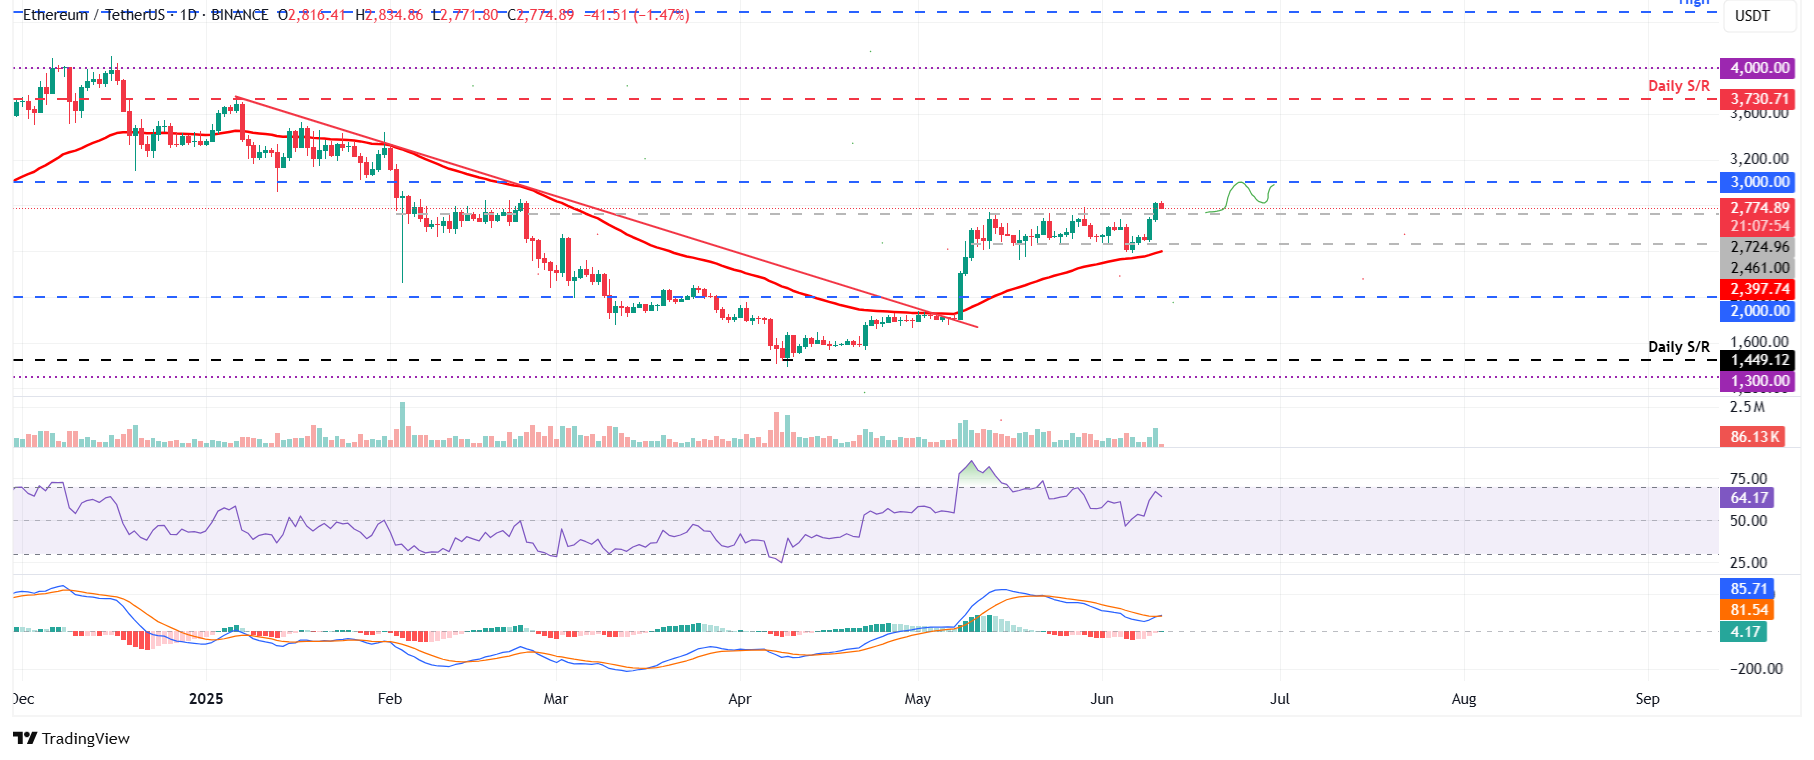
ETH/USDT daily chart
On the other hand, if ETH fails to find support around $2,724, it could extend the decline to retest its lower consolidation boundary at $2,461.
XRP is poised for a recovery as it finds support around the 50-day EMA
XRP price broke above its 50-day EMA at $2.26 on Monday and then retested, finding support the next day. At the time of writing on Wednesday, it hovers at around $2.28.
If the 50-day EMA continues to hold as support, it could extend the recovery to retest its next resistance level at $2.72.
The RSI on the daily chart reads 52, hovering around its neutral level of 50, indicating indecisiveness among traders. However, the MACD indicator showed a bullish crossover on Monday, giving buy signals and suggesting an upward trend ahead.
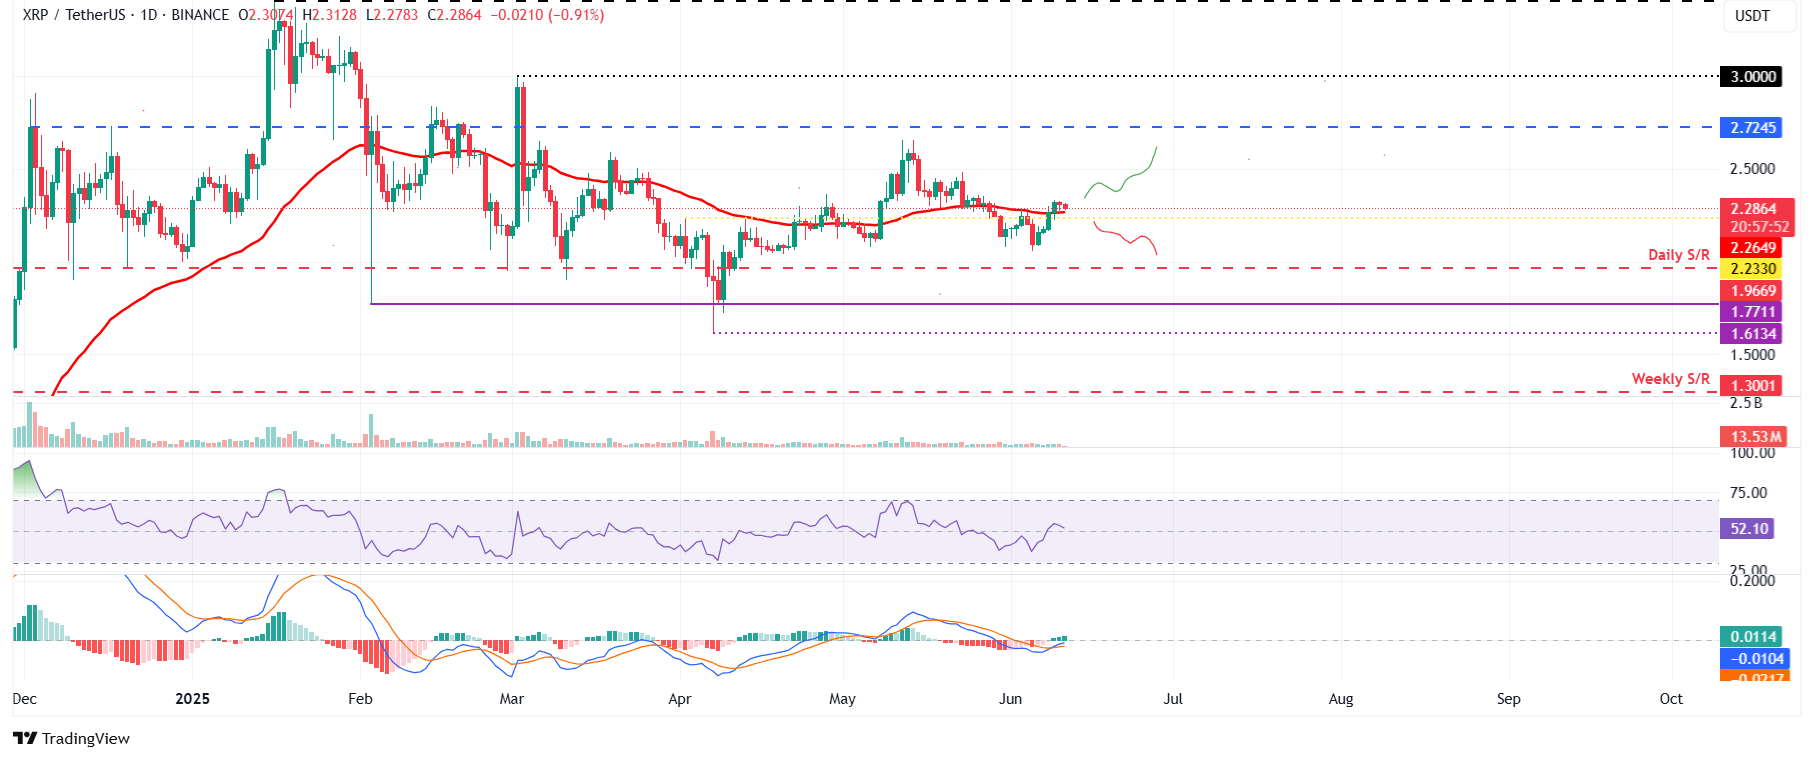
XRP/USDT daily chart
Conversely, if XRP fails to find support around its 50-day EMA at $2.26 and closes below it, the decline could extend to its next daily support level at $2.23.
Bitcoin, altcoins, stablecoins FAQs
Bitcoin is the largest cryptocurrency by market capitalization, a virtual currency designed to serve as money. This form of payment cannot be controlled by any one person, group, or entity, which eliminates the need for third-party participation during financial transactions.
Altcoins are any cryptocurrency apart from Bitcoin, but some also regard Ethereum as a non-altcoin because it is from these two cryptocurrencies that forking happens. If this is true, then Litecoin is the first altcoin, forked from the Bitcoin protocol and, therefore, an “improved” version of it.
Stablecoins are cryptocurrencies designed to have a stable price, with their value backed by a reserve of the asset it represents. To achieve this, the value of any one stablecoin is pegged to a commodity or financial instrument, such as the US Dollar (USD), with its supply regulated by an algorithm or demand. The main goal of stablecoins is to provide an on/off-ramp for investors willing to trade and invest in cryptocurrencies. Stablecoins also allow investors to store value since cryptocurrencies, in general, are subject to volatility.
Bitcoin dominance is the ratio of Bitcoin's market capitalization to the total market capitalization of all cryptocurrencies combined. It provides a clear picture of Bitcoin’s interest among investors. A high BTC dominance typically happens before and during a bull run, in which investors resort to investing in relatively stable and high market capitalization cryptocurrency like Bitcoin. A drop in BTC dominance usually means that investors are moving their capital and/or profits to altcoins in a quest for higher returns, which usually triggers an explosion of altcoin rallies.
บทความแนะนำ


