


Ripple and Stellar outlook: Remain under bearish pressure as corrective declines cap upside
- XRP remains under pressure, gravitating below the $1 support on Tuesday.
- XLM extends its corrective decline, holding below $0.157 and all major EMAs, signaling continued weakness.
- Mixed derivatives and on-chain metrics with a slight bearish tilt show cautious sentiment and limited upside potential for both tokens.
Ripple (XRP) and Stellar (XLM) remain under pressure as broader market uncertainty and weak technical momentum weigh on both altcoins. XRP is hovering below the key $1 mark on Tuesday while XLM continues its corrective decline below $0.157. Meanwhile, mixed derivatives and on-chain signals indicate cautious sentiment, leaving both cryptocurrencies vulnerable to further downside.
Mixed derivatives cap recovery
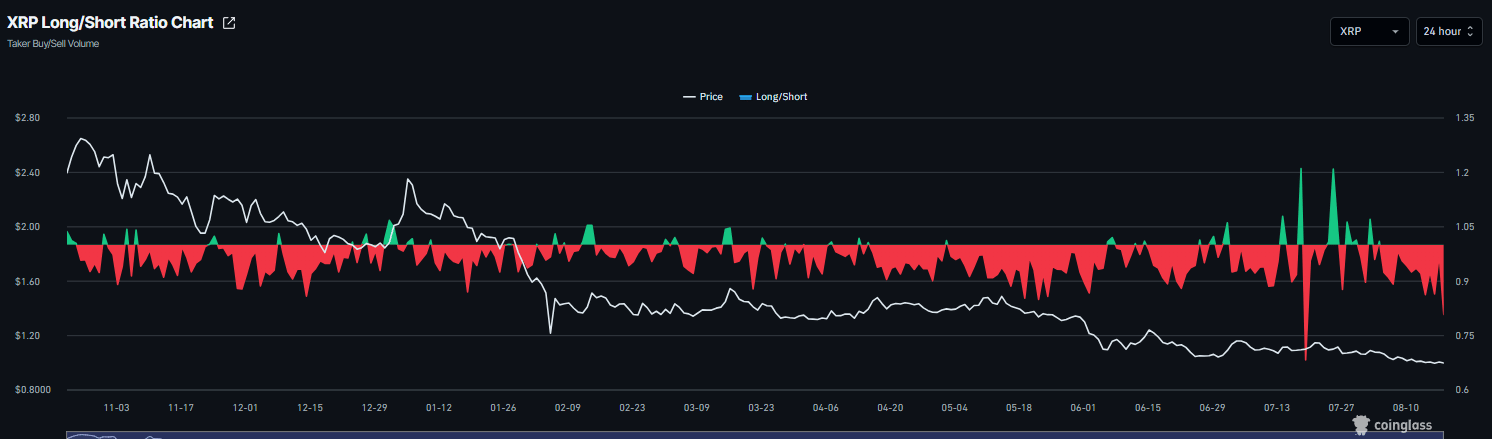
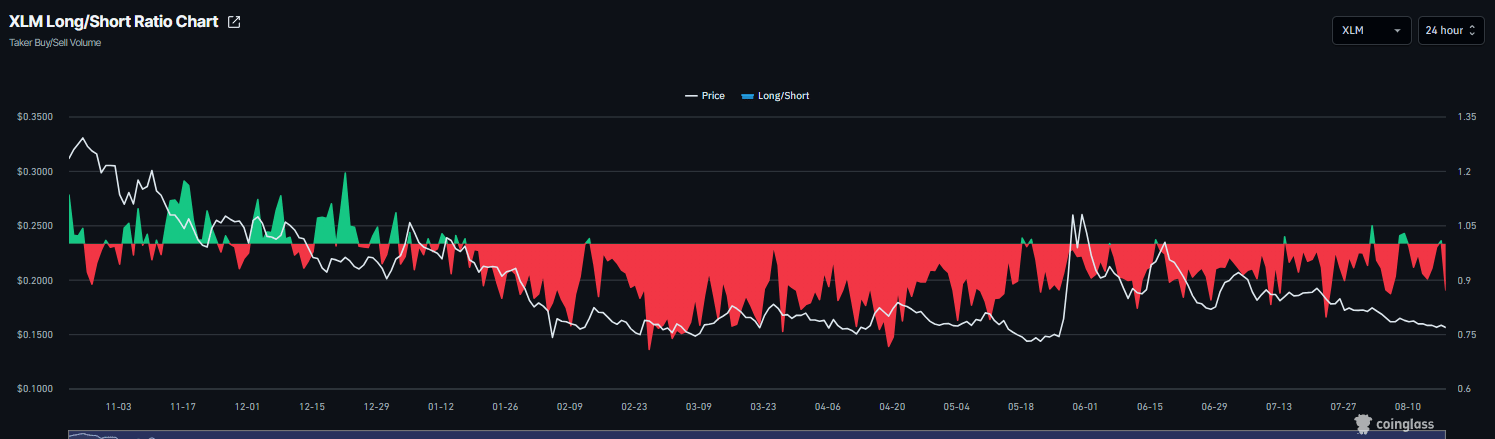
Derivatives data shows mixed sentiment with a mild bearish tilt among traders. CoinGlass’ long-to-short ratio for XRP and XLM reads 0.80 and 0.87, respectively, on Tuesday, nearing their lowest levels in a month. A ratio below one indicates bearish sentiment, as traders bet asset prices will fall.
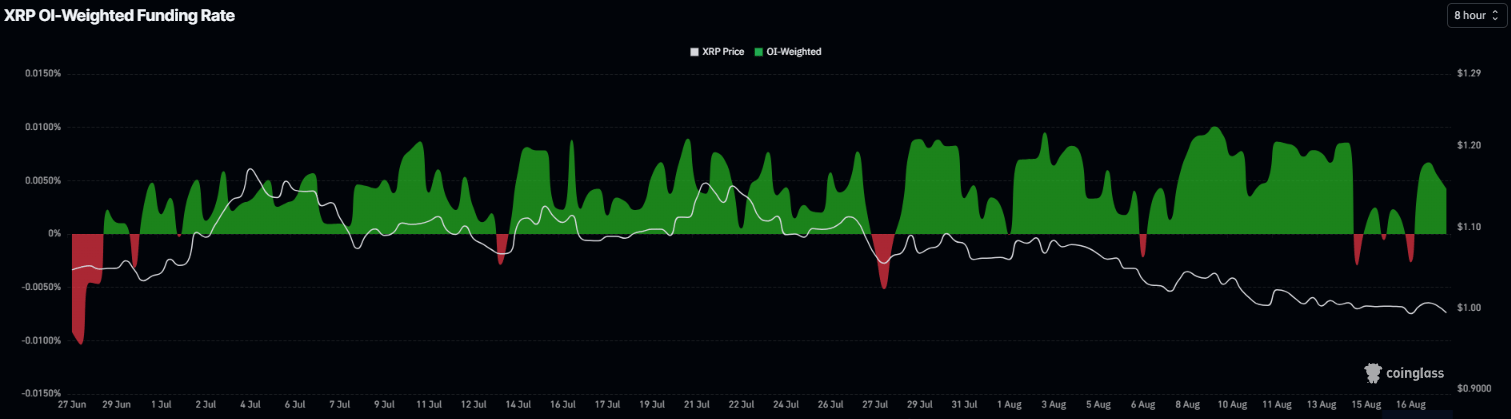
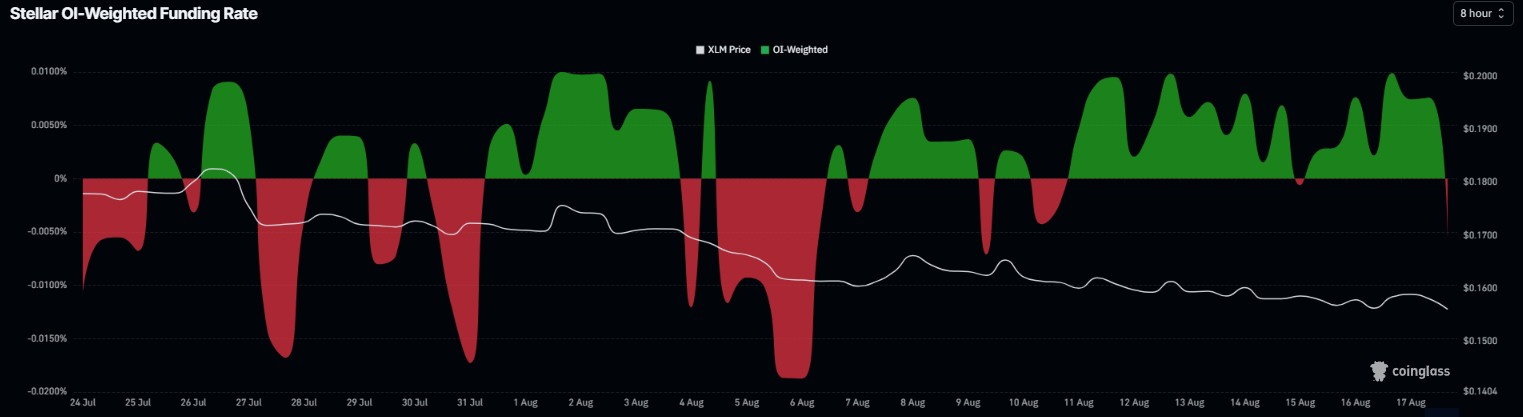
In addition, the XRP funding rate flipped positive on Monday and read 0.0042% on Tuesday, indicating that longs are paying shorts and reflecting a bullish bias. Meanwhile, the XLM rate flipped negative, reading -0.0054% on Tuesday. This negative rate indicates that short traders are paying longs and reflects a bearish bias.
Cautious optimism among traders
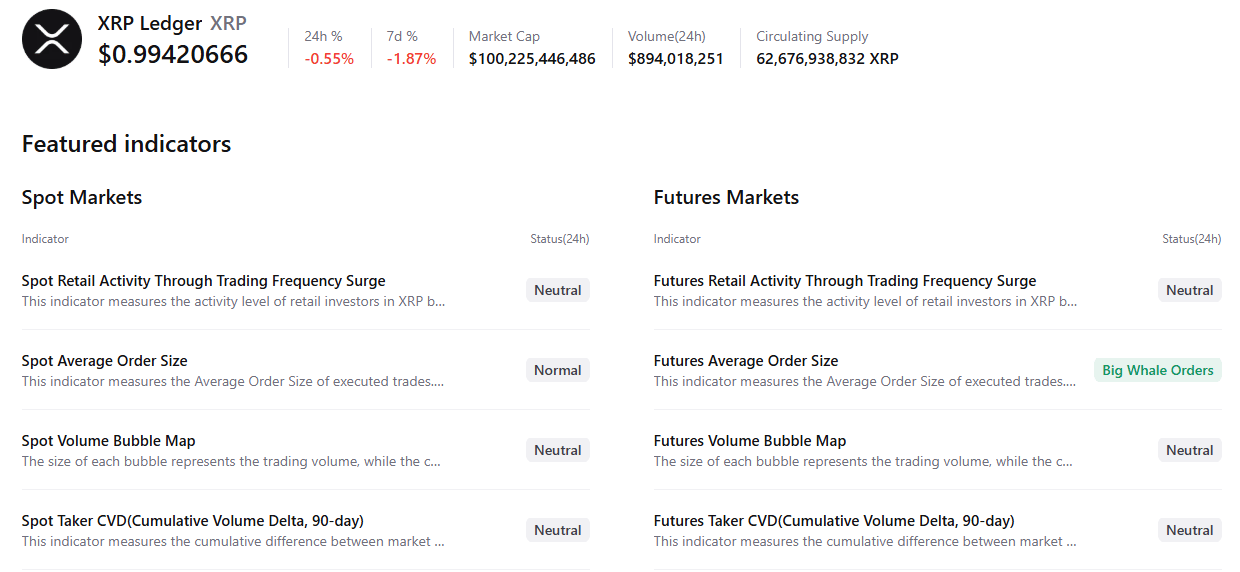
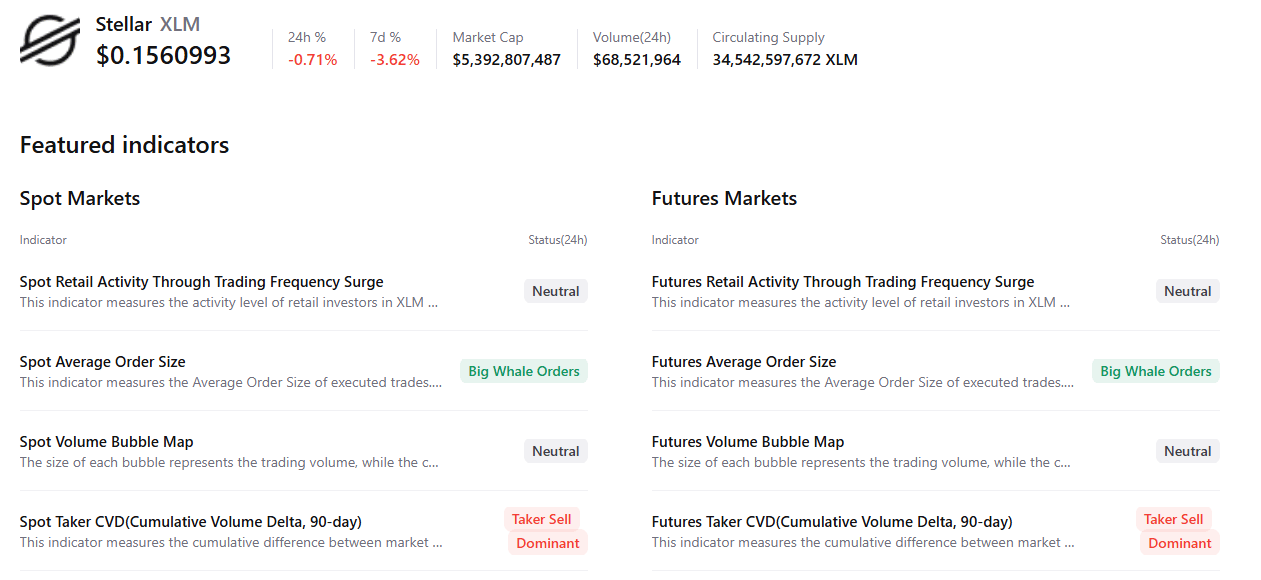
CryptoQuant’s summary data shows cautious optimism. XRP’s futures markets show large whale orders, while other metrics remain neutral, supporting a potential recovery. However, XLM shows selling-side dominance in both markets, and large whale orders, hinting at cautious sentiment among traders.
XRP technical outlook: Slips below key support
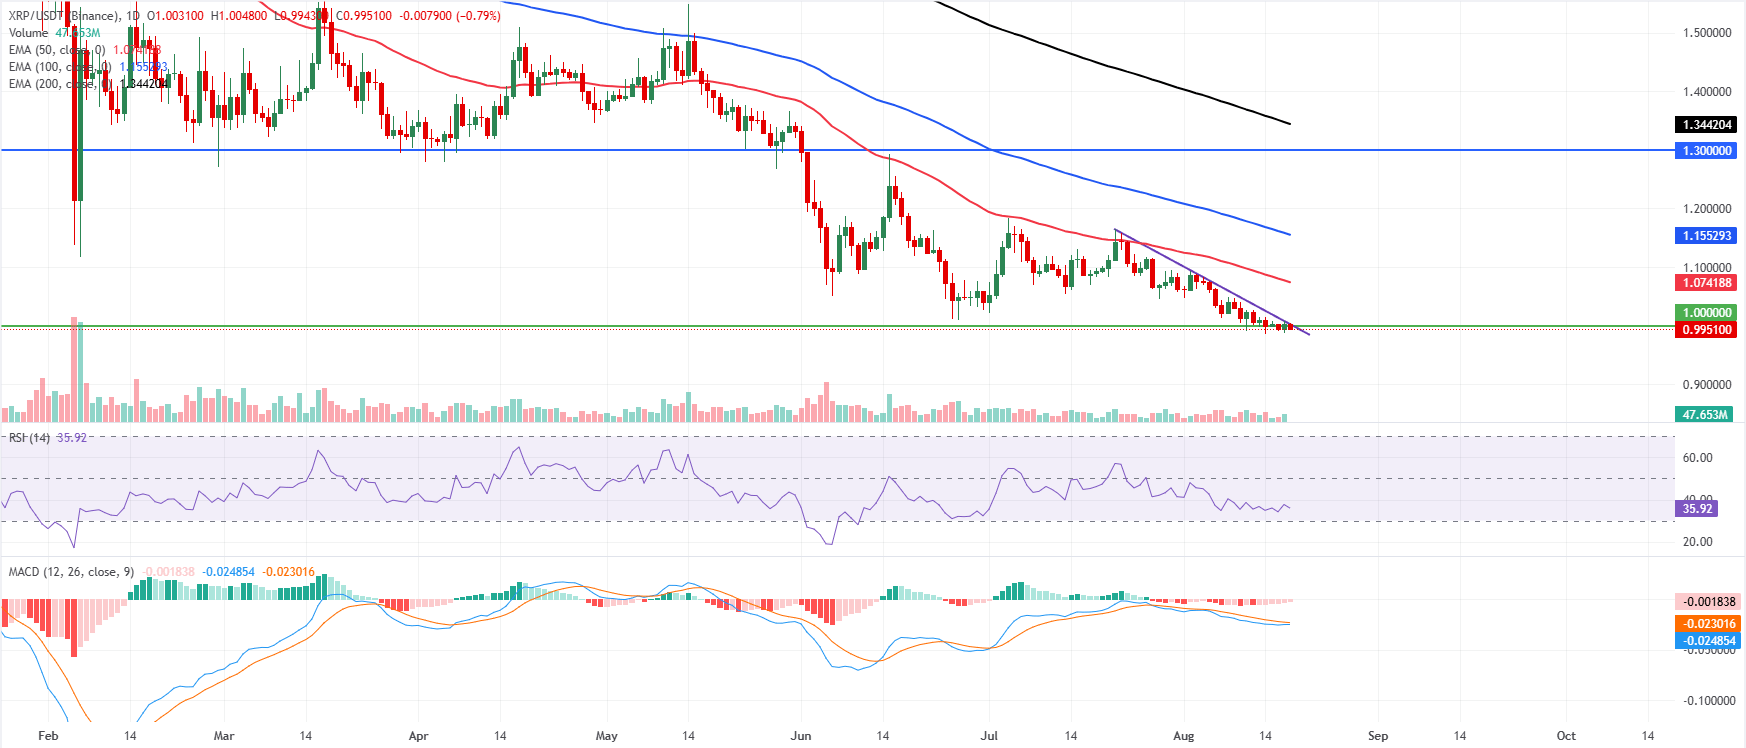
XRP price trades at $0.99 on Tuesday, keeping a bearish near-term tone as it holds below the 50-day Exponential Moving Average (EMA) at $1.07, the 100-day EMA at $1.15 and the 200-day EMA at $1.34. XRP also remains under the broken descending trendline reference at $1.00 and the horizontal barrier at $1.00, underscoring persistent overhead pressure.
The Relative Strength Index (RSI) near 35 stays in weak territory, while the Moving Average Convergence Divergence (MACD) indicator is slightly negative, hinting at lingering downside bias rather than a decisive reversal.
On the topside, immediate resistance is clustered at the psychological $1.00 mark, followed closely by the former trendline break level at $1.00. Above this area, the 50-day EMA at $1.07 is the next hurdle, followed by the 100-day EMA at $1.15 and the horizontal barrier at $1.30, with the 200-day EMA at $1.34 and a higher horizontal line at $1.90 marking more distant caps.
With no clear support levels defined below the current price in the current dataset, any further slide would leave XRP vulnerable to downside price discovery until fresh demand emerges.
XLM technical outlook: Extends correction below key EMAs
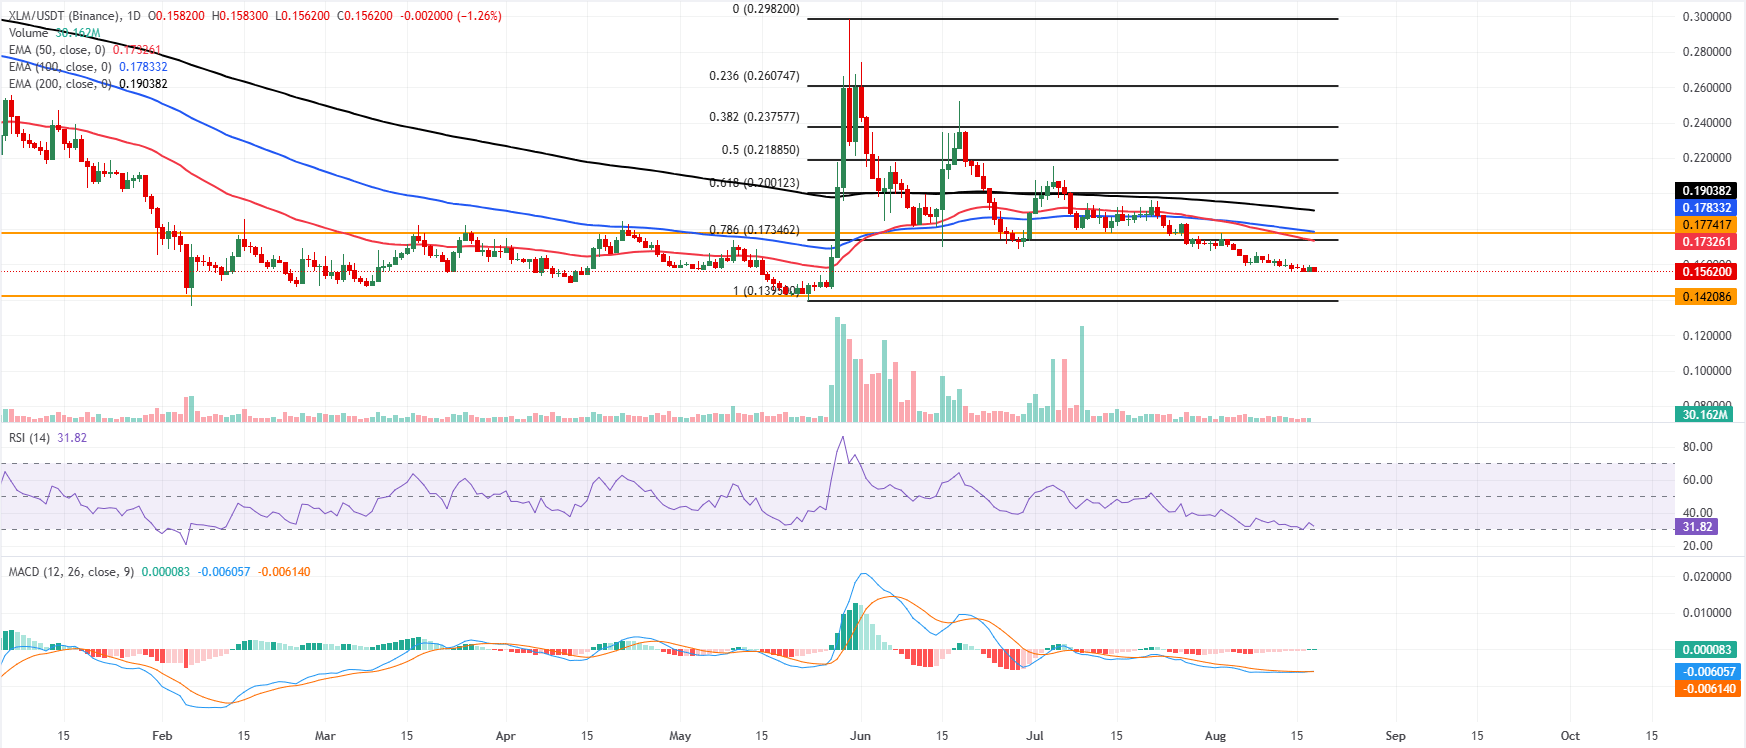
XLM price trades at $0.156 on Tuesday, extending its corrective phase below all major EMAs, which keeps the near-term bias bearish. The 50-day EMA at $0.173, the 100-day EMA at $0.178 and the 200-day EMA at $0.190 all sit overhead as trend-defining resistance, reinforcing a capped tone after the recent slide.
The RSI near 31 hovers close to oversold territory, while the MACD indicator turns marginally positive around the zero line, hinting at fading downside momentum but not yet signaling a clear recovery as long as price holds beneath these clustered averages and Fibonacci retracements.
On the topside, initial resistance aligns around the $0.173 area, where the 50-day EMA converges with the 78.6% Fibonacci retracement, followed by the prior horizontal barrier at $0.177 and the 100-day EMA at $0.178. Higher up, the 200-day EMA at $0.190 precedes the 61.8% Fibonacci retracement at $0.200, with subsequent Fibonacci levels at $0.218, $0.237 and $0.260 capping any medium-term recovery, ahead of the cycle high near $0.298.
On the downside, immediate focus rests on the support band between the horizontal floor at $0.142 and the structural low around $0.139; a decisive break under this zone would likely open the door to a deeper bearish extension despite the already stretched momentum backdrop.
(The technical analysis of this story was written with the help of an AI tool. Know more.)
บทความแนะนำ


