


Bitcoin vs Gold: Markets extend gains amid growing signs of easing US inflation
- Bitcoin bulls eye a bullish shift after reclaiming the 50-day EMA as support.
- Gold holds above $4,000 after pulling back from the weekly high above $4,100.
- US inflation shows signs of cooling following softer-than-expected CPI and PPI data.
Bitcoin (BTC) edges higher on Wednesday, while Gold (XAU) holds above the critical psychological support at $4,000. Signs of easing inflation in the world’s largest economy appear to be boosting risk-on sentiment as attention shifts from geopolitical tensions in the Middle East.
US inflation cools, lifting market outlook
The United States (US) Producer Price Index (PPI) data for June released on Wednesday showed that price pressure in the Greenback's economy are cooling. The report reinforced the trend seen in Tuesday’s Consumer Price Index (CPI) figures, fueling optimism across global markets.
Headline PPI, a key gauge of future consumer inflation, rose by 5.5% in June, a lower pace than the market expectation of 6.2%, easing market concerns over a persistent inflation wave and supporting risk assets.
Core PPI, excluding food and energy prices, increased by 4.7% YoY, below the expected 5.2%.
Meanwhile, the Bureau of Labor Statistics (BLS) CPI report showed that inflation fell by 0.4% in June on a seasonally-adjusted basis, marking the sharpest monthly decrease since April 2020.
This pullback brought the annual headline inflation rate down to 3.5% from 4.2% in May. Core inflation, which excludes the more volatile food and energy prices, remained flat MoM, while the annual rate fell to 2.6% from 2.9% in May.
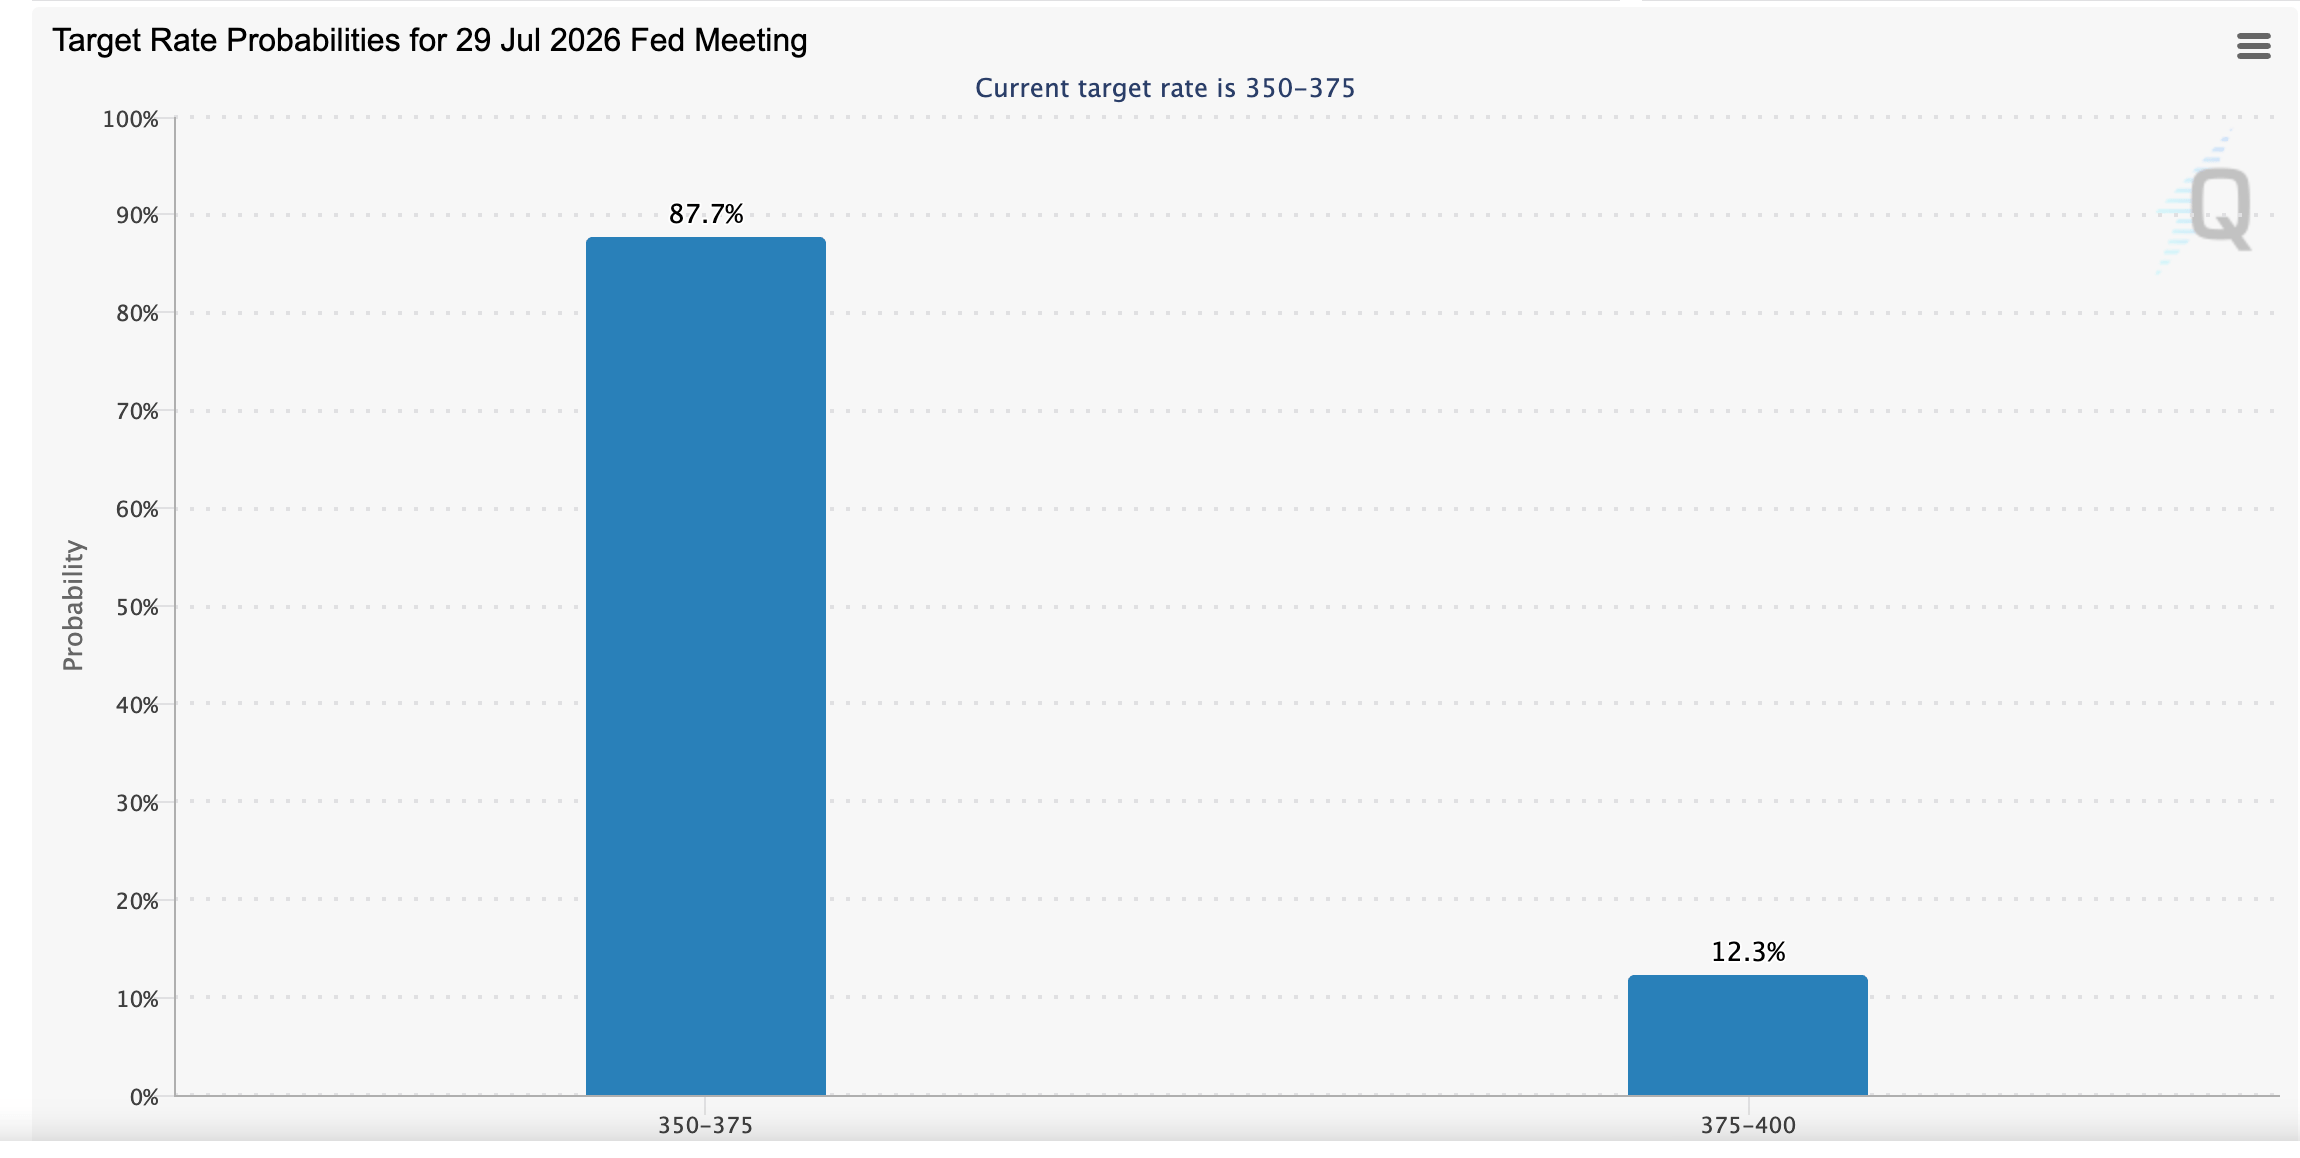
Notably, market sentiment improved slightly, with investors currently pricing in an 88% probability that the Federal Reserve (US) will leave interest rates unchanged in the 3.50%-3.75% range at its next review cycle on July 29.
Price analysis: Bitcoin expands bullish scope
Bitcoin grinds higher above $65,000, holding above the 50-day Exponential Moving Average (EMA) at $65,174. The Parabolic SAR at $61,824 and the reclaimed descending trendline break near $61,595 now act as underlying demand, even as a moderately firm Relative Strength Index (RSI) around 57 on the daily chart and a bullish Moving Average Convergence Divergence (MACD) reading hint that selling pressure is losing momentum.
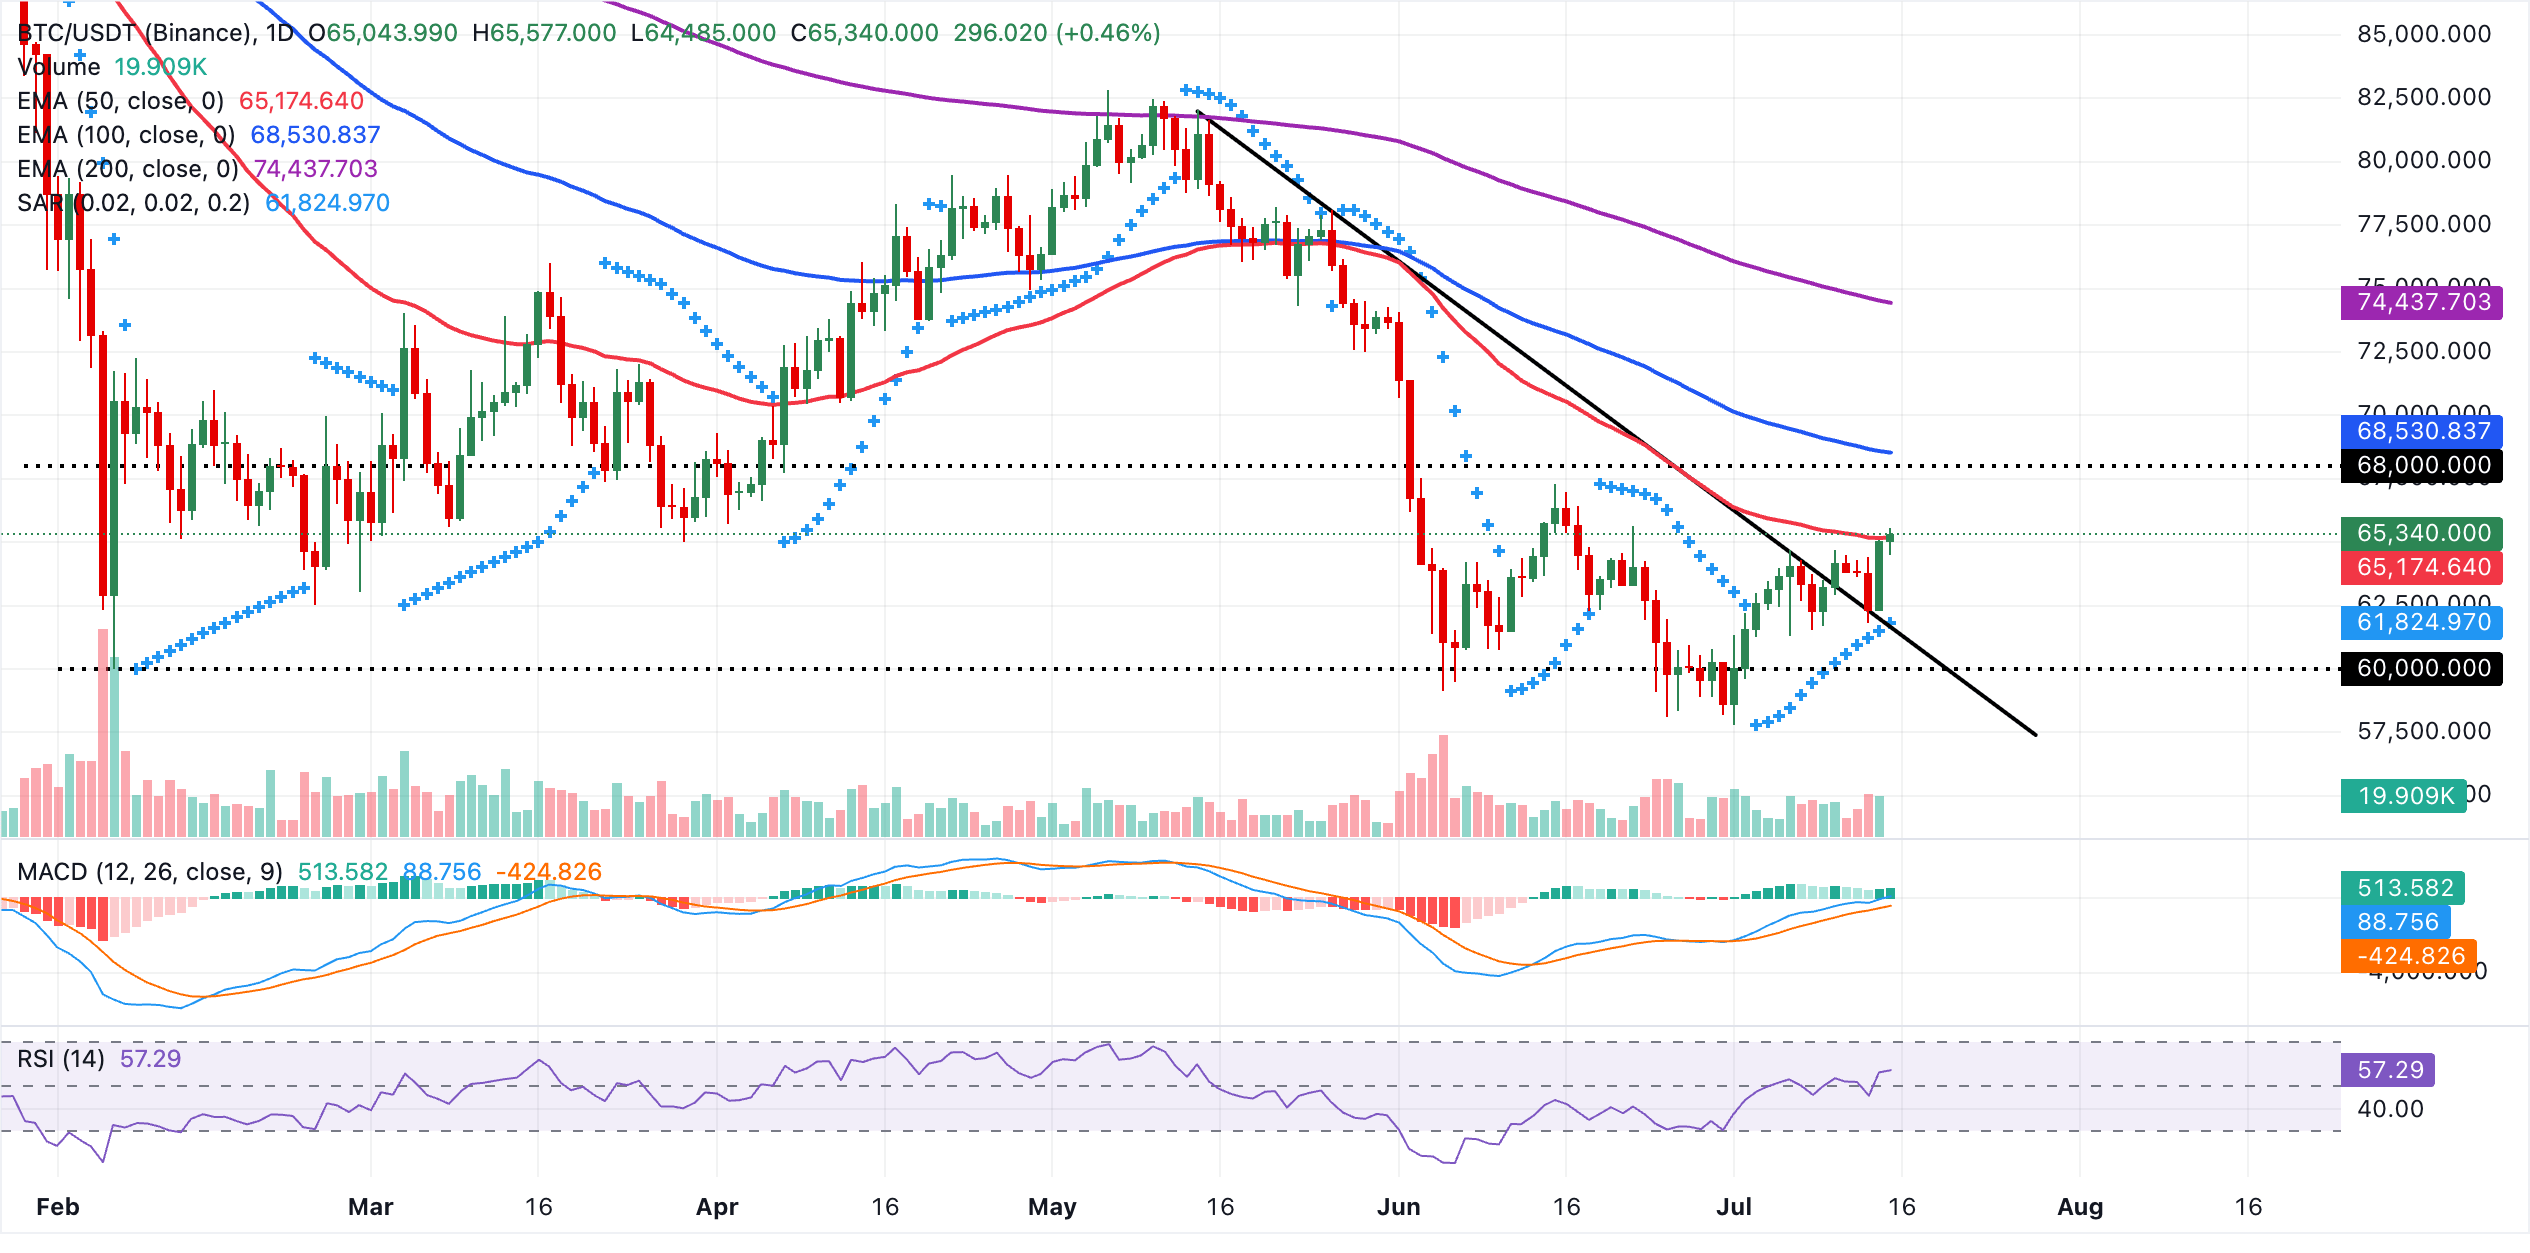
Immediate resistance aligns with the 100-day EMA at $68,531 and then the 200-day EMA near $74,437, forming a layered barrier that bulls must clear to restore a sustained uptrend. On the downside, initial support is seen at the Parabolic SAR level near $61,825, with the descending trendline break around $61,595 providing a secondary floor. A daily close back below this zone would likely reopen the path toward deeper retracements despite the current improvement in momentum indicators.
Gold outlook: Bulls defend key support
Gold is currently trading at $4,039, having recently posted a weekly high just above $4,100. Although this support level is holding, the metal continues to face pronounced bearish pressure, with the 50-day, 100-day, and 200-day EMAs tightly clustered between $4,280 and $4,404.
The Parabolic SAR at $4,202 sits above spot, reinforcing the notion of a capped market. Momentum is stabilizing rather than bullish, with the RSI hovering near 41 on the daily chart and the MACD still positive but easing, which suggests only a tentative recovery attempt within a broader corrective phase.
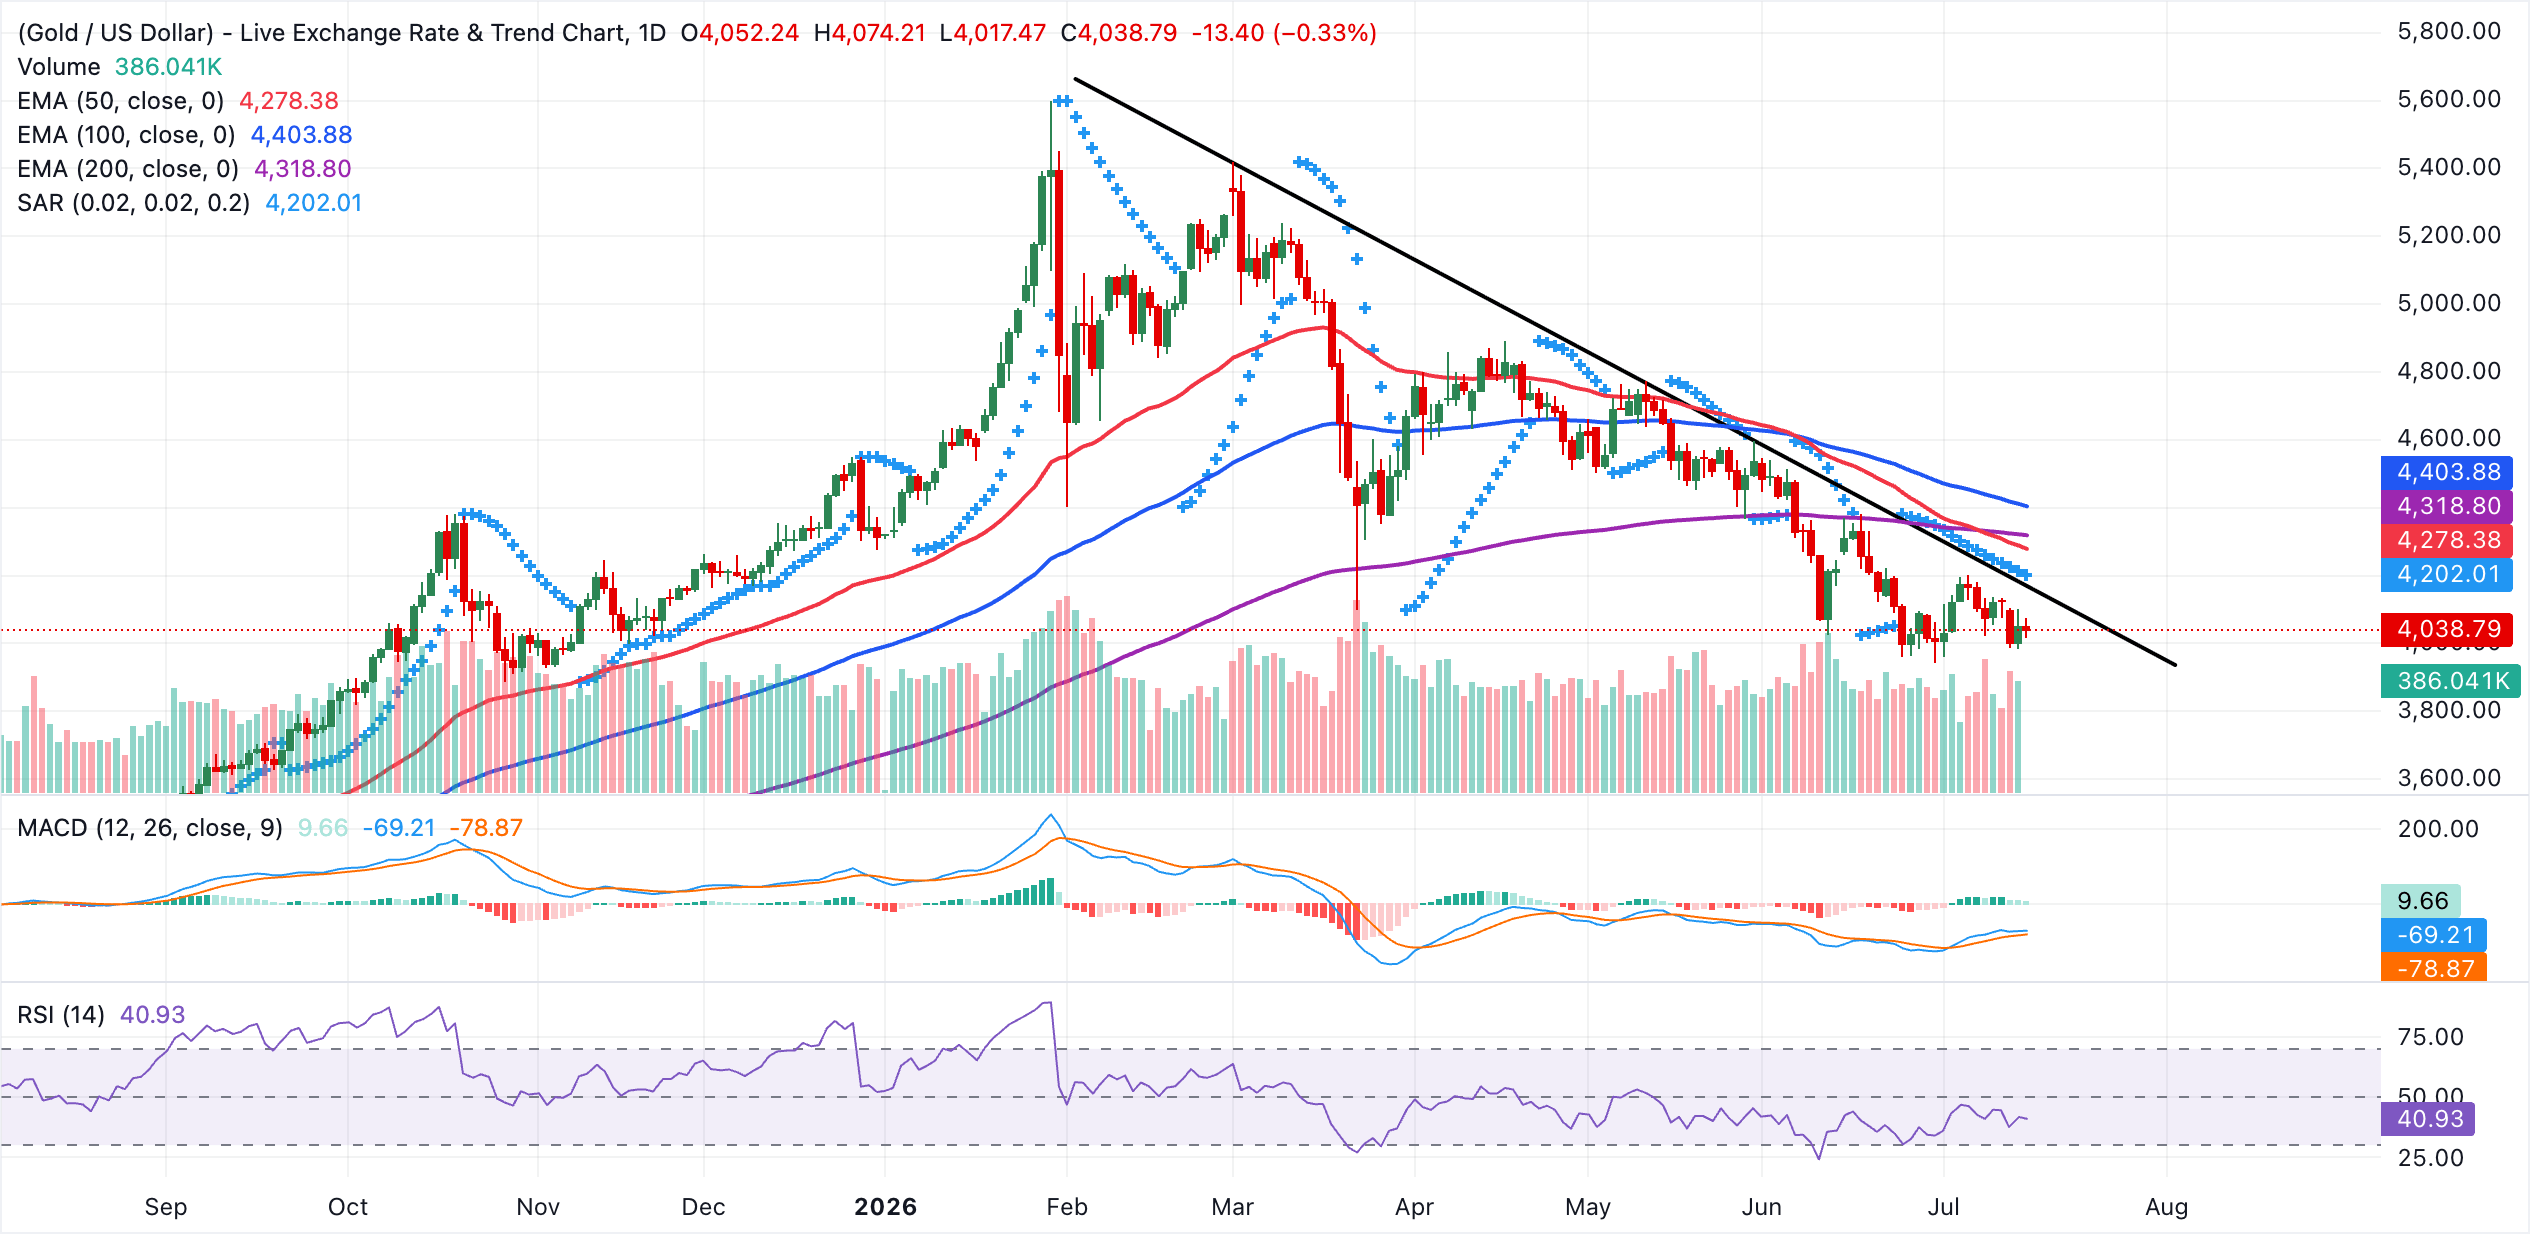
Initial resistance is aligned at the descending trendline break around $4,103, followed by the Parabolic SAR barrier at $4,202. Further up, the 50-day EMA at $4,278, the 200-day EMA at $4,318 and the 100-day EMA at $4,404 form a dense supply zone that would need to be reclaimed to alleviate the current bearish bias. Looking down, the absence of nearby technical supports on the indicator map leaves XAU/USD vulnerable to fresh weakness, with traders likely to look to prior price lows and round numbers below $4,000 as potential areas where buying interest might re-emerge.
(The technical analysis of this story was written with the help of an AI tool. Know more.)
Bitcoin, altcoins, stablecoins FAQs
Bitcoin is the largest cryptocurrency by market capitalization, a virtual currency designed to serve as money. This form of payment cannot be controlled by any one person, group, or entity, which eliminates the need for third-party participation during financial transactions.
Altcoins are any cryptocurrency apart from Bitcoin, but some also regard Ethereum as a non-altcoin because it is from these two cryptocurrencies that forking happens. If this is true, then Litecoin is the first altcoin, forked from the Bitcoin protocol and, therefore, an “improved” version of it.
Stablecoins are cryptocurrencies designed to have a stable price, with their value backed by a reserve of the asset it represents. To achieve this, the value of any one stablecoin is pegged to a commodity or financial instrument, such as the US Dollar (USD), with its supply regulated by an algorithm or demand. The main goal of stablecoins is to provide an on/off-ramp for investors willing to trade and invest in cryptocurrencies. Stablecoins also allow investors to store value since cryptocurrencies, in general, are subject to volatility.
Bitcoin dominance is the ratio of Bitcoin's market capitalization to the total market capitalization of all cryptocurrencies combined. It provides a clear picture of Bitcoin’s interest among investors. A high BTC dominance typically happens before and during a bull run, in which investors resort to investing in relatively stable and high market capitalization cryptocurrency like Bitcoin. A drop in BTC dominance usually means that investors are moving their capital and/or profits to altcoins in a quest for higher returns, which usually triggers an explosion of altcoin rallies.
บทความแนะนำ


