


Bittensor and Near Protocol Outlook: AI-linked tokens face deeper sell-off
- AI-linked crypto tokens extend losses amid broader market weakness.
- Bittensor drops 25% from its June highs, trading around $217 on Tuesday, weighed down by a cooling derivatives market.
- Near Protocol slides below the pivotal $2.00 level as the sell-off extends for a third consecutive day.
The cryptocurrency market trades amid increasing sell-side pressure on Tuesday, reflecting a broader deterioration in sentiment and appetite for risk assets. Artificial Intelligence (AI)-linked tokens such as Bittensor (TAO) and Near Protocol (NEAR) exhibit both fundamental and technical weaknesses, trading at $217 and $1.99, respectively.
The ongoing crypto market downturn, highlighted by Bitcoin (BTC) retesting the $62,000 support level, appears primarily driven by persistent geopolitical uncertainty. Investors remain cautious as the United States (US) and Iran issued conflicting statements regarding the peace framework reached at last weekend’s negotiations in Switzerland.
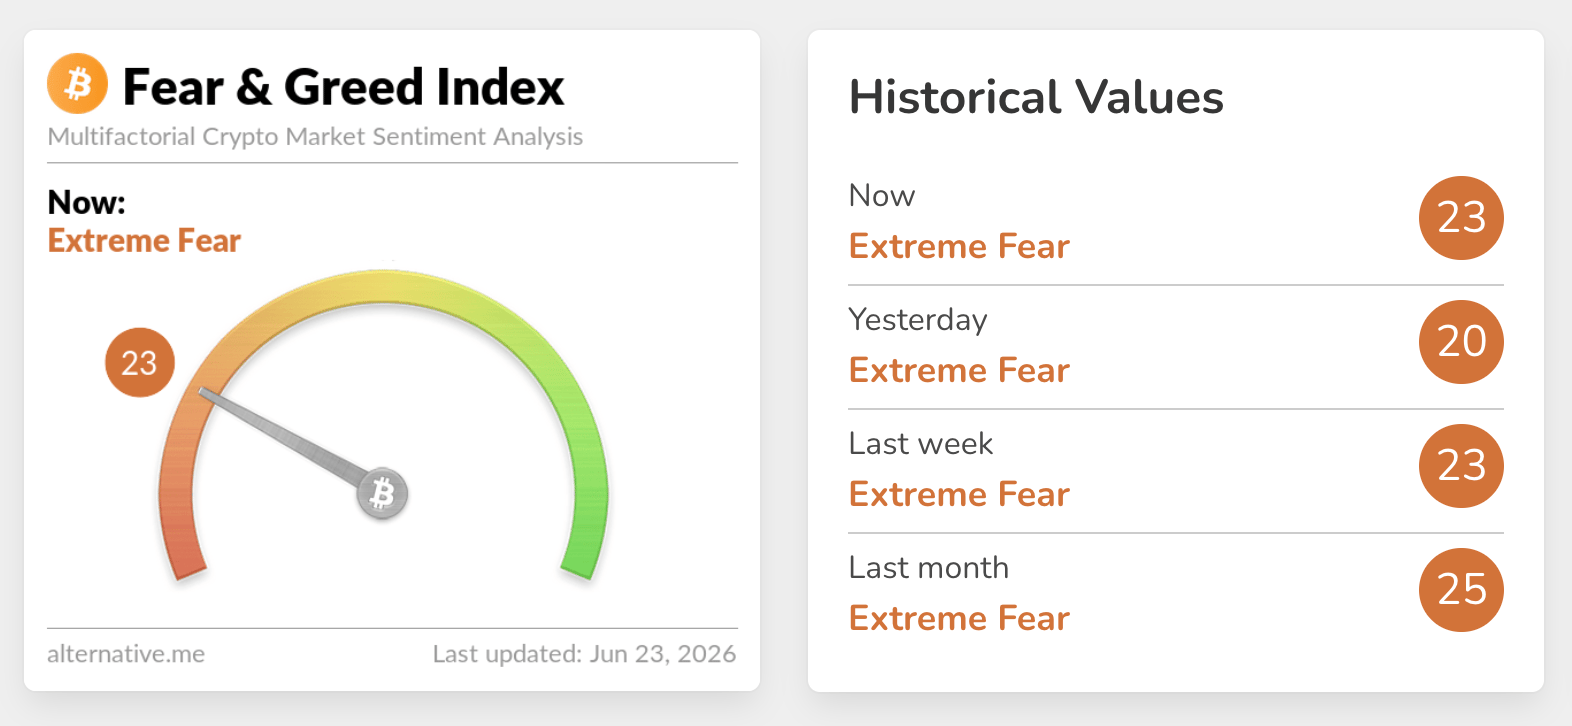
Sentiment in the wider crypto market remains in Extreme Fear territory, as evidenced by the Fear & Greed Index, which climbed only marginally to 23 on Tuesday, up from 20 the day before. This subdued sentiment indicates that appetite for risk assets is significantly low, leaving prices vulnerable to limited liquidity, low demand and lack of a follow-through tailwind.
Bittensor remains under pressure amid lingering capital outflows
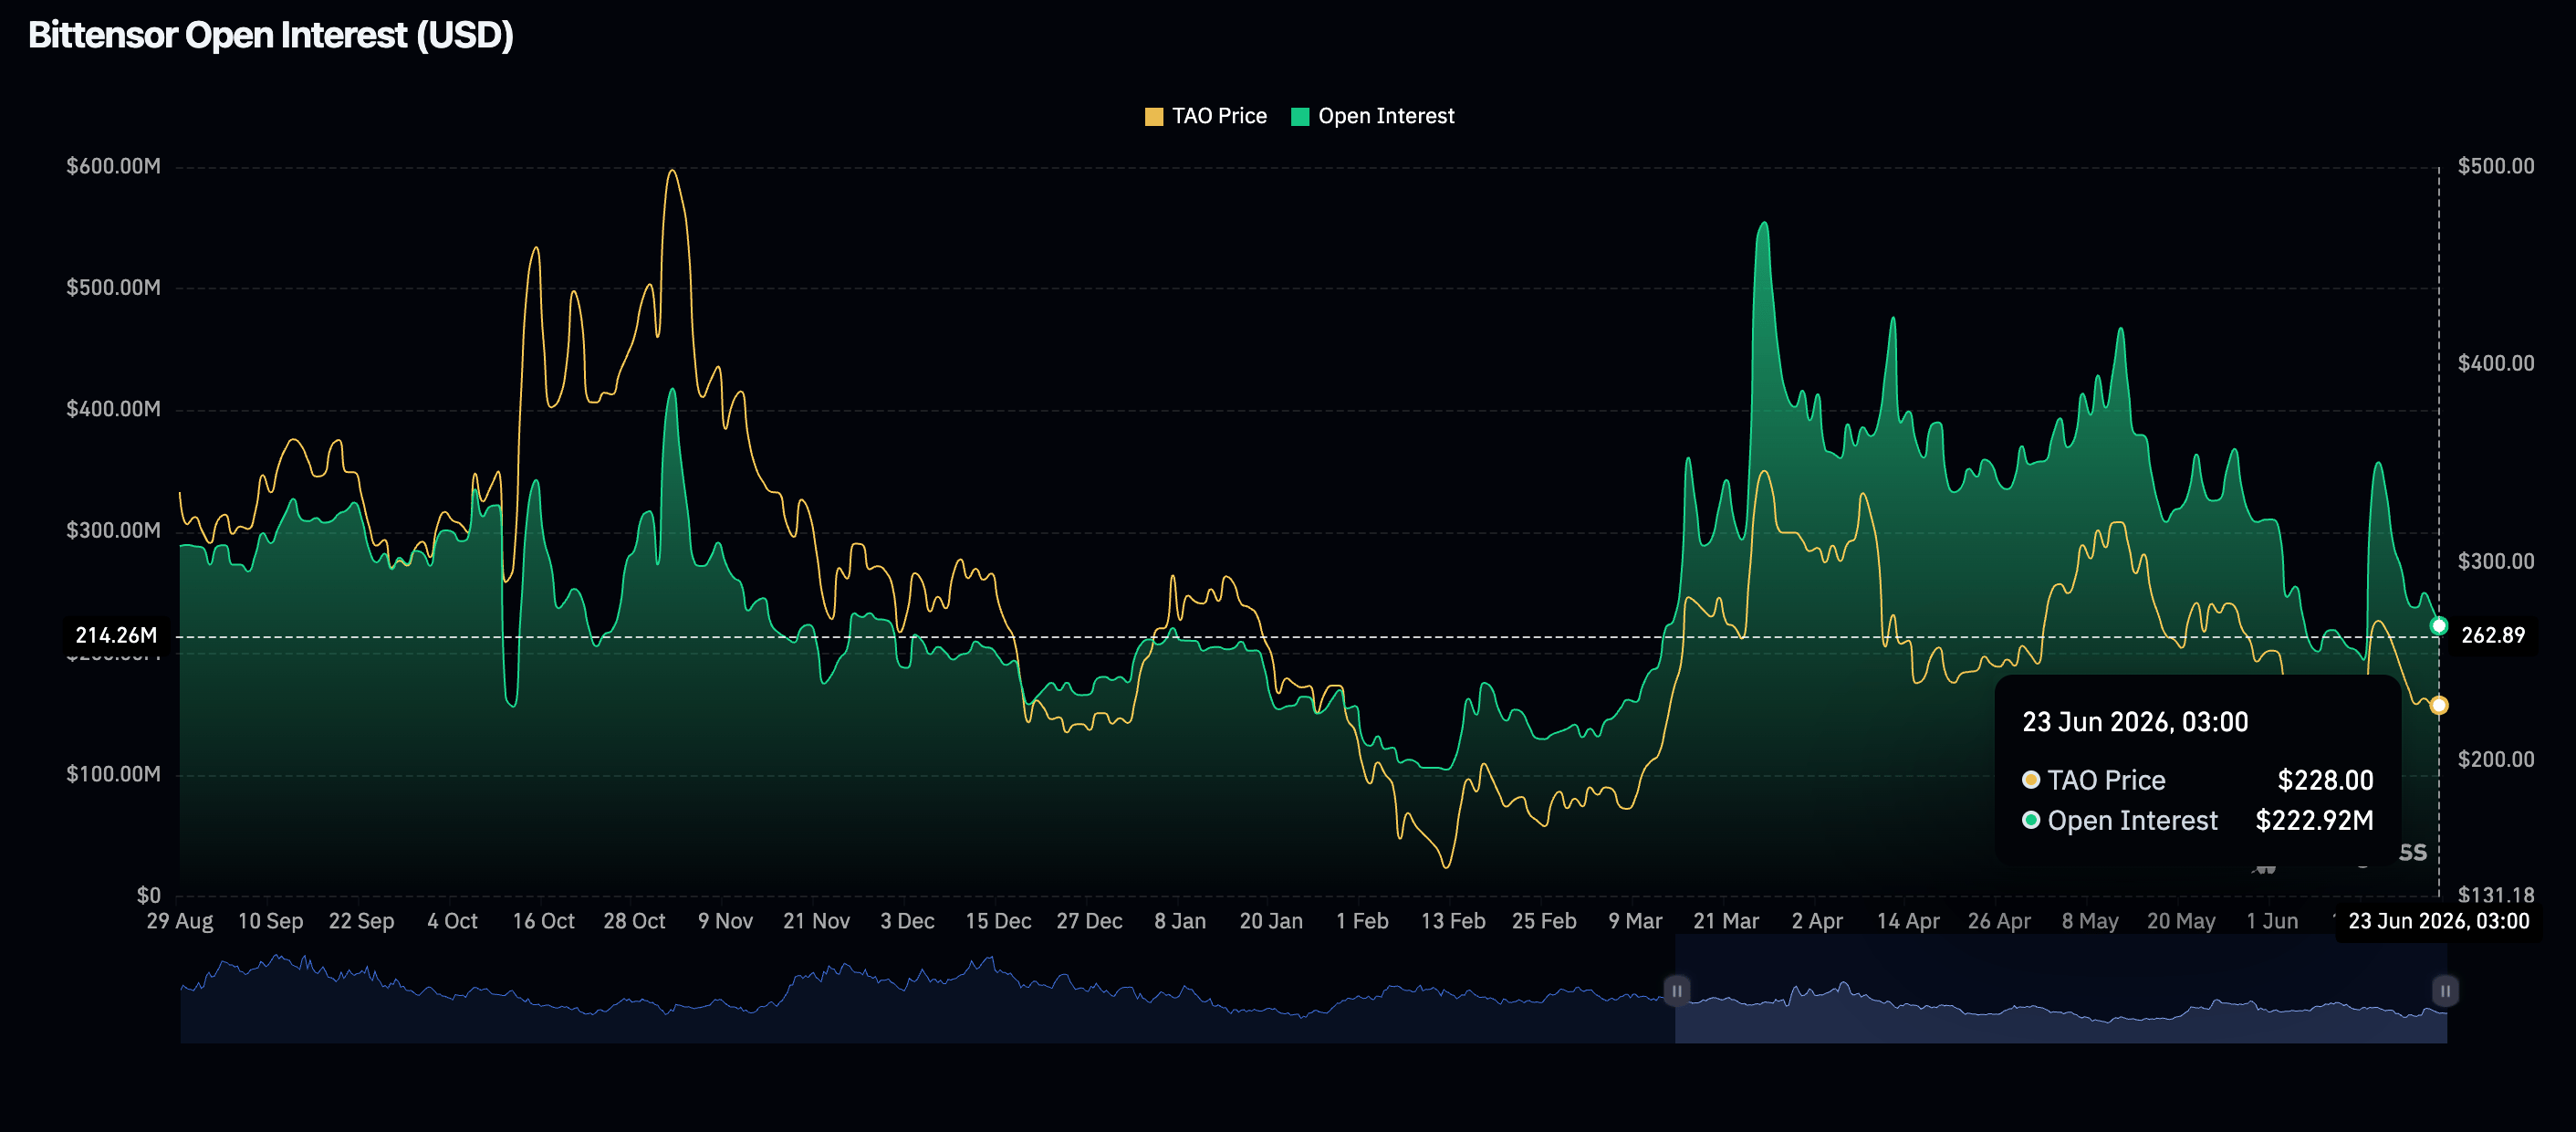
Retail participation in Bittensor continues to wane, with Futures Open Interest (OI) averaging $223 million on Tuesday, down from $239 million the previous day. While OI briefly surged to $357 million on June 15 amid heightened derivatives activity, the subsequent unwinding of long positions underscores a prevailing lack of confidence in Bittensor’s capacity to maintain upward momentum.
Bittensor trades around $217, maintaining a bearish near-term tone as price holds beneath a dense cluster of Exponential Moving Averages (EMAs). The 50-day EMA at $247, the 100-day EMA at $253 and the 200-day EMA near $267 all sit overhead as dynamic resistance, reinforcing the broader downtrend marked by the descending resistance trend line projecting toward the $291 area.
Momentum appears mixed with the Moving Average Convergence Divergence (MACD) histogram contracting just above the zero line on the daily chart, hinting at fading downside pressure. On the other hand, the Relative Strength Index (RSI) around 41 on the same chart reflects subdued buying interest rather than a convincing bullish reversal.
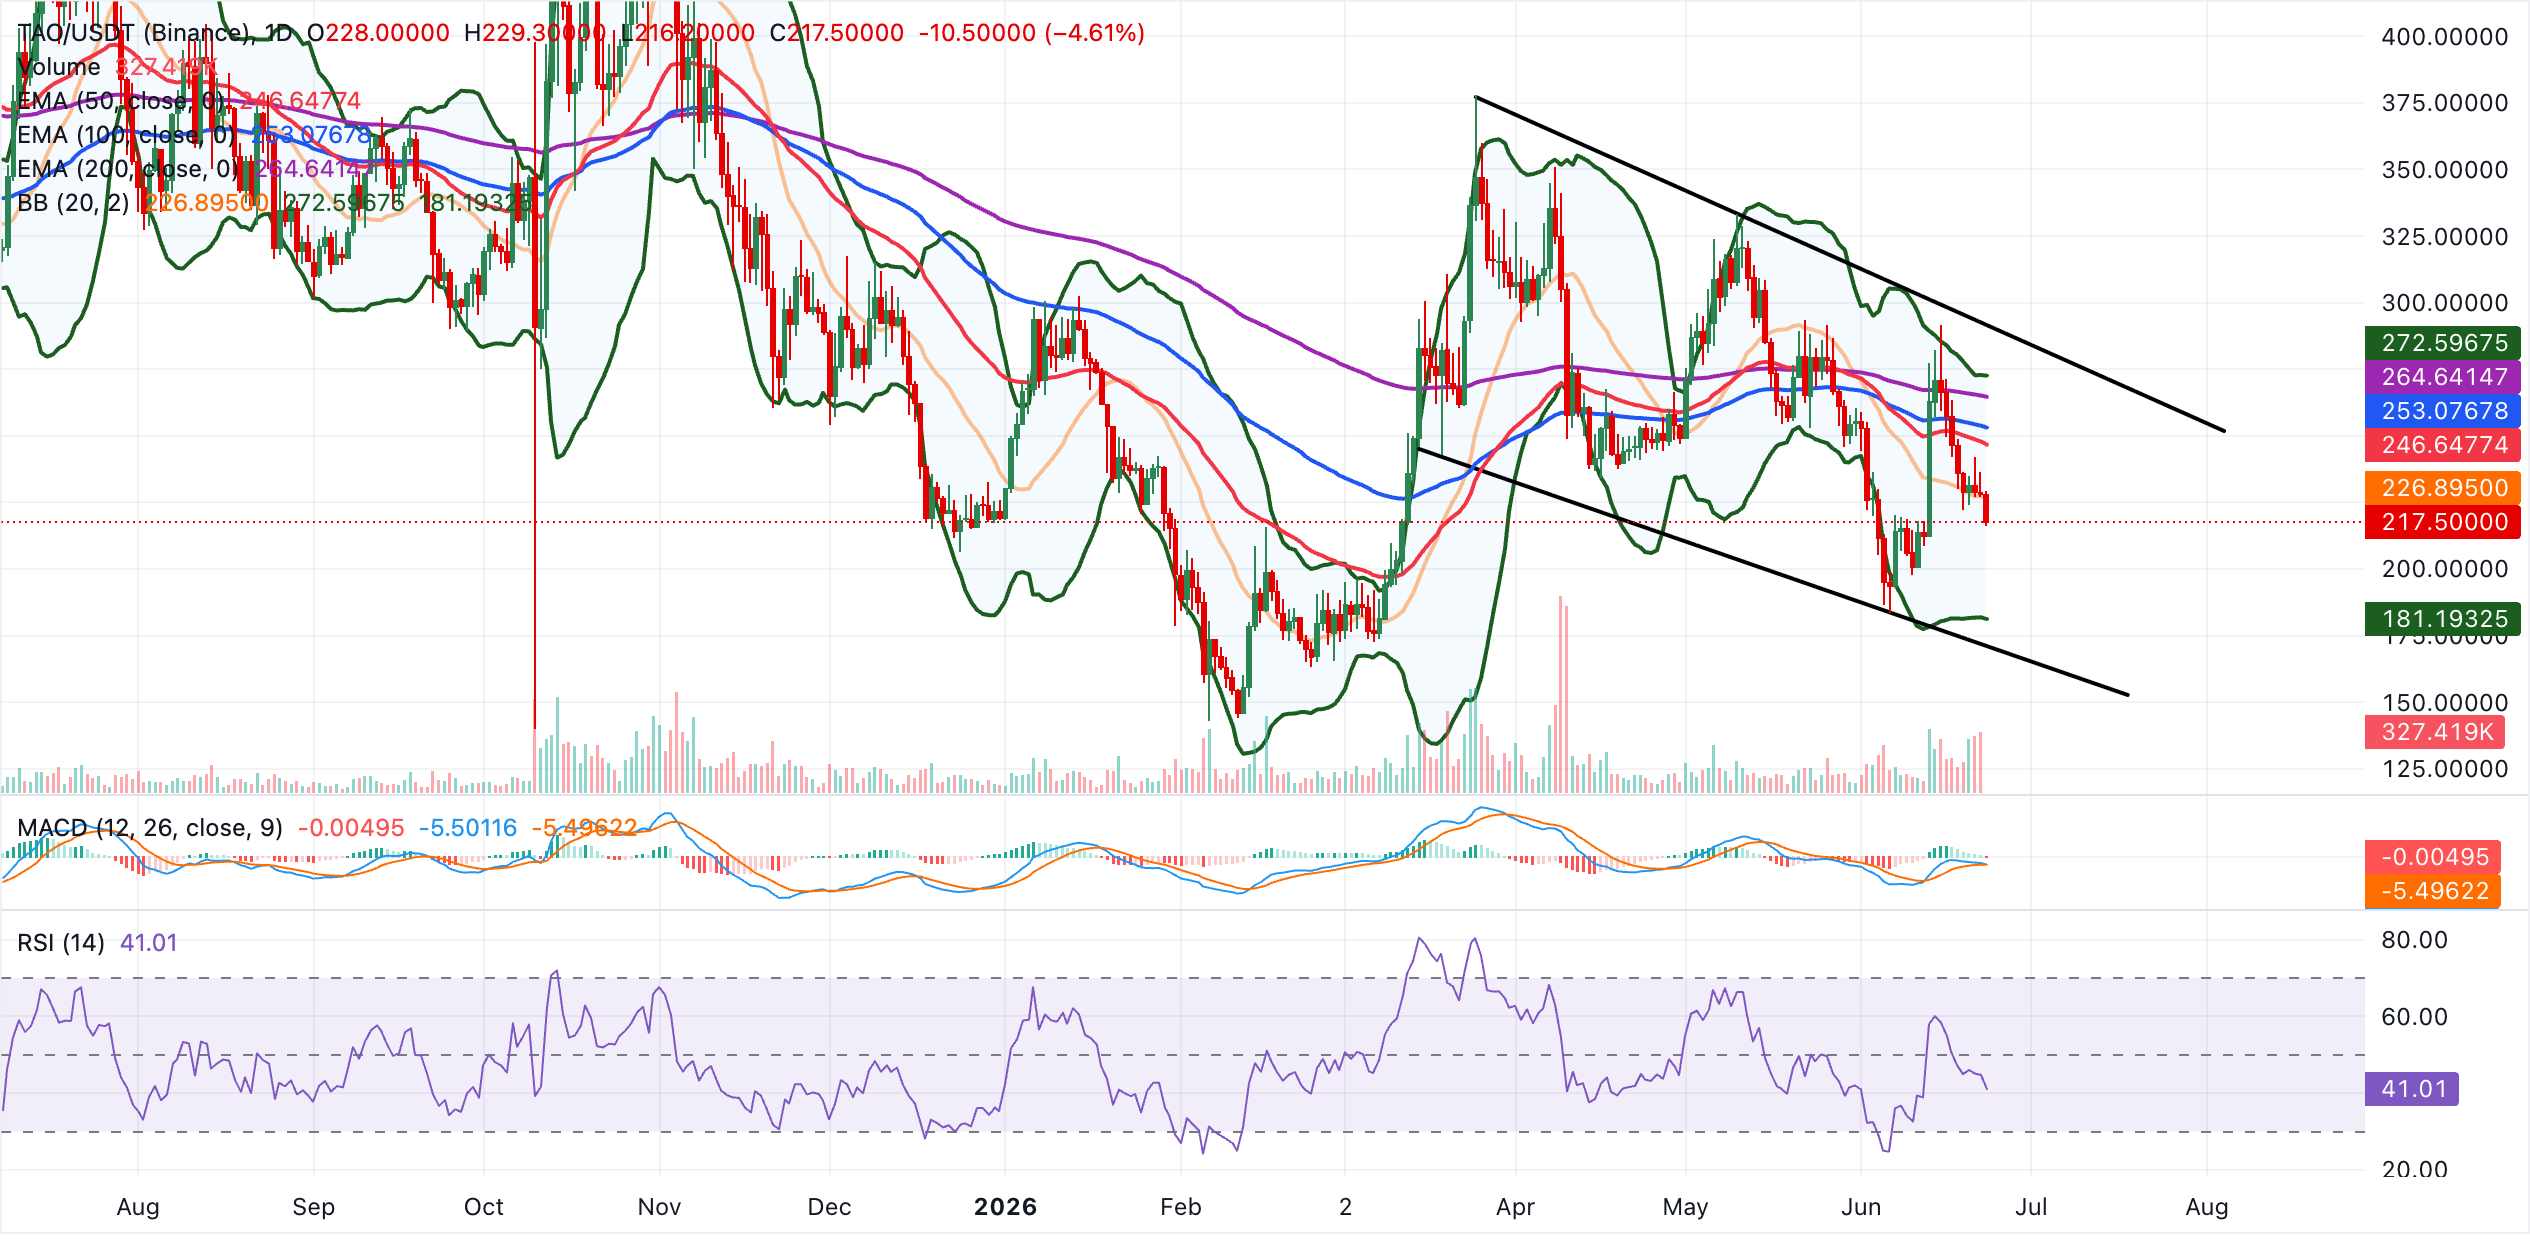
Initial resistance is aligned with the Bollinger Bands’ center line at roughly $227, with further hurdles at the 50-day EMA near $247 and the 100-day EMA at $253. A sustained break above the 200-day EMA around $265 would be needed to challenge the broader downtrend and re-expose the descending trendline region near $291. Conversely, support is anticipated at the $200 psychological level, followed by the lower Bollinger Band, currently near $181, which mark the next meaningful demand areas if bearish pressure intensifies.
Near Protocol drawdown continues amid waning retail demand
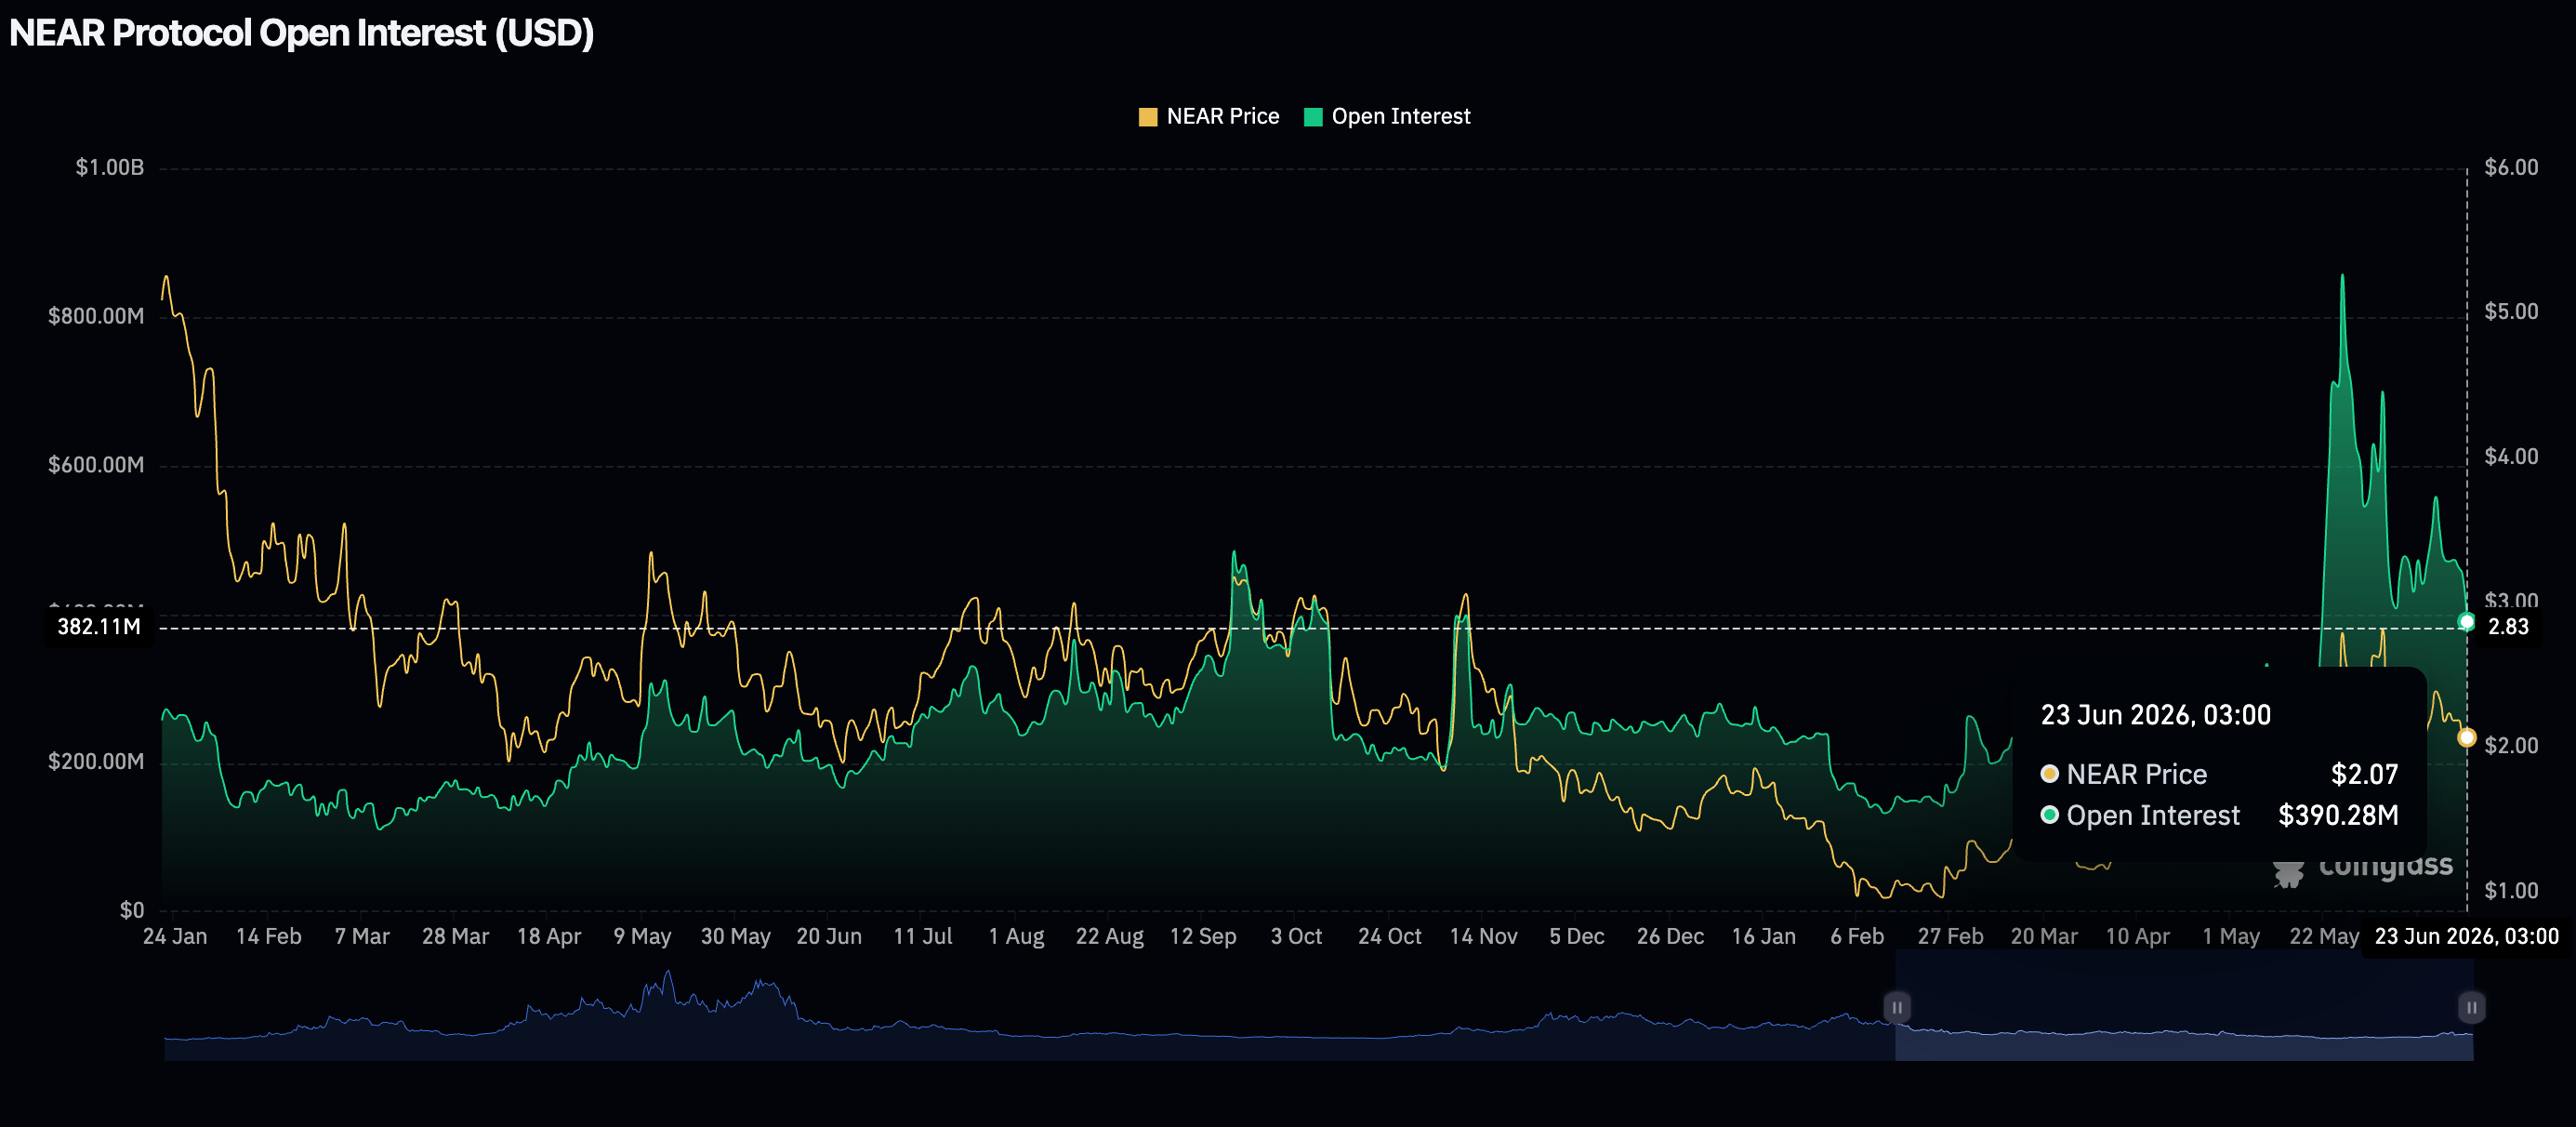
Capital outflows from Near Protocol derivatives remain persistent, as reflected in the perpetual futures OI falling to $390 million on Tuesday from nearly $453 million the day before. CoinGlass data show a brief surge in OI to $558 million on June 16, followed by a decline that hints at diminishing risk appetite.
NEAR trades around $1.99, consolidating in the middle of its downward-sloping channel and facing a mildly bearish near‑term tone as it sits just under the 50‑day EMA at $2.01. The spot price remains above the 100‑day and 200‑day EMAs at $1.82 and $1.79, respectively, which suggests an underlying medium‑term base.
Nevertheless, the negative MACD histogram on the daily chart and an RSI around 45 hint that upside momentum is fading. Near Protocol is also capped below the Parabolic SAR at $2.56.
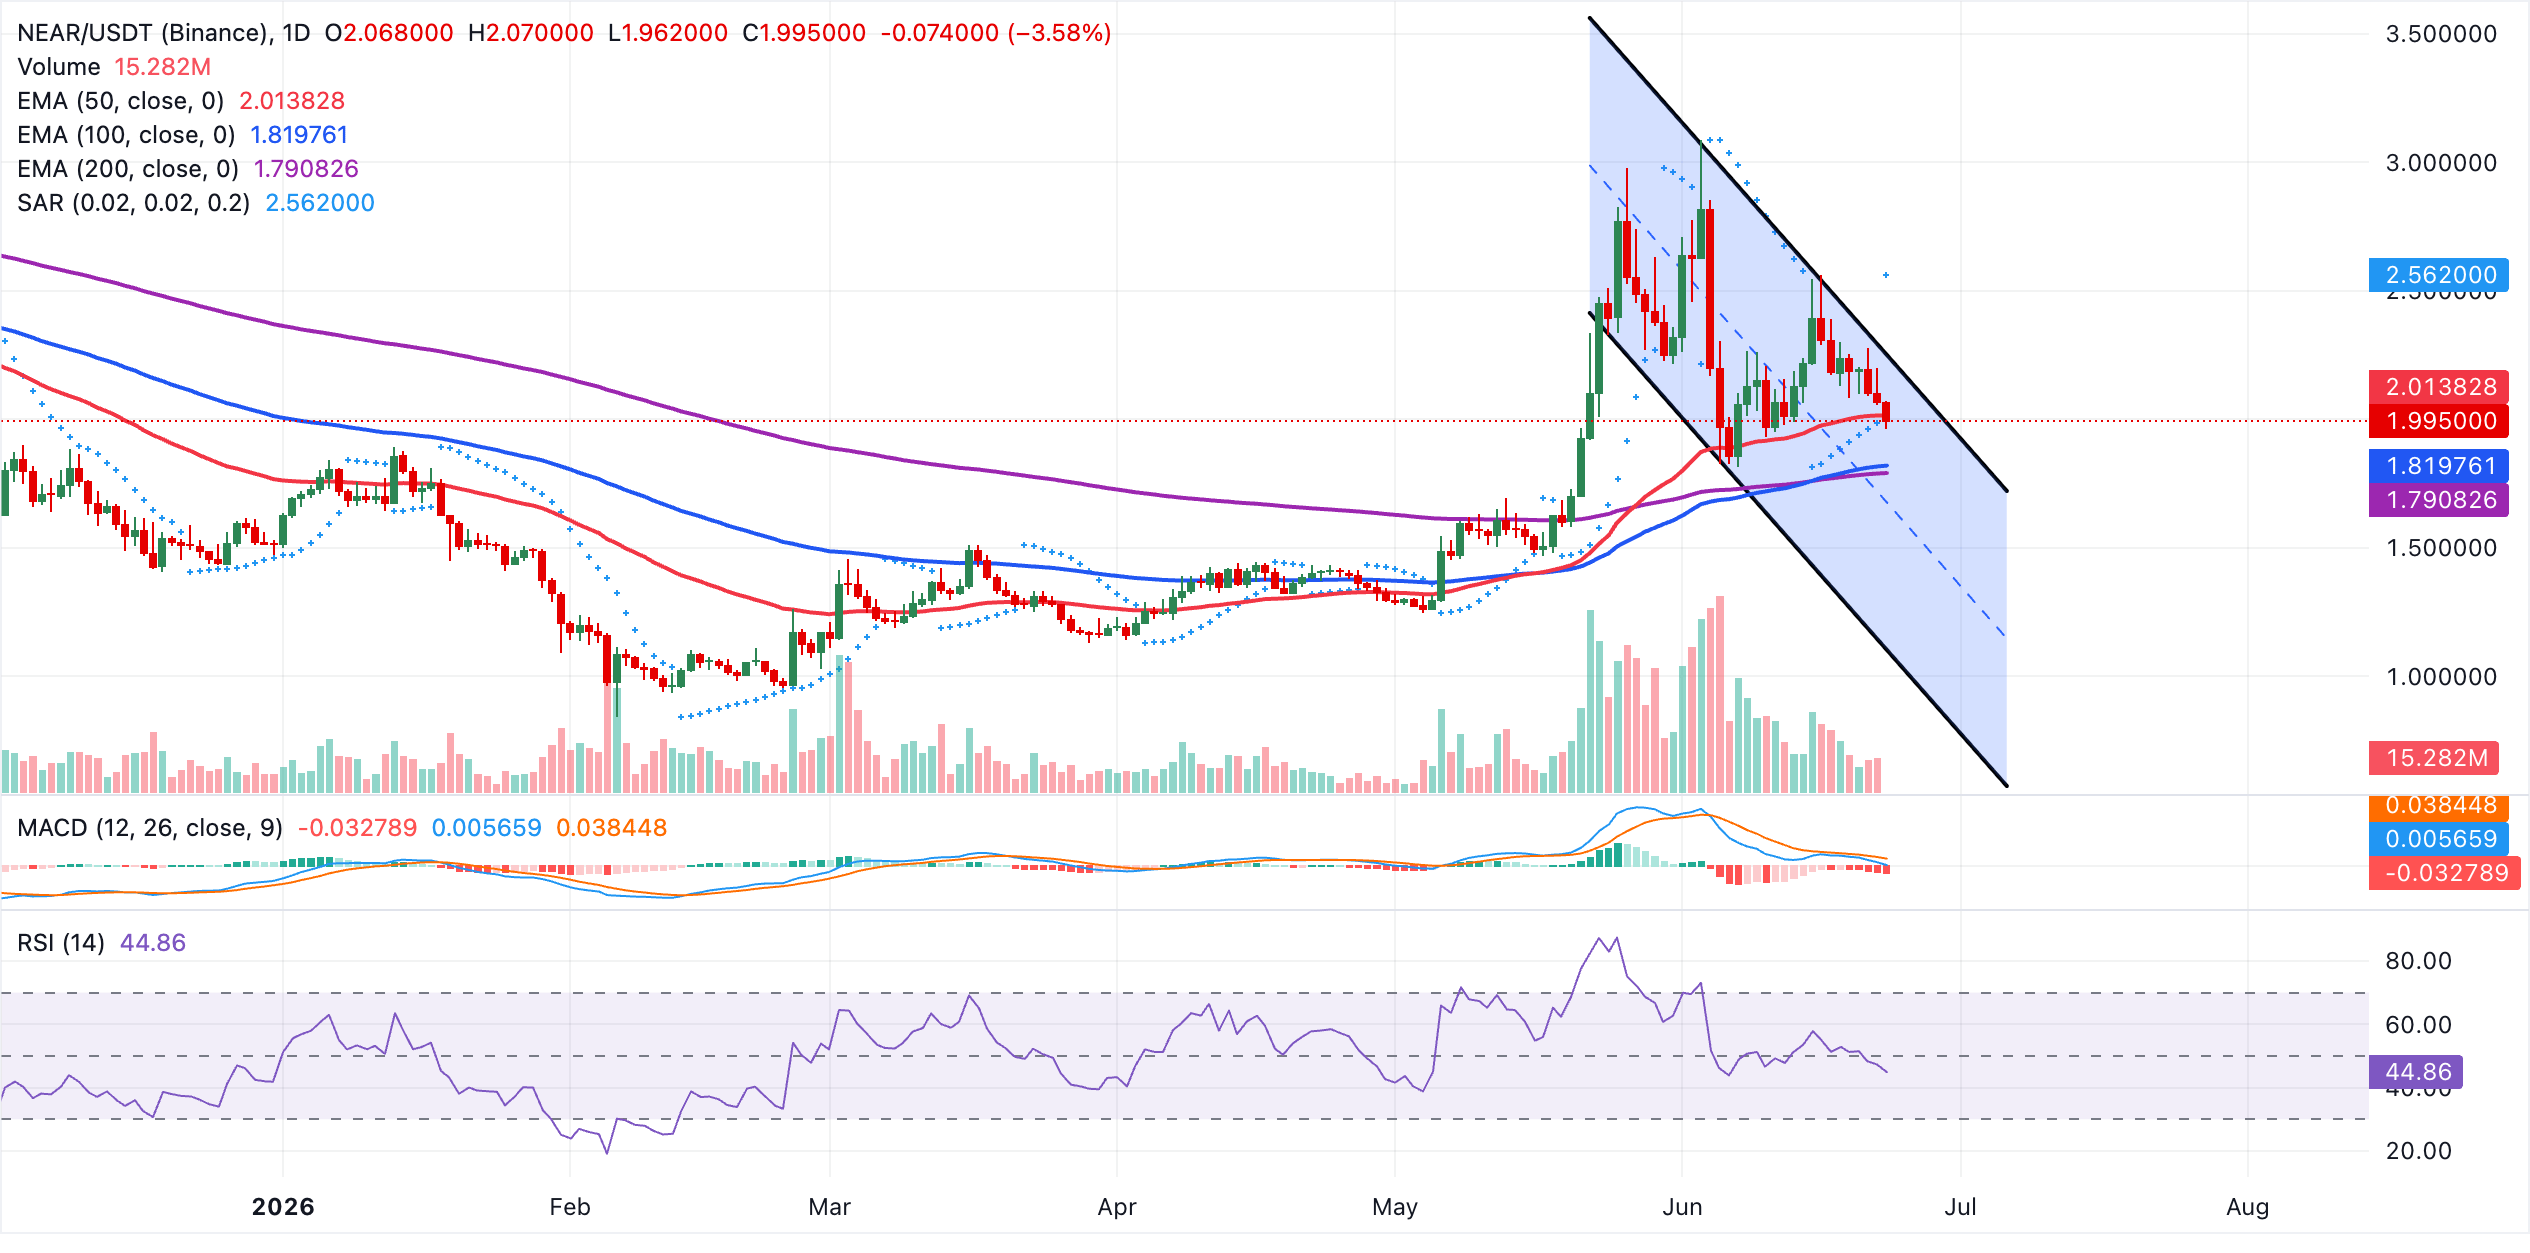
On the topside, initial resistance is highlighted by the 50‑day EMA at $2.01. A daily close above this level would expose the upper boundary of the descending channel near $2.23, ahead of a stronger barrier at the latest Parabolic SAR reading around $2.56. Looking down, immediate demand is seen at the 100‑day EMA at $1.82, followed by the 200‑day EMA at $1.79. A decisive break below this support cluster could open the way toward the channel floor down at $1.08.
(The technical analysis of this story was written with the help of an AI tool.)
Open Interest, funding rate FAQs
Higher Open Interest is associated with higher liquidity and new capital inflow to the market. This is considered the equivalent of increase in efficiency and the ongoing trend continues. When Open Interest decreases, it is considered a sign of liquidation in the market, investors are leaving and the overall demand for an asset is on a decline, fueling a bearish sentiment among investors.
Funding fees bridge the difference between spot prices and prices of futures contracts of an asset by increasing liquidation risks faced by traders. A consistently high and positive funding rate implies there is a bullish sentiment among market participants and there is an expectation of a price hike. A consistently negative funding rate for an asset implies a bearish sentiment, indicating that traders expect the cryptocurrency’s price to fall and a bearish trend reversal is likely to occur.
บทความแนะนำ


