Will Celestia price’s bounce trigger a 50% rally for TIA bulls?

แหล่งที่มา Fxstreet
  • Celestia price has been in an overall bearish trend, trading within a descending channel pattern.
  • With TIA bouncing off strong support at $8.40, buyer momentum could see the altcoin rise 50% past $14.70 blockade.
  • A break and close below $7.56 would produce a lower low, negative the bullish thesis.

Celestia (TIA) price, like the broader cryptocurrency market, is trading with a bearish bias. However, for TIA, the altcoin has missed out on the recent rally that saw the Bitcoin (BTC) price ascend past the $70,000 psychological level. The dip in the TIA price could be an opportunity in disguise depending on how the bulls play their hand.

Also Read: Celestia price could dip before TIA rallies 40%

Celestia price could rally 50%

Celestia price has been in an overall bearish trend, trading within a descending channel pattern since early February. The price action has been broadly characterized by lower highs and lower lows.

After a successful bounce above the $8.40 support, the Celestia price could be poised for a rally. If this support holds, TIA price could shatter resistance due to the midline of the channel, potentially extending to the $14.70 roadblock. This would constitute a 50% climb above current levels.

Long positions are encouraged once the Celestia price successfully breaks and closes above the midline of the descending parallel channel. A breakout above the $14.70 resistance is needed for the bulls to take over.

If Celestia price successfully breaks out above $14.70, this could lead to a move towards the $20.80 resistance level.

The Relative Strength Index (RSI) is close to slipping below 30, suggesting that TIA could soon be oversold, precipitating a pullback. Hence, TIA is at a good point to register a bold move north. All it needs is the go sign from Bitcoin price or renewed enthusiasm in the market.

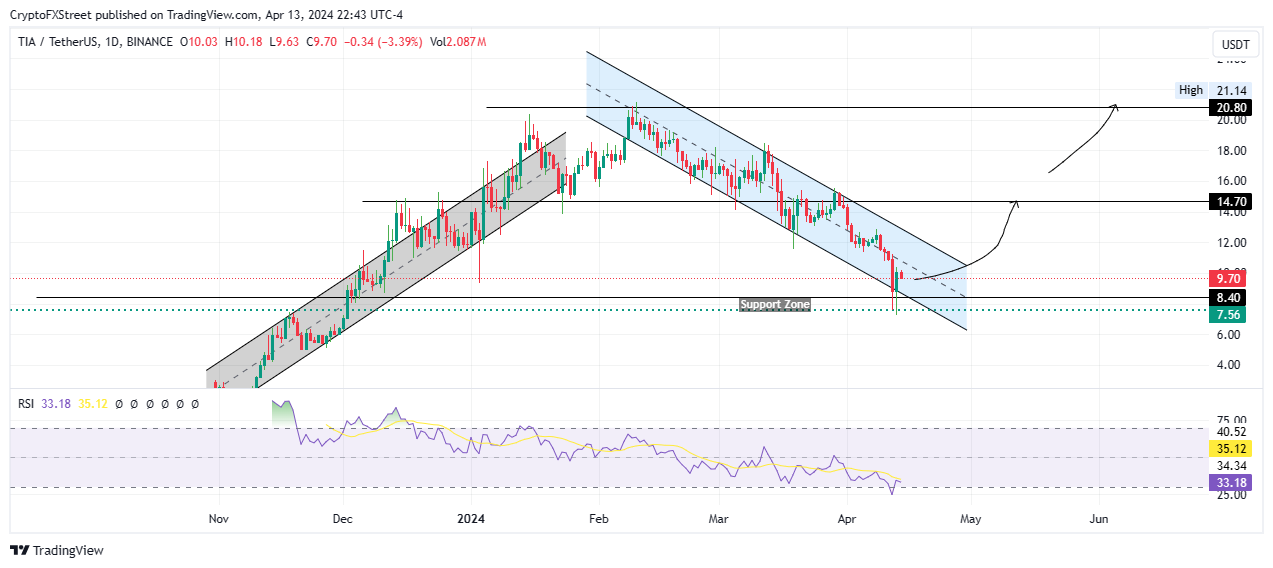
TIA/USDT 1-day chart

On the other hand, if profit booking continues, the Celestia price could drop to the $8.40 support. A slip below this level would send TIA price to the support zone right underneath. If the bears haul the Celestia price to break below $7.56, it would produce a lower low. This would invalidate the bullish thesis.

ข้อจำกัดความรับผิดชอบ: เพื่อการอ้างอิงเท่านั้น ผลการดำเนินงานในอดีตไม่ได้บ่งบอกถึงผลลัพธ์ในอนาคต
placeholder
สงครามอิหร่านยังตึงเครียด Trump อาจกลับมาโจมตีภายใน 2-3 วัน หุ้นไทยสวนโลกพุ่งแรง รอ Fed Minutes + Nvidia คืนนี้!ทันทุกกระแสการเงิน สรุปข่าวเด่น Forex หุ้น ทองคำ คริปโตฯ และเศรษฐกิจรอบวัน วิเคราะห์แนวโน้มตลาดด้วยข้อมูลเชิงลึก อ่านง่าย เข้าใจไว อัปเดตล่าสุดที่นี่
ผู้เขียน  Mitrade
5 เดือน 20 วัน พุธ
ทันทุกกระแสการเงิน สรุปข่าวเด่น Forex หุ้น ทองคำ คริปโตฯ และเศรษฐกิจรอบวัน วิเคราะห์แนวโน้มตลาดด้วยข้อมูลเชิงลึก อ่านง่าย เข้าใจไว อัปเดตล่าสุดที่นี่
placeholder
ทองคำพุ่งขึ้นเมื่อรายงานการประชุมเฟดชี้ถึงการขึ้นดอกเบี้ย ดอลลาร์สหรัฐอ่อนค่าลงทองคำ (XAU/USD) ได้รับแรงซื้อและปรับตัวสูงขึ้นในช่วงเซสชันตลาดอเมริกาเหนือวันพุธ หลังจากรายงานการประชุมครั้งล่าสุดของธนาคารกลางสหรัฐฯ (เฟด) แสดงให้เห็นว่าเจ้าหน้าที่ส่วนใหญ่สนับสนุนการวางรากฐานสำหรับการปรับขึ้นอัตราดอกเบี้ย ขณะที่รายงานข่าวนี้ คู่ XAU/USD เคลื่อนไหวที่ $4,530 เพิ่มขึ้น 1%
ผู้เขียน  FXStreet
เมื่อวาน 01: 38
ทองคำ (XAU/USD) ได้รับแรงซื้อและปรับตัวสูงขึ้นในช่วงเซสชันตลาดอเมริกาเหนือวันพุธ หลังจากรายงานการประชุมครั้งล่าสุดของธนาคารกลางสหรัฐฯ (เฟด) แสดงให้เห็นว่าเจ้าหน้าที่ส่วนใหญ่สนับสนุนการวางรากฐานสำหรับการปรับขึ้นอัตราดอกเบี้ย ขณะที่รายงานข่าวนี้ คู่ XAU/USD เคลื่อนไหวที่ $4,530 เพิ่มขึ้น 1%
placeholder
ทองคำทรงตัวต่ำกว่า 4,550 ดอลลาร์ ขณะที่ตลาดรอความคืบหน้าข้อตกลงหยุดยิงระหว่างสหรัฐฯ-อิหร่านในช่วงเช้าของตลาดลงทุนเอเชียวันศุกร์ ราคาทองคํา (XAU/USD) เคลื่อนไหวในกรอบแบนราว $4,545 โลหะมีค่าคงที่ในขณะที่ผู้ค้าเฝ้าติดตามความคืบหน้าของการเจรจาหยุดยิงระหว่างสหรัฐฯ กับอิหร่าน
ผู้เขียน  FXStreet
11 ชั่วโมงที่แล้ว
ในช่วงเช้าของตลาดลงทุนเอเชียวันศุกร์ ราคาทองคํา (XAU/USD) เคลื่อนไหวในกรอบแบนราว $4,545 โลหะมีค่าคงที่ในขณะที่ผู้ค้าเฝ้าติดตามความคืบหน้าของการเจรจาหยุดยิงระหว่างสหรัฐฯ กับอิหร่าน
placeholder
Trump สั่งยึดยูเรเนียมอิหร่าน ทองคำฟื้น-Wall Street พลิกบวก Nvidia ทุบสถิติทันทุกกระแสการเงิน สรุปข่าวเด่น Forex หุ้น ทองคำ คริปโตฯ และเศรษฐกิจรอบวัน วิเคราะห์แนวโน้มตลาดด้วยข้อมูลเชิงลึก อ่านง่าย เข้าใจไว อัปเดตล่าสุดที่นี่
ผู้เขียน  Mitrade
11 ชั่วโมงที่แล้ว
ทันทุกกระแสการเงิน สรุปข่าวเด่น Forex หุ้น ทองคำ คริปโตฯ และเศรษฐกิจรอบวัน วิเคราะห์แนวโน้มตลาดด้วยข้อมูลเชิงลึก อ่านง่าย เข้าใจไว อัปเดตล่าสุดที่นี่
placeholder
แนวโน้มราคากราฟ WTI รายวัน: เส้นค่าเฉลี่ยเคลื่อนที่ 200 วันบนกราฟ H4/แนวโน้มเส้นแนวรับใกล้ระดับ $95.00 เป็นกุญแจสำคัญน้ำมันดิบ West Texas Intermediate (WTI) เกณฑ์มาตรฐานราคาน้ำมันดิบของสหรัฐฯ ยังคงปรับตัวลดลงเป็นวันที่สามติดต่อกัน โดยซื้อขายที่ประมาณกลางระดับ 96.00 ดอลลาร์ในช่วงเซสชั่นเอเชียในวันศุกร์
ผู้เขียน  FXStreet
9 ชั่วโมงที่แล้ว
น้ำมันดิบ West Texas Intermediate (WTI) เกณฑ์มาตรฐานราคาน้ำมันดิบของสหรัฐฯ ยังคงปรับตัวลดลงเป็นวันที่สามติดต่อกัน โดยซื้อขายที่ประมาณกลางระดับ 96.00 ดอลลาร์ในช่วงเซสชั่นเอเชียในวันศุกร์
ตราสารที่เกี่ยวข้อง
goTop
quote