
Pi Network Price Forecast: PI recovery faces token unlock, CEXs inflow risk
- Pi Network recovers above the 50-day EMA, staging a potential breakout rally.
- The CEXs' wallets registered 6.28 million PI token inflows, indicating substantial deposits.
- Roughly 120 million PI tokens will be unlocked in November, potentially fueling selling pressure.
Pi Network (PI) trades above $0.2600 at the time of writing on Wednesday, surfacing above the 50-day Exponential Moving Average at $0.2618 for a potential breakout. The technical outlook is bullish, while the near 120 million PI tokens to be unlocked in November and rising inflows over Centralized Exchanges (CEXs) could provide headwinds.
CEXs' inflow, token unlocks add to supply risk
A surge in CEXs balance reserves signals an increase in potential supply pressure. PiScan data shows that the CEXs' wallet balance has increased by 6.28 million PI tokens over the last 24 hours, to 419.94 million PI. This inflow increases the risk of supply pressure after the recent mainnet migration of 2.69 million users, which enabled token transfers to CEXs.
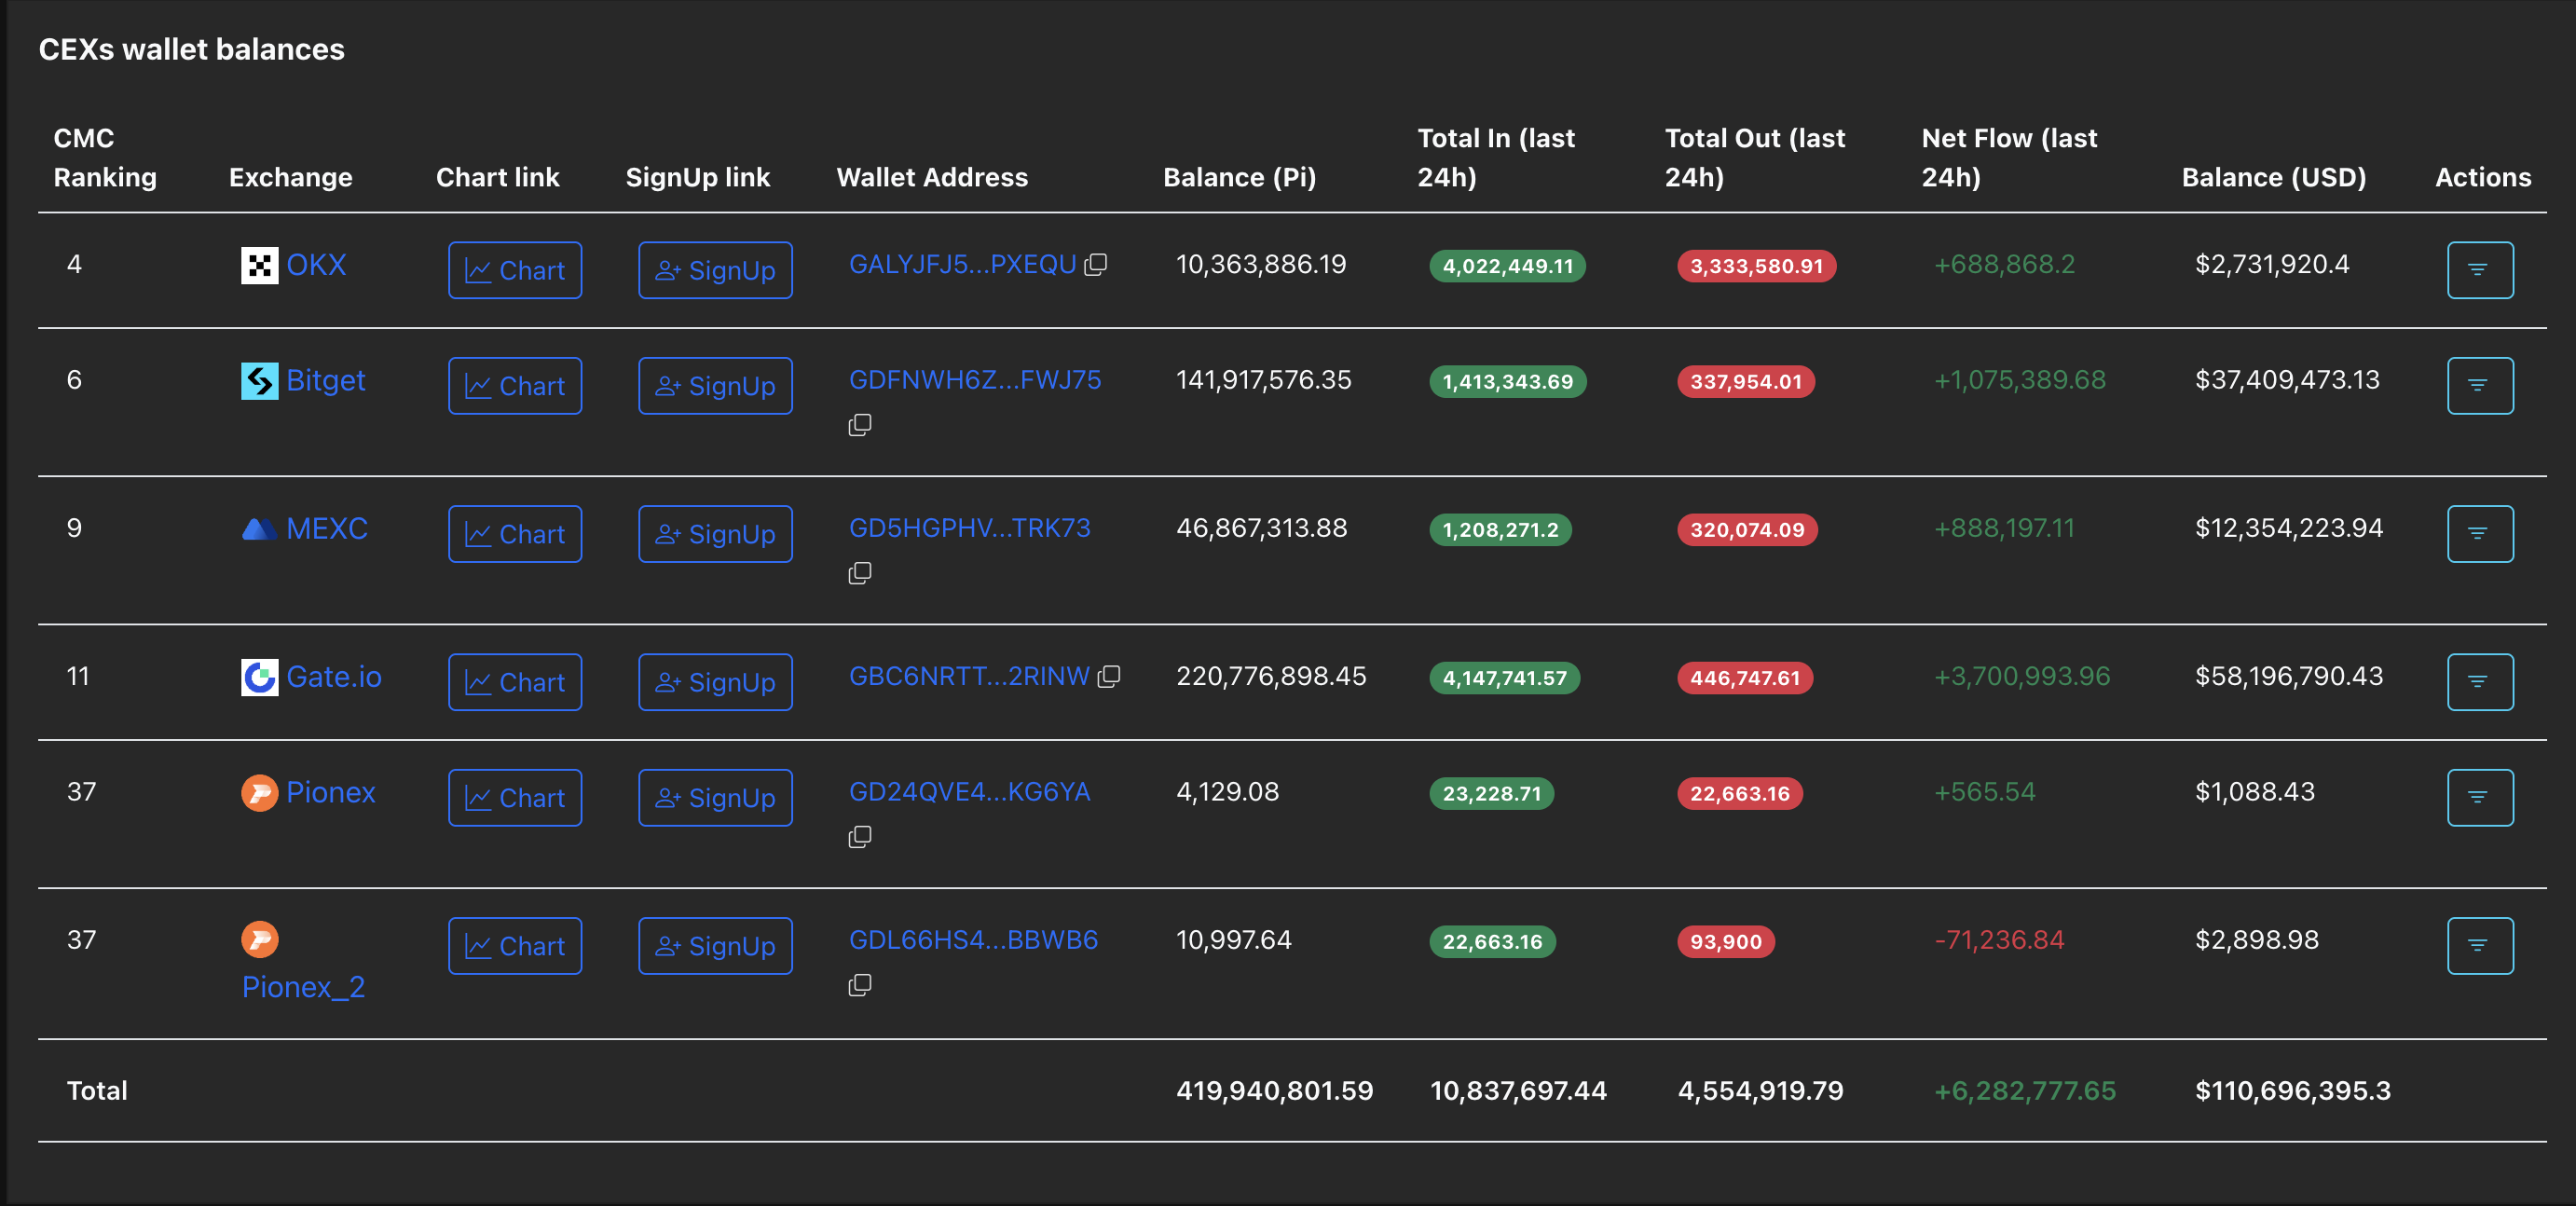
CEX's wallet balance. Source: PiScan
On the other hand, the PiScan token unlock schedule indicates that 119.93 million PI will be released in November. This unlock, coupled with rising inflows into CEXs, could intensify the headwinds facing the ongoing PI token recovery.
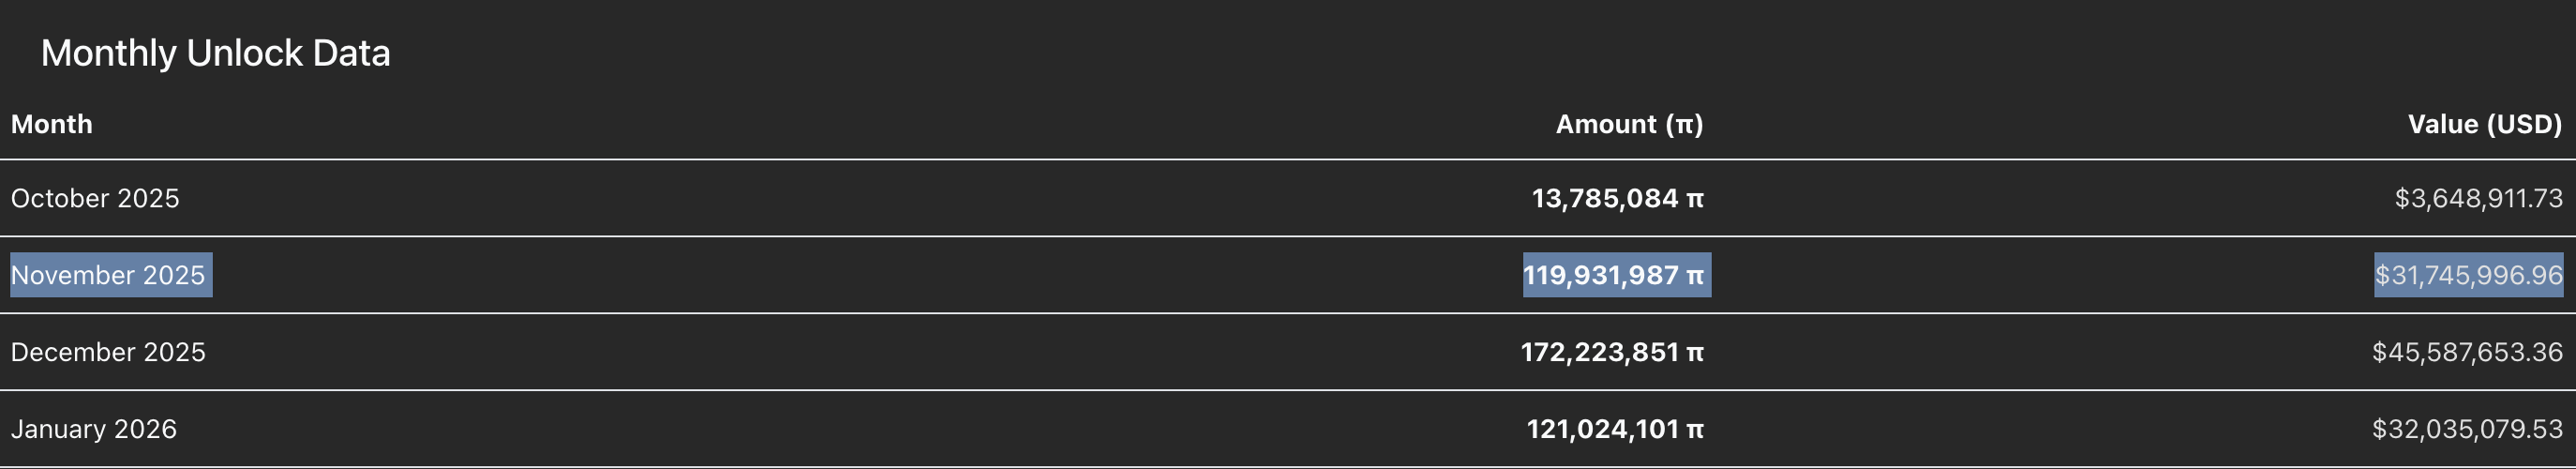
PI token unlock schedule. Source: PiScan
Pi Network eyes further gains above the 50-day EMA
Pi Network trades above the 50-day EMA at $0.2618, suggesting a potential breakout of the dynamic resistance that has held since May 21. A successful close above $0.2618 could extend the PI rally to $0.3220, marked by the August 1 low.
The momentum indicators on the daily chart signal a steady rise in buying pressure, as the Relative Strength Index (RSI) at 65 is inching toward the overbought zone. Additionally, the Moving Average Convergence Divergence (MACD) and the signal line rise towards the zero line, aiming to cross into the positive territory as bullish momentum increases.
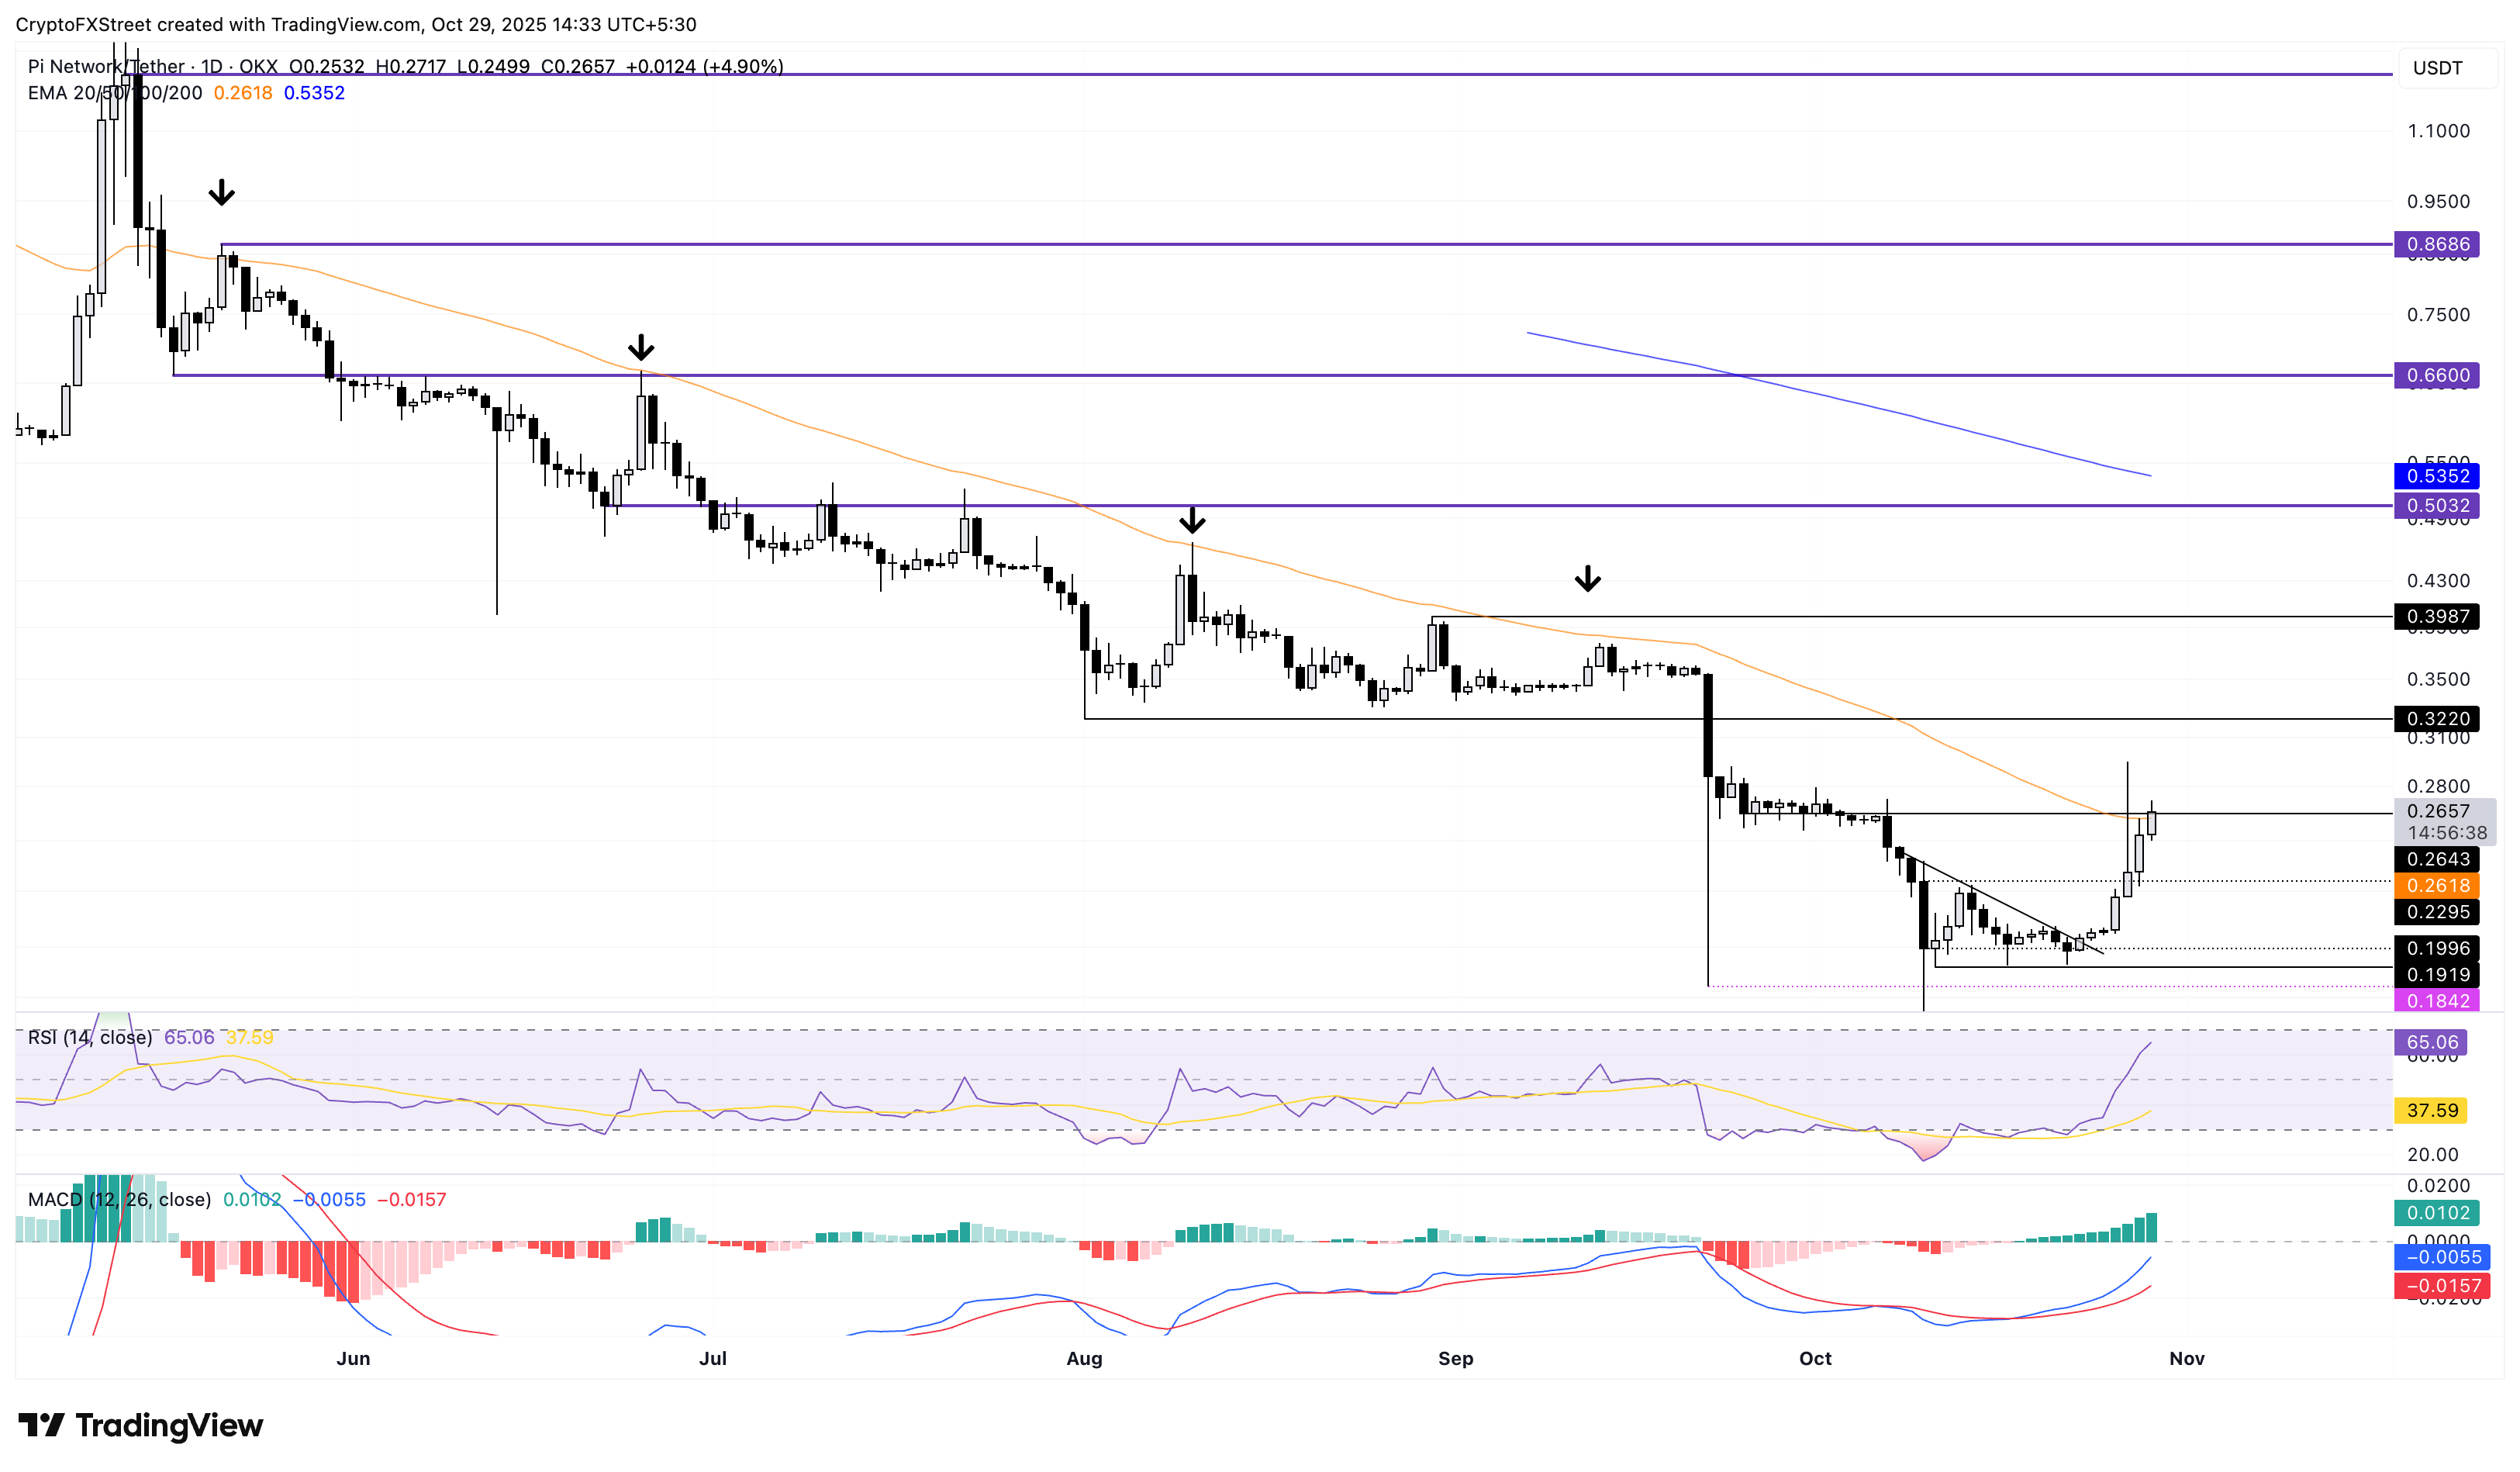
PI/USDT daily price chart.
On the flip side, a reversal from the 50-day EMA could retest the $0.1919 base, marked by the low of October 11.
Bitcoin, altcoins, stablecoins FAQs
Bitcoin is the largest cryptocurrency by market capitalization, a virtual currency designed to serve as money. This form of payment cannot be controlled by any one person, group, or entity, which eliminates the need for third-party participation during financial transactions.
Altcoins are any cryptocurrency apart from Bitcoin, but some also regard Ethereum as a non-altcoin because it is from these two cryptocurrencies that forking happens. If this is true, then Litecoin is the first altcoin, forked from the Bitcoin protocol and, therefore, an “improved” version of it.
Stablecoins are cryptocurrencies designed to have a stable price, with their value backed by a reserve of the asset it represents. To achieve this, the value of any one stablecoin is pegged to a commodity or financial instrument, such as the US Dollar (USD), with its supply regulated by an algorithm or demand. The main goal of stablecoins is to provide an on/off-ramp for investors willing to trade and invest in cryptocurrencies. Stablecoins also allow investors to store value since cryptocurrencies, in general, are subject to volatility.
Bitcoin dominance is the ratio of Bitcoin's market capitalization to the total market capitalization of all cryptocurrencies combined. It provides a clear picture of Bitcoin’s interest among investors. A high BTC dominance typically happens before and during a bull run, in which investors resort to investing in relatively stable and high market capitalization cryptocurrency like Bitcoin. A drop in BTC dominance usually means that investors are moving their capital and/or profits to altcoins in a quest for higher returns, which usually triggers an explosion of altcoin rallies.
บทความแนะนำ


