
Japanese Yen advances following Trade Balance data
- Japanese Yen receives support as trade deficit narrowed to JPY 234.6 billion in September, from August's JPY 242.8 billion deficit.
- Japan’s exports rose 4.2% YoY, marking the first increase since April, slightly below the expected 4.6% gain.
- The US Dollar may struggle amid concerns over a prolonged federal government shutdown.
The Japanese Yen (JPY) advances against the US Dollar (USD) on Wednesday after three days of losses. The USD/JPY pair depreciates as the JPY gains ground following the release of Japan’s Merchandise Trade Balance Total data.
Japan’s Ministry of Finance reported a trade deficit of JPY 234.6 billion in September, narrowing slightly from August’s deficit of JPY 242.8 billion (revised from -242.5) but falling short of market expectations for a JPY 22.0 billion surplus.
Japan’s Exports rose 4.2% year-on-year, the first increase since April, though slightly below the projected 4.6% gain. Meanwhile, Imports jumped 3.3% to an eight-month high, marking their first rise in three months and exceeding forecasts for a modest 0.6% increase.
The JPY faced challenges after dovish Sanae Takaichi was elected as Japan’s first female Prime Minister on Tuesday. Takaichi vowed to strengthen the nation’s economy and defense capabilities, as well as enhance relations with the US. Her victory came after the ruling Liberal Democratic Party (LDP) allied with the Japan Innovation Party and reportedly signed an agreement over the weekend to form a coalition government.
US Dollar steadies amid a prolonged federal government shutdown
- The US Dollar Index (DXY), which measures the value of the US Dollar (USD) against six major currencies, is edging lower after registering gains in the previous session and trading around 98.90 at the time of writing. The Greenback may come under pressure amid concerns over a prolonged federal government shutdown and potential delays in key US economic data releases, including Nonfarm Payrolls (NFP), adding uncertainty for financial markets and the Federal Reserve (Fed).
- The CME FedWatch Tool indicates that markets are now pricing in nearly a 99% chance of a Fed rate cut in October and a 98% possibility of another reduction in December.
- The US government shutdown has entered its fourth week as the Senate on Monday failed for the 11th time to advance a House-passed measure to fund the government and end the ongoing shutdown. The 50-43 vote fell mostly along party lines. This marks the third-longest funding lapse in modern history.
- St. Louis Fed President Alberto Musalem spoke at the Institute of International Finance Annual Membership Meeting in Washington, DC, on Friday that he could support a path with another rate cut if more risks to jobs emerge and inflation is contained. Musalem added that the Fed should not be on a preset course and follow a balanced approach.
- US Federal Reserve (Fed) Governor Christopher Waller stated on Thursday that he supports another interest rate cut at this month’s upcoming policy meeting. Meanwhile, the Fed’s newest governor, Stephen Miran, reiterated his call for a more aggressive rate-cut trajectory for 2025 than that favored by his colleagues.
- Federal Reserve Chair Jerome Powell stated last week that the central bank is on track to deliver another quarter-point interest-rate reduction later this month, even as a government shutdown significantly reduces its read on the economy. Powell highlighted the low pace of hiring and noted that it may weaken further.
USD/JPY remains close to 152.00 due to persistent bullish bias
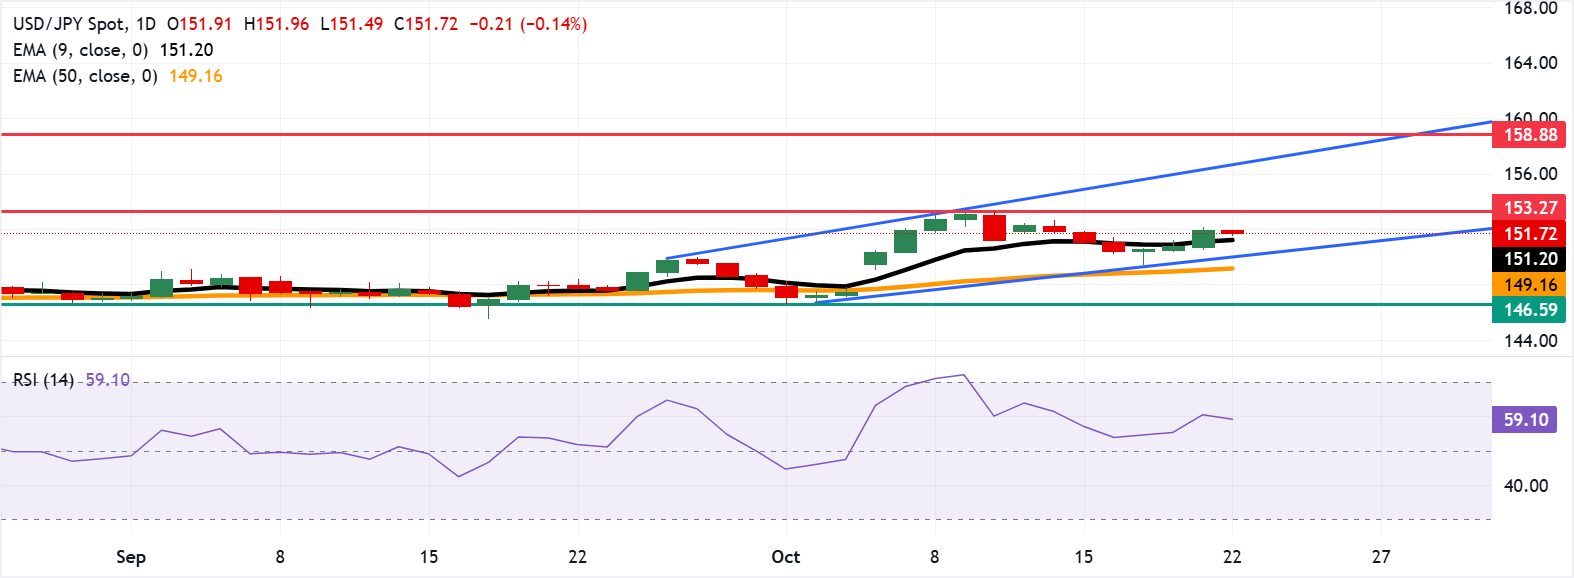
The Japanese Yen gains ground against the US Dollar, with the USD/JPY pair trading lower at around 151.70 on Wednesday. The technical analysis of the daily chart suggests an ongoing bullish bias as the pair remains within the ascending channel pattern.
On the upside, the initial barrier lies at the eight-month high of 153.27, which was recorded on October 10. A break above this level would support the pair to explore the region around the upper boundary of the ascending channel at 156.90.
The immediate support appears at the nine-day Exponential Moving Average (EMA) of 151.20. A break below this level would weaken the short-term price momentum and prompt the USD/JPY pair to test the ascending channel’s lower boundary around 150.00, followed by the 50-day EMA at 149.16. Further declines would cause the emergence of the bearish bias and put downward pressure on the pair to navigate the area around the monthly low of 146.59.
USD/JPY: Daily Chart
Japanese Yen Price Today
The table below shows the percentage change of Japanese Yen (JPY) against listed major currencies today. Japanese Yen was the strongest against the US Dollar.
| USD | EUR | GBP | JPY | CAD | AUD | NZD | CHF | |
|---|---|---|---|---|---|---|---|---|
| USD | -0.07% | -0.03% | -0.15% | -0.14% | -0.10% | -0.15% | -0.08% | |
| EUR | 0.07% | 0.03% | -0.09% | -0.07% | -0.04% | -0.05% | -0.01% | |
| GBP | 0.03% | -0.03% | -0.12% | -0.10% | -0.07% | -0.09% | -0.04% | |
| JPY | 0.15% | 0.09% | 0.12% | 0.00% | 0.06% | 0.03% | 0.09% | |
| CAD | 0.14% | 0.07% | 0.10% | -0.01% | 0.03% | 0.02% | 0.06% | |
| AUD | 0.10% | 0.04% | 0.07% | -0.06% | -0.03% | -0.02% | 0.02% | |
| NZD | 0.15% | 0.05% | 0.09% | -0.03% | -0.02% | 0.02% | 0.04% | |
| CHF | 0.08% | 0.01% | 0.04% | -0.09% | -0.06% | -0.02% | -0.04% |
The heat map shows percentage changes of major currencies against each other. The base currency is picked from the left column, while the quote currency is picked from the top row. For example, if you pick the Japanese Yen from the left column and move along the horizontal line to the US Dollar, the percentage change displayed in the box will represent JPY (base)/USD (quote).
Economic Indicator
Merchandise Trade Balance Total
The Merchandise Trade Balance Total released by the Ministry of Finance is a measure of balance amount between import and export. A positive value shows a trade surplus while a negative value shows a trade deficit. Japan is so much dependant on exports that the Japanese economy heavily relies on a trade surplus. Therefore, any variation in the figures influences the domestic economy. If a steady demand in exchange for Japanese exports is seen, that would turn into a positive.
Read more.Last release: Tue Oct 21, 2025 23:50
Frequency: Monthly
Actual: ¥-234.6B
Consensus: ¥22B
Previous: ¥-242.5B
Source: Ministry of Finance of Japan
Artigos Recomendados


