

US Dollar extends sideways trend as investors sideline ahead of inflation data
- The US Dollar trades broadly unchanged ahead of PPI numbers for July.
- Carry and high-beta currencies are pushing back against the US Dollar.
- The US Dollar index remains glued to the 103.18 pivotal level.
The US Dollar (USD) trades mixed on Tuesday, extending Monday’s little moves, with one single pattern that stands out on the quote board. The hurted carry and high-beta trades that were on the fence last week are currently outperforming against the Greenback, with the Polish Zloty (PLN), Australian Dollar (AUD), New Zealand Dollar (NZD) and Czech Koruna (CZK) as main gainers. Still, these moves are not visible at all in the DXY chart because the US Dollar is outperforming against the Japanese Yen (JPY).
On the economic data front, the calendar is starting to pick up a bit. The Producer Price Index (PPI) will be the main topic for this Tuesday in the run up towards the US Consumer Price Index (CPI) release on Wednesday. Overall, a decline in PPI numbers is expected across the board, reinforcing the thesis that inflation pressures are subsiding.
Daily digest market movers: First data points ahead of CPI
- The NFIB Business Optimism Index for July will be released at 10:00 GMT. Expectations is for a broadly steady 91.7 from the 91.5 reported in June.
- At 12:30 GMT, the US Producer Price Index data for July will be released:
- Monthly headline PPI is expected to increase 0.1%, less than the 0.2% advance seen a month earlier. On year, headline PPI is also anticipated to soften to 2.3% from 2.6%.
- As for the core readings, monthly Core PPI is expected to rise 0.2%, easing from the 0.4% advance a month earlier. Yearly core PPI should slip below 3%, to 2.7%..
- Around 17:15 GMT, Federal Reserve Bank of Atlanta President Raphael Bostic participates in a moderated conversation at the Conference of African American Financial Professionals in Atlanta, United States.
- Equity markets are shooting out of the gates with firm gains in Asia. The Japanese TOPIX and Nikkei index are both closing near 3% in the green. European equities and US futures are taking over the positive sentiment, although posting slightly less gains.
- The CME Fedwatch Tool shows a 52.5% chance of a 25 basis points (bps) interest rate cut by the Fed in September against a 47.5% chance for a 50 bps cut. Another 25 bps cut (if September is a 25 bps cut) is expected in November by 38.5%, while there is a 49.7% chance that rates will be 50 bps below the current levels and and a 11.7% probability of rates being 75 basis points lower.
- The US 10-year benchmark rate trades at 3.91%, easing further away from 4%.
US Dollar Index Technical Analysis: Standstill until Wednesday
The US Dollar Index (DXY) is getting torn between two forces. One element is that the high beta and carry traders are regaining strength after their substantially weak performance since the beginning of August. Though, the US Dollar is gaining against the Japanese Yen in the meantime.The Yen accounts for 13.6% of the DXY against no weighting at all for the Australian Dollar or the Polish Zloty, which paints a standstill picture on the DXY chart.
Still, the first level to recover, which gains importance every day, is 103.18, a level held on August 2 though snapped on August 5 in the Asian hours. Once the DXY closes above that level, next up is 104.00, which was the support from June. If the DXY can return above that level, the 200-day Simple Moving Average (SMA) at 104.15 is the next resistance to look out for.
On the downside, the oversold condition in the Relative Strength Index (RSI) indicator has eased in the daily chart and holds room again for a small leg lower. Support nearby is the March 8 low at 102.35. Once through there, pressure will start to build on 102.00 as a big psychological figure before testing 101.90, which was a pivotal level in December 2023 and January 2024.
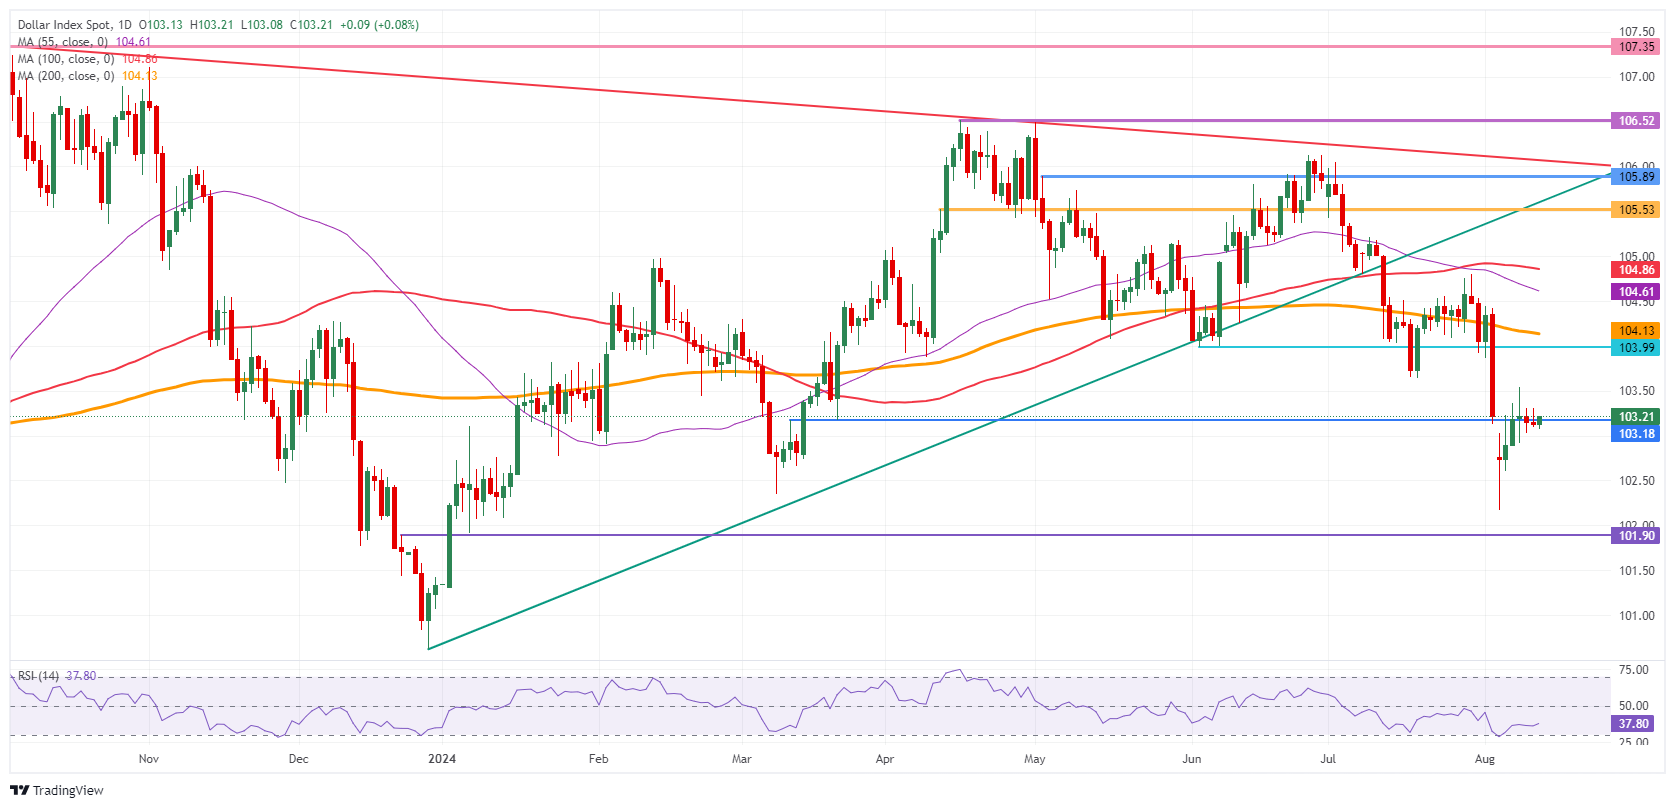
US Dollar Index: Daily Chart
US Dollar FAQs
The US Dollar (USD) is the official currency of the United States of America, and the ‘de facto’ currency of a significant number of other countries where it is found in circulation alongside local notes. It is the most heavily traded currency in the world, accounting for over 88% of all global foreign exchange turnover, or an average of $6.6 trillion in transactions per day, according to data from 2022. Following the second world war, the USD took over from the British Pound as the world’s reserve currency. For most of its history, the US Dollar was backed by Gold, until the Bretton Woods Agreement in 1971 when the Gold Standard went away.
The most important single factor impacting on the value of the US Dollar is monetary policy, which is shaped by the Federal Reserve (Fed). The Fed has two mandates: to achieve price stability (control inflation) and foster full employment. Its primary tool to achieve these two goals is by adjusting interest rates. When prices are rising too quickly and inflation is above the Fed’s 2% target, the Fed will raise rates, which helps the USD value. When inflation falls below 2% or the Unemployment Rate is too high, the Fed may lower interest rates, which weighs on the Greenback.
In extreme situations, the Federal Reserve can also print more Dollars and enact quantitative easing (QE). QE is the process by which the Fed substantially increases the flow of credit in a stuck financial system. It is a non-standard policy measure used when credit has dried up because banks will not lend to each other (out of the fear of counterparty default). It is a last resort when simply lowering interest rates is unlikely to achieve the necessary result. It was the Fed’s weapon of choice to combat the credit crunch that occurred during the Great Financial Crisis in 2008. It involves the Fed printing more Dollars and using them to buy US government bonds predominantly from financial institutions. QE usually leads to a weaker US Dollar.
Quantitative tightening (QT) is the reverse process whereby the Federal Reserve stops buying bonds from financial institutions and does not reinvest the principal from the bonds it holds maturing in new purchases. It is usually positive for the US Dollar.
Artigos Recomendados


