
Tron On-chain Report: The largest USDT network witnesses increased whale activity
- The Tron network holds the largest available supply of USDT among all major chains, even surpassing the USDC market capitalization.
- A surge in large transaction volume on Tron suggests increased whale activity.
- The on-chain data reveal that USDT transactions are the most frequently used contracts on Tron in 2025.
The Tron (TRX) network, launched by Justin Sun in 2017, is gradually becoming the go-to choice for retailers and whales in the cryptocurrency market, thanks to its growing USDT supply —a USD-pegged stablecoin issued by Tether.
Tron’s growing USDT base fuels network activity
CryptoQuant’s data shows over $694 billion in USDT was transferred through 89.33 million contract interactions on the Tron network in May.
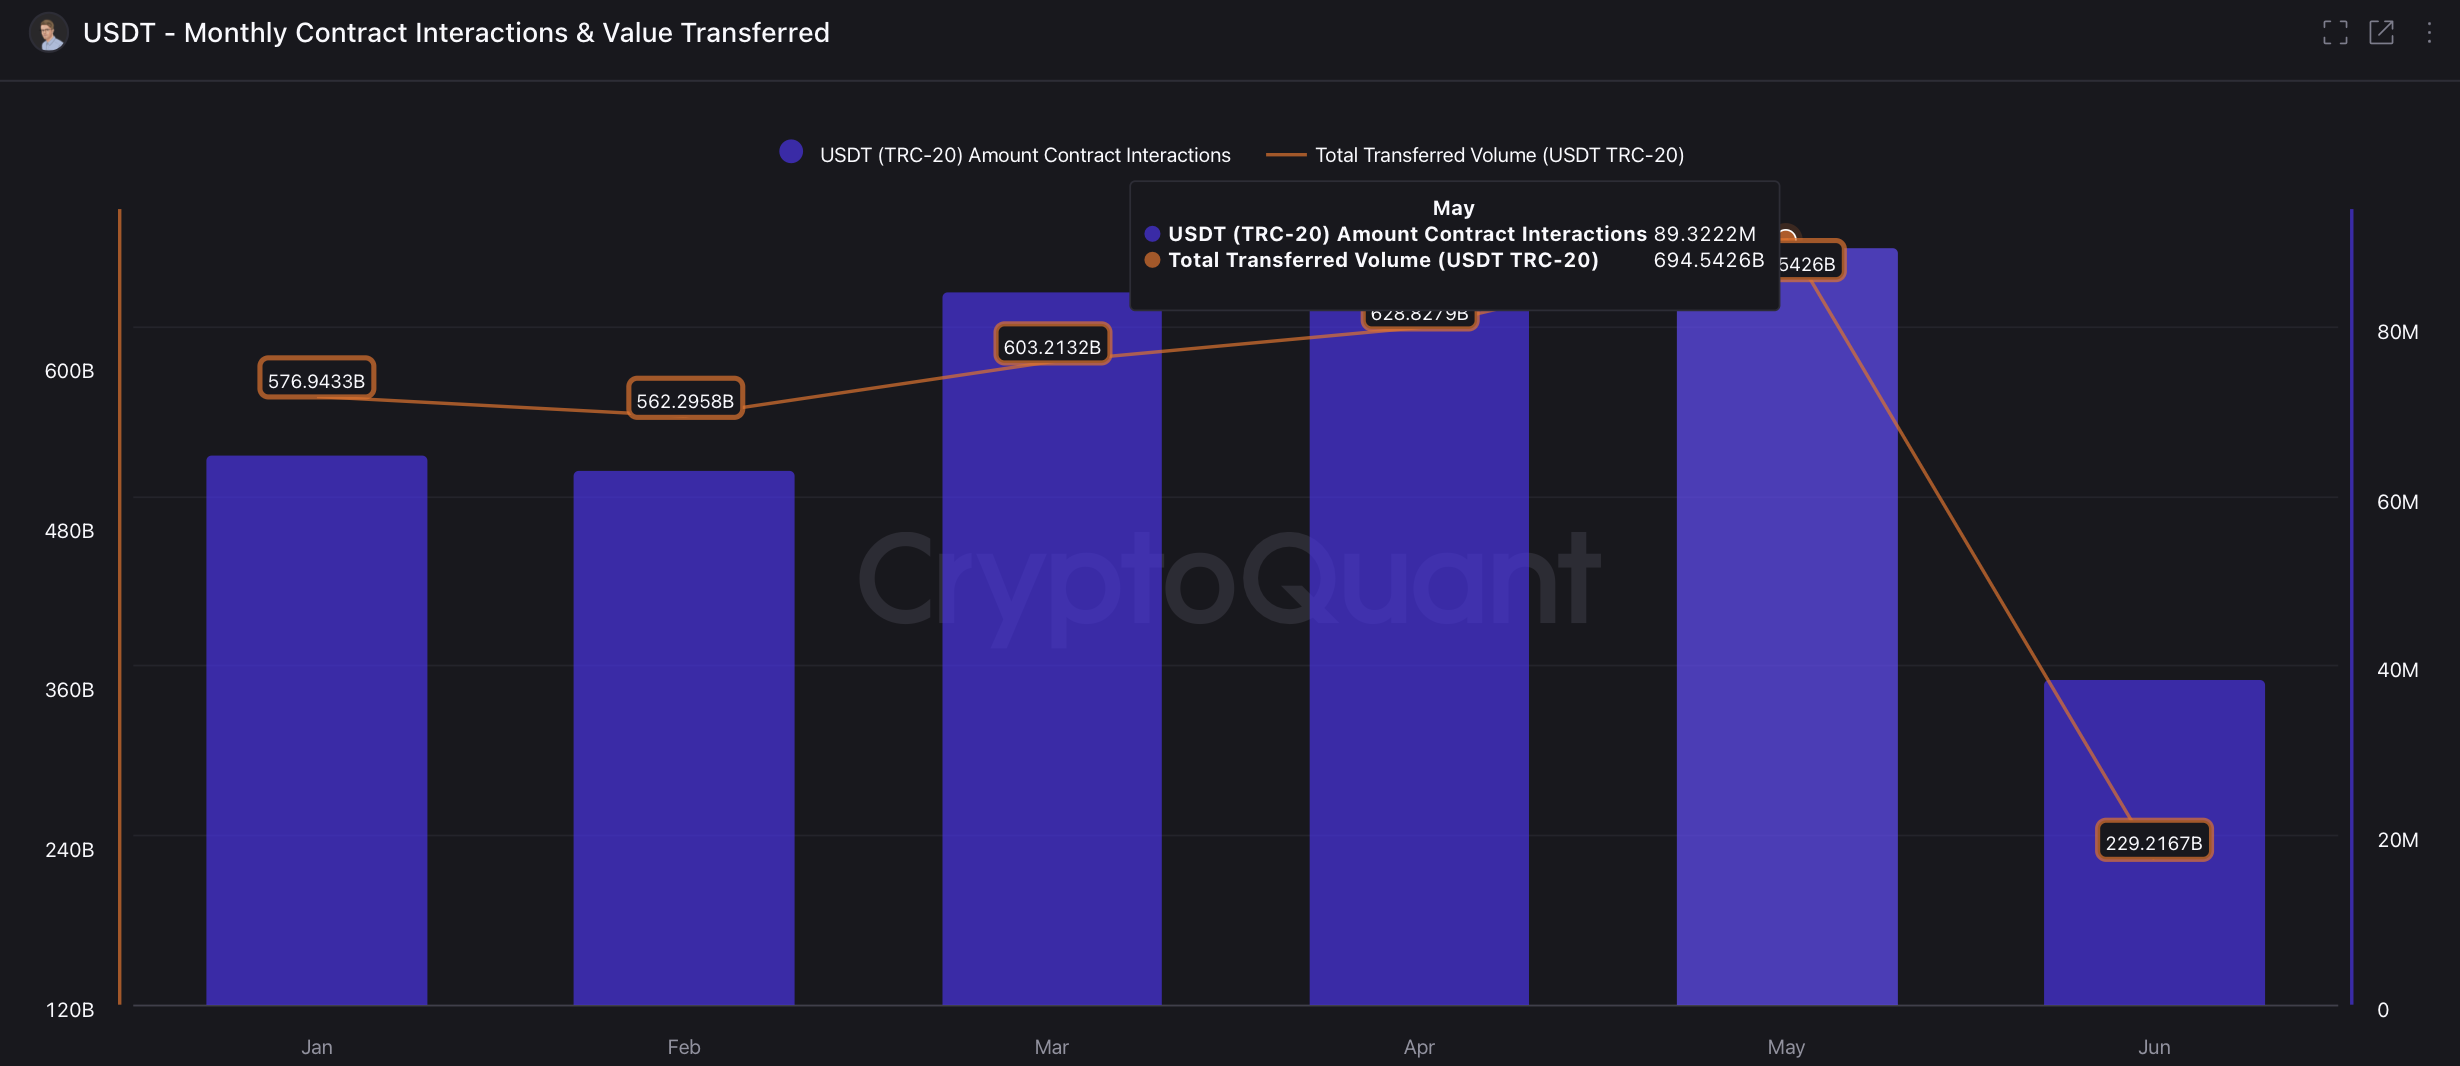
Monthly contract interactions and value transferred. Source: CryptoQuant
Out of the total transfers, $691 million in USDT transfer volume over $100 on the Tron network in May. Notably, whales dominate the USDT transfer flow, with over $455 billion in transfers, including transactions with volumes exceeding $1 million, which account for 65% of the monthly volume.
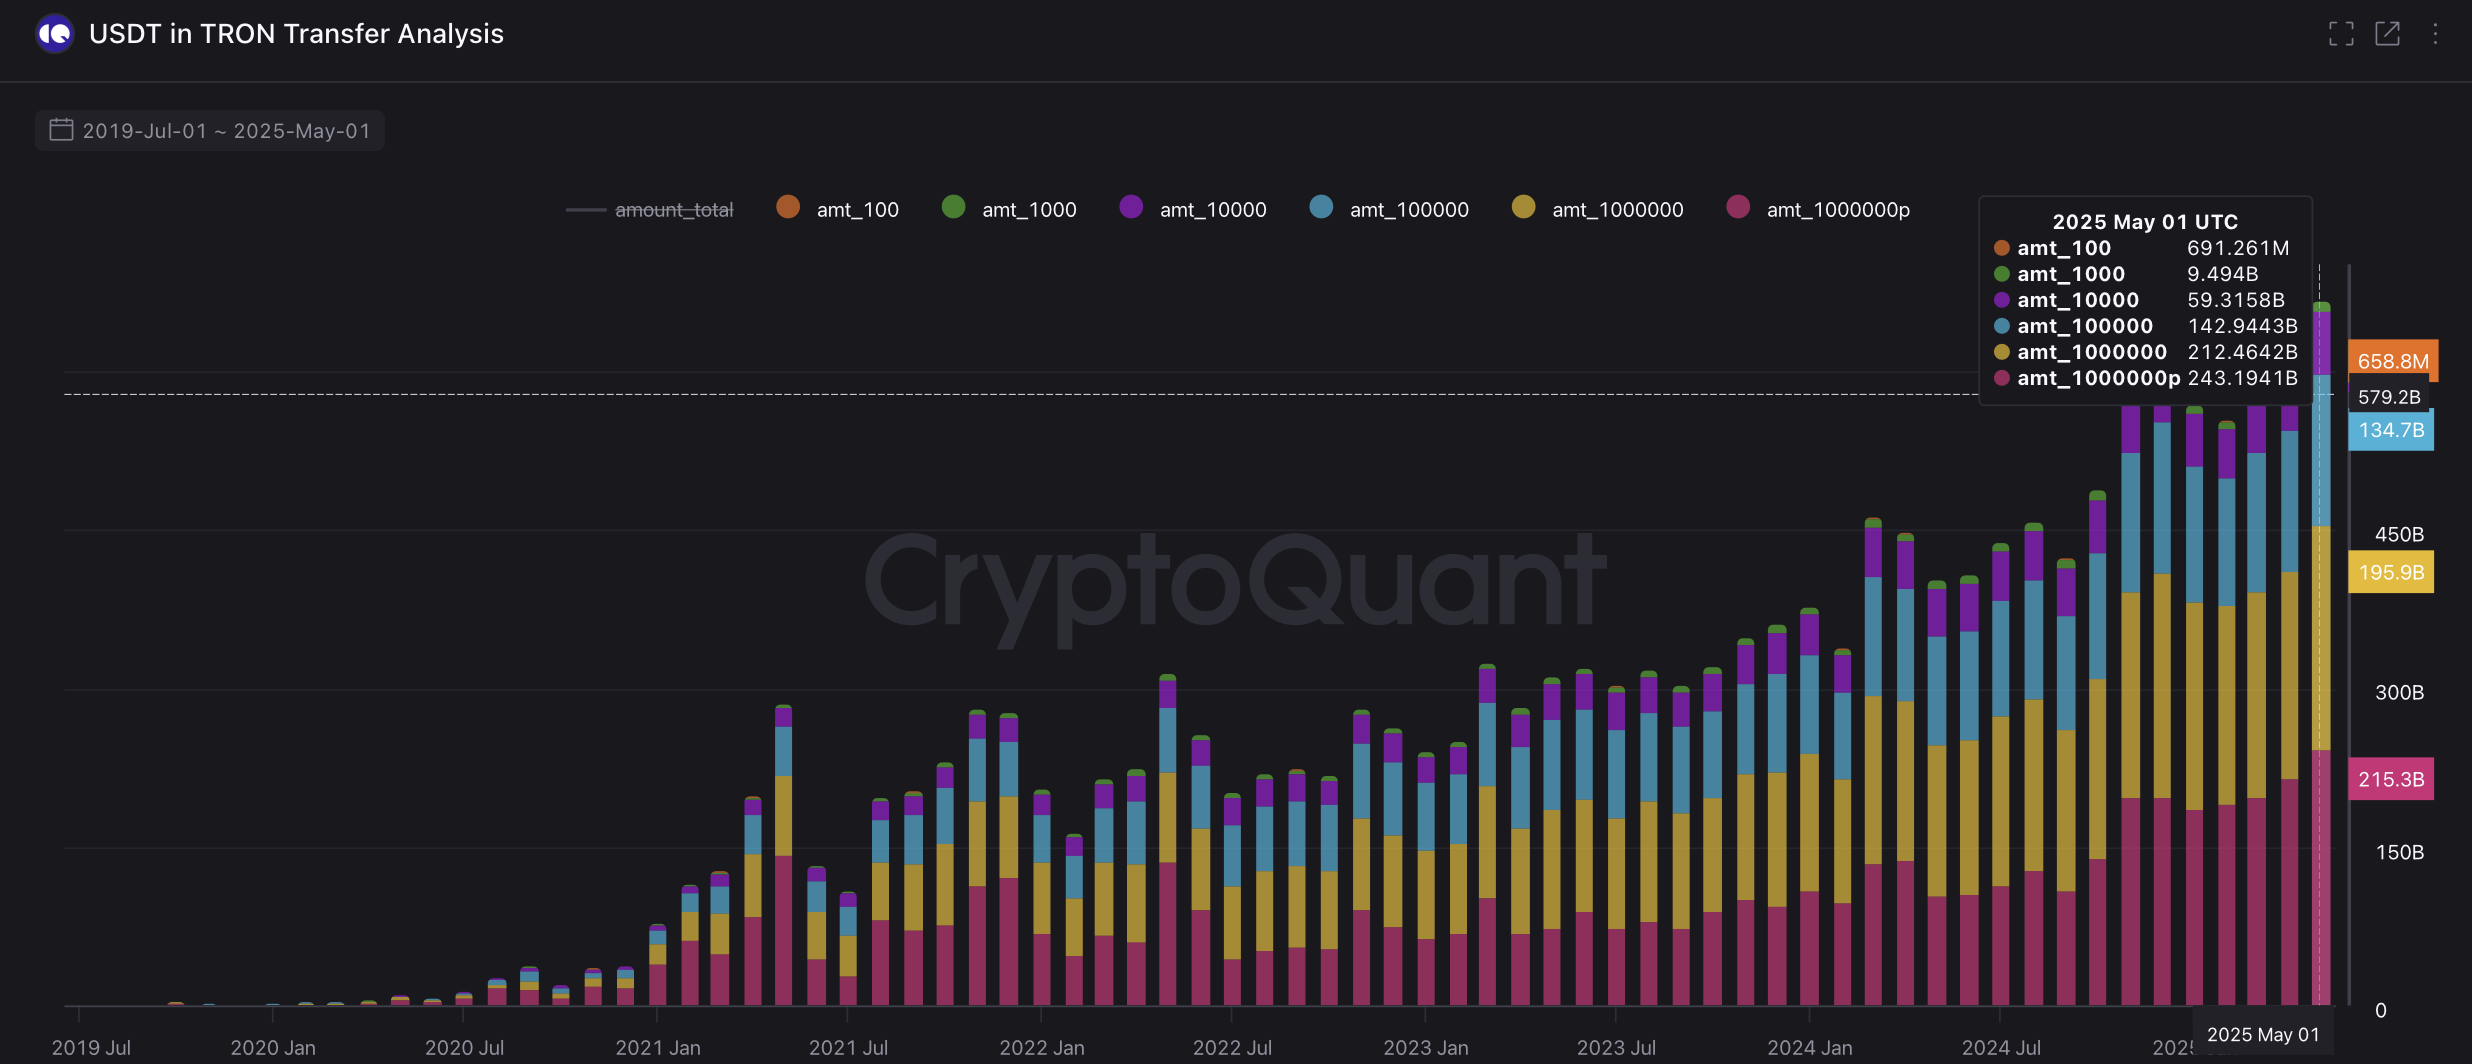
USDT in Tron transfer analysis. Source: CryptoQuant
The increasing transfers are catalyzed by low transaction fees on Tron and the rising USDT supply. Out of the $79.044 billion of Tron stablecoin market capitalization, USDT dominates over 99% while Decentralized USD (USDD) holds the second spot with $421 million.
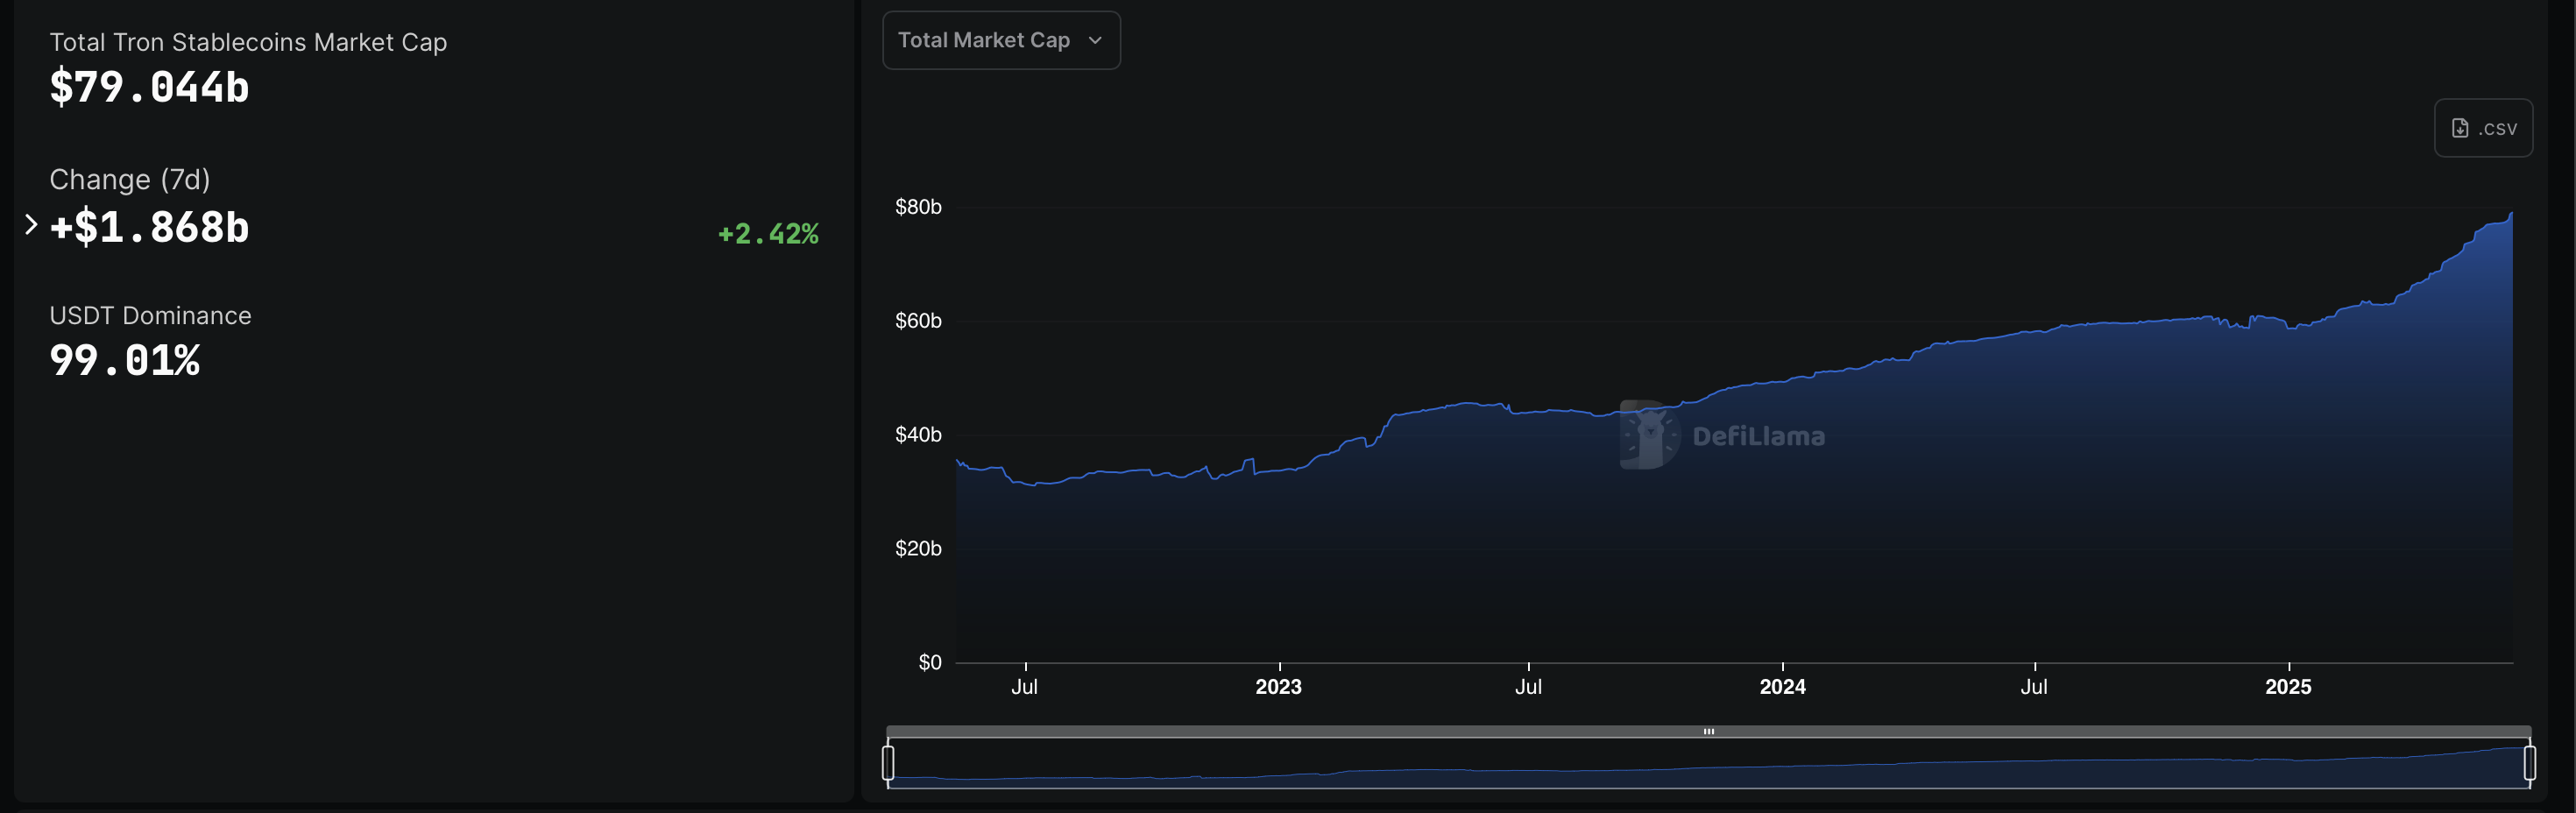
Tron stablecoin market capitalization. Source: DeFiLlama
The $77.7 billion USDT market cap on Tron has surpassed Ethereum’s $73.2 billion due to the recent minting process on the former network. Surprisingly, the USDT market dominance is cemented by its supply on Tron exceeding the USDC, issued by Circle, market capitalization of $60.9 billion.
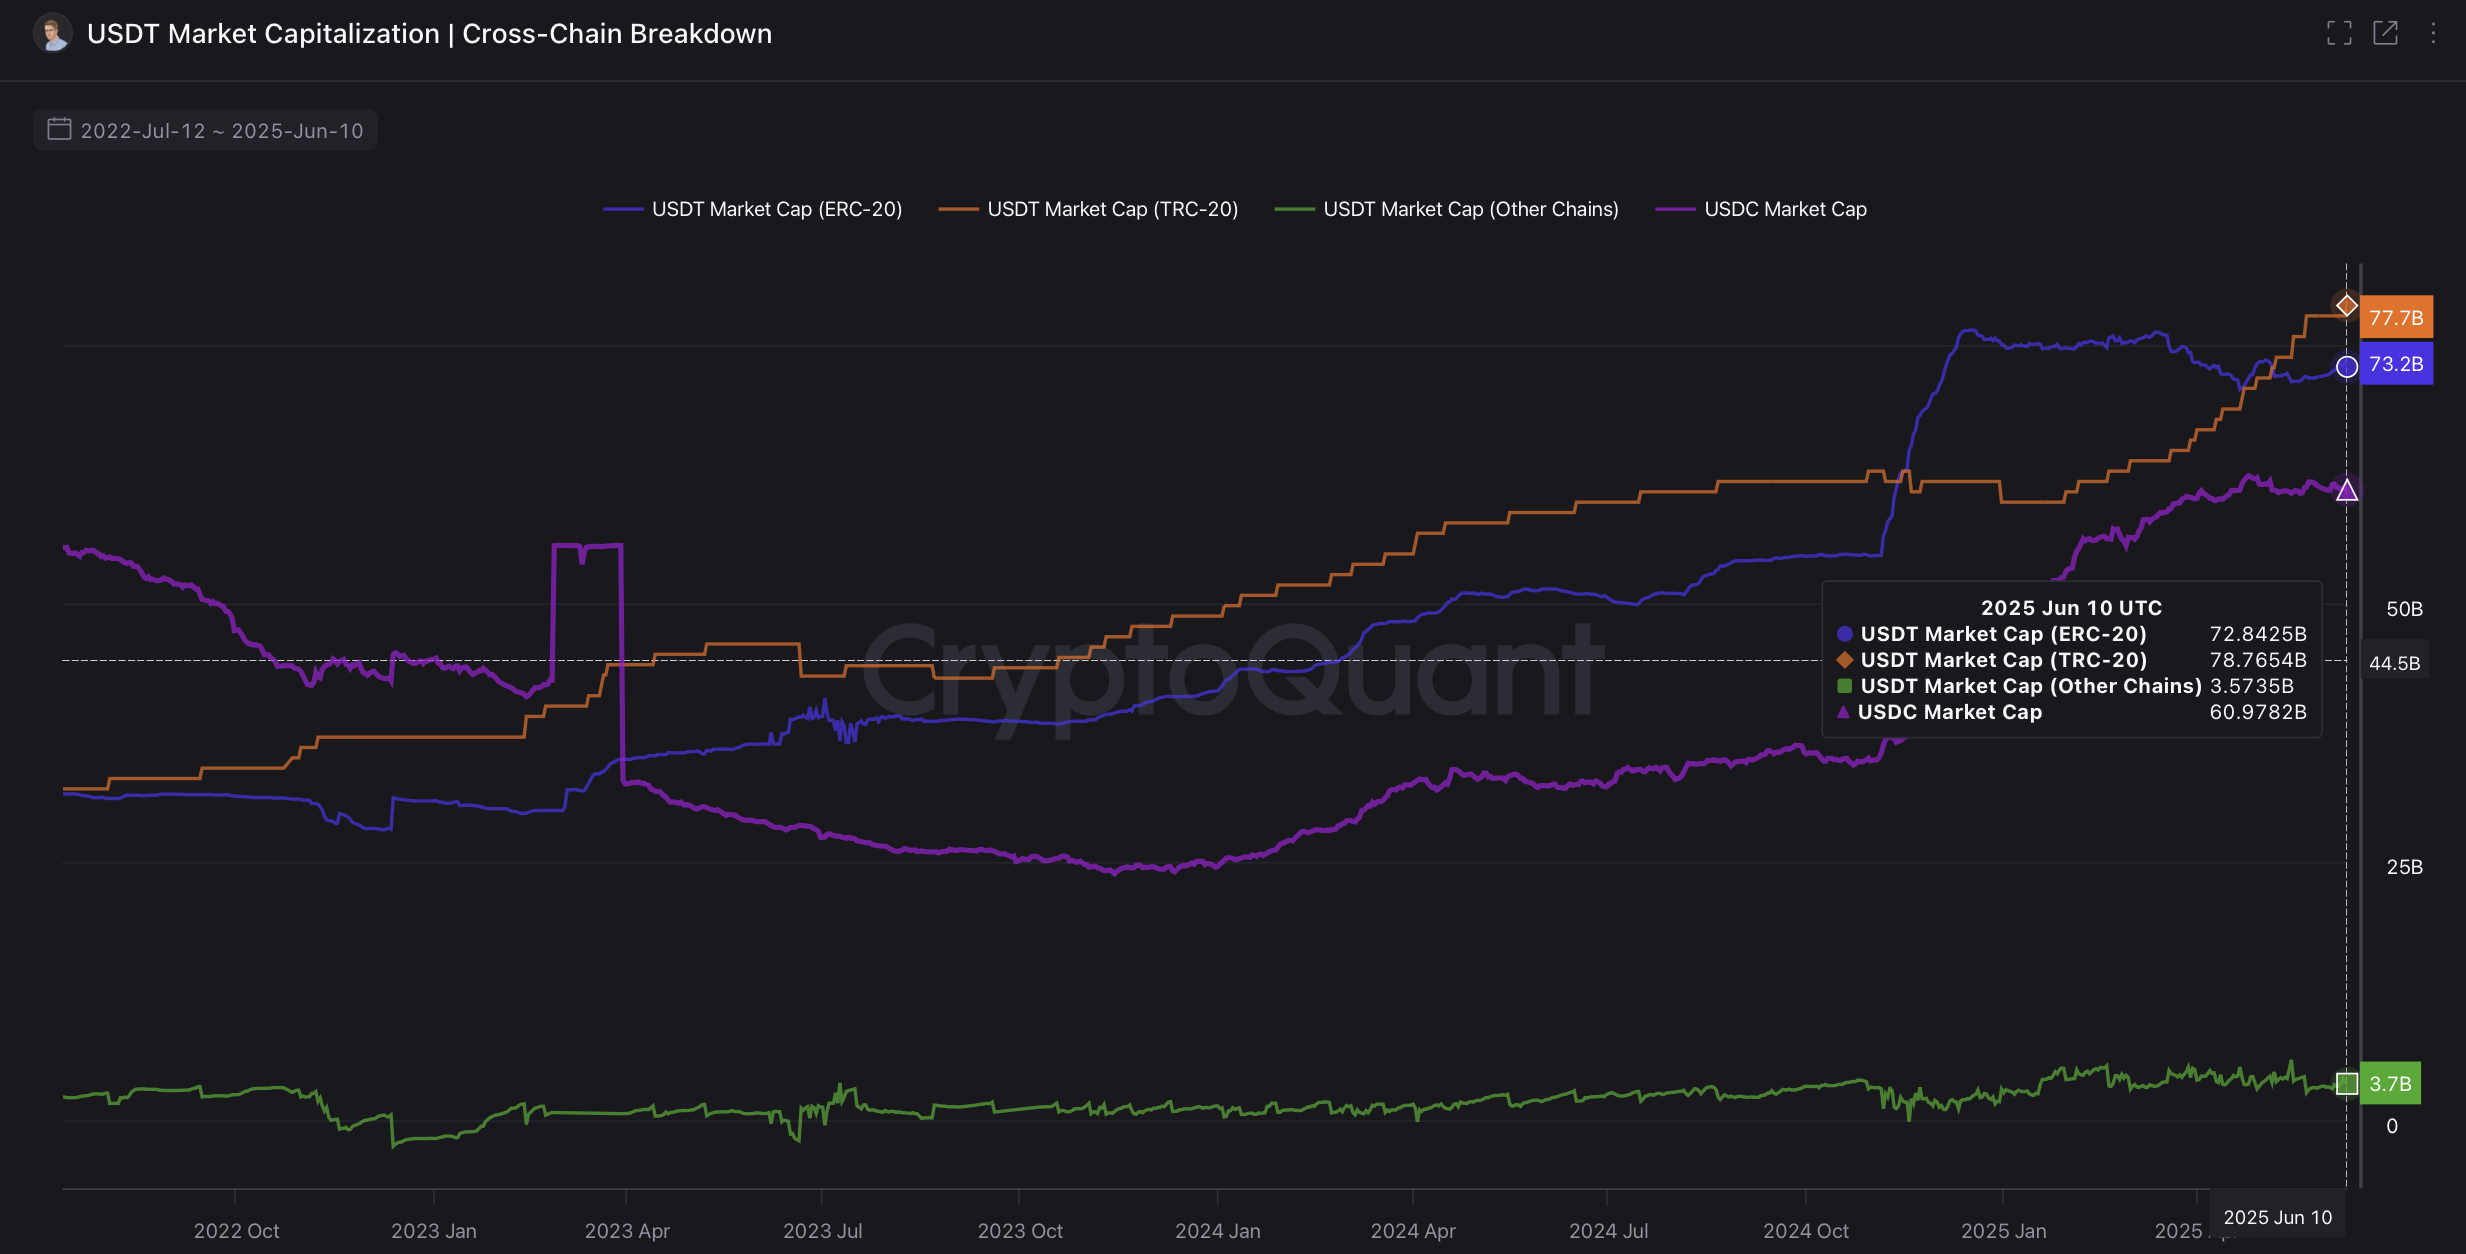
USDT market capitalization breakdown. Source: CryptoQuant
On a side note, US President Donald Trump’s World Liberty Financial recently launched its USD1 stablecoin on the Tron Network.
In 2025, the Tron network witnessed more than 17 mints of more than $1 billion USDT. As the minting frequency grows, the rising supply could boost the network activity on Tron.
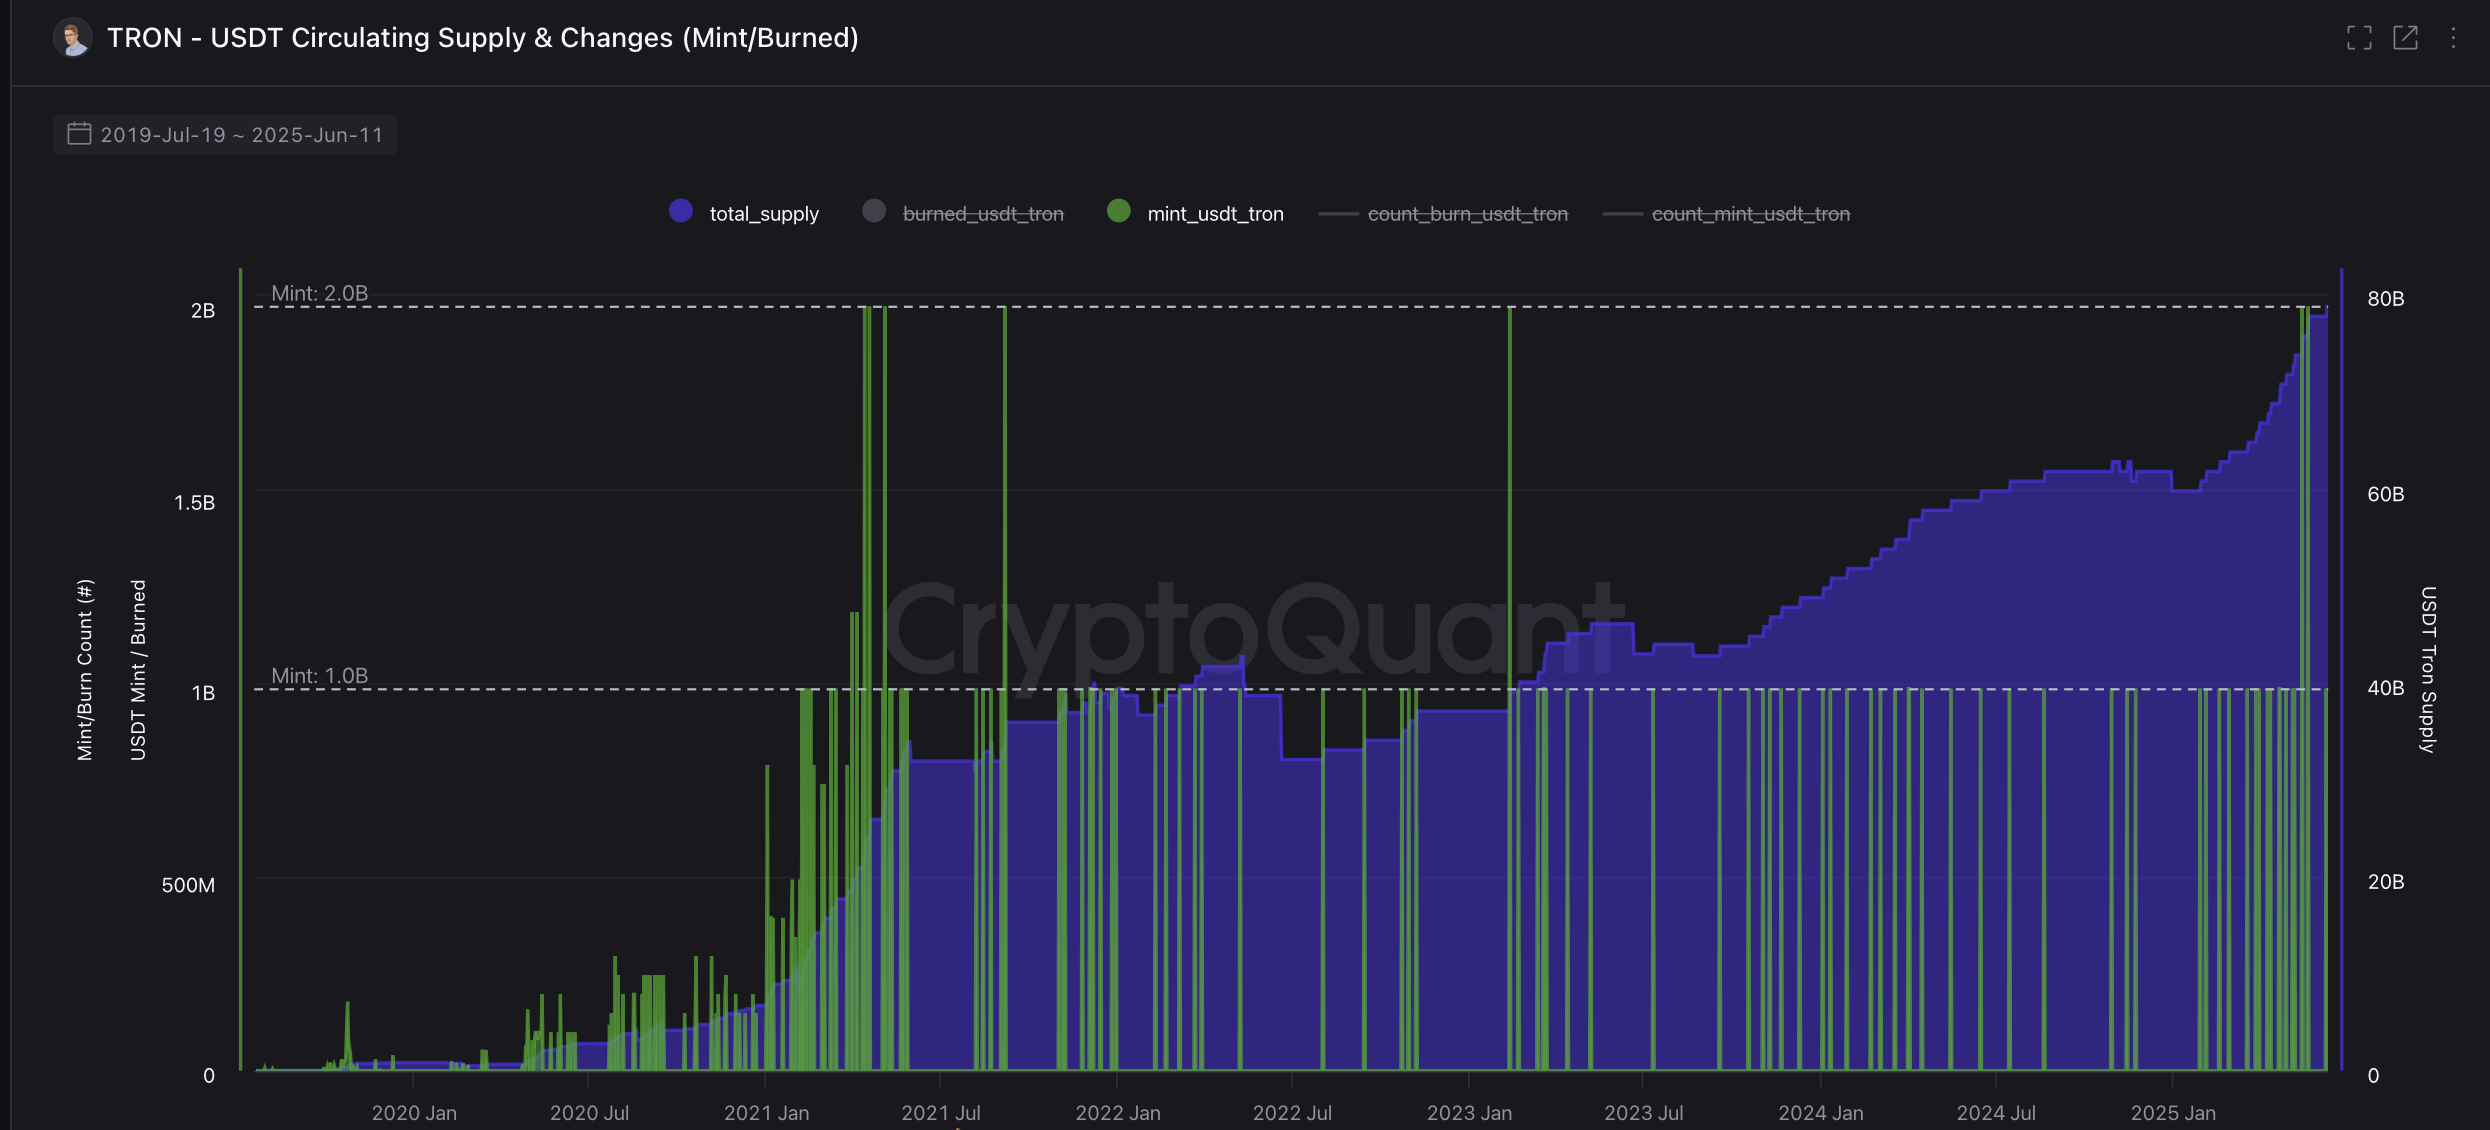
USDT circulating supply and changes on Tron. Source: CryptoQuant
Since its inception, the network has processed over 10.5 billion transactions, with an average daily transaction count of more than 6 million in 2025.
TRX fails $0.30 breakout, pullback warns $0.26 retest
TRX extends its losses by over 1.50% at press time on Thursday after a steep 4.51% correction, creating a bearish engulfing candle, a day before. The bearish reversal springs from the headwinds at $0.30, a key resistance highlighted by a double top pattern in December 2024.
The Relative Strength Index (RSI) drops to 49 in the daily chart, indicating a significant decline in bullish momentum. Crossing below the halfway line, the indicator warns of considerable room for correction before hitting the oversold boundary line.
Further up, the Moving Average Convergence/Divergence (MACD) indicator crosses below its signal line after a recent fake bullish crossover. The recent crossovers indicate uncertainty and increased volatility as TRX fluctuates between key levels.
The declining trend signals a continuation towards the $0.26 support level of a previously formed consolidation range.
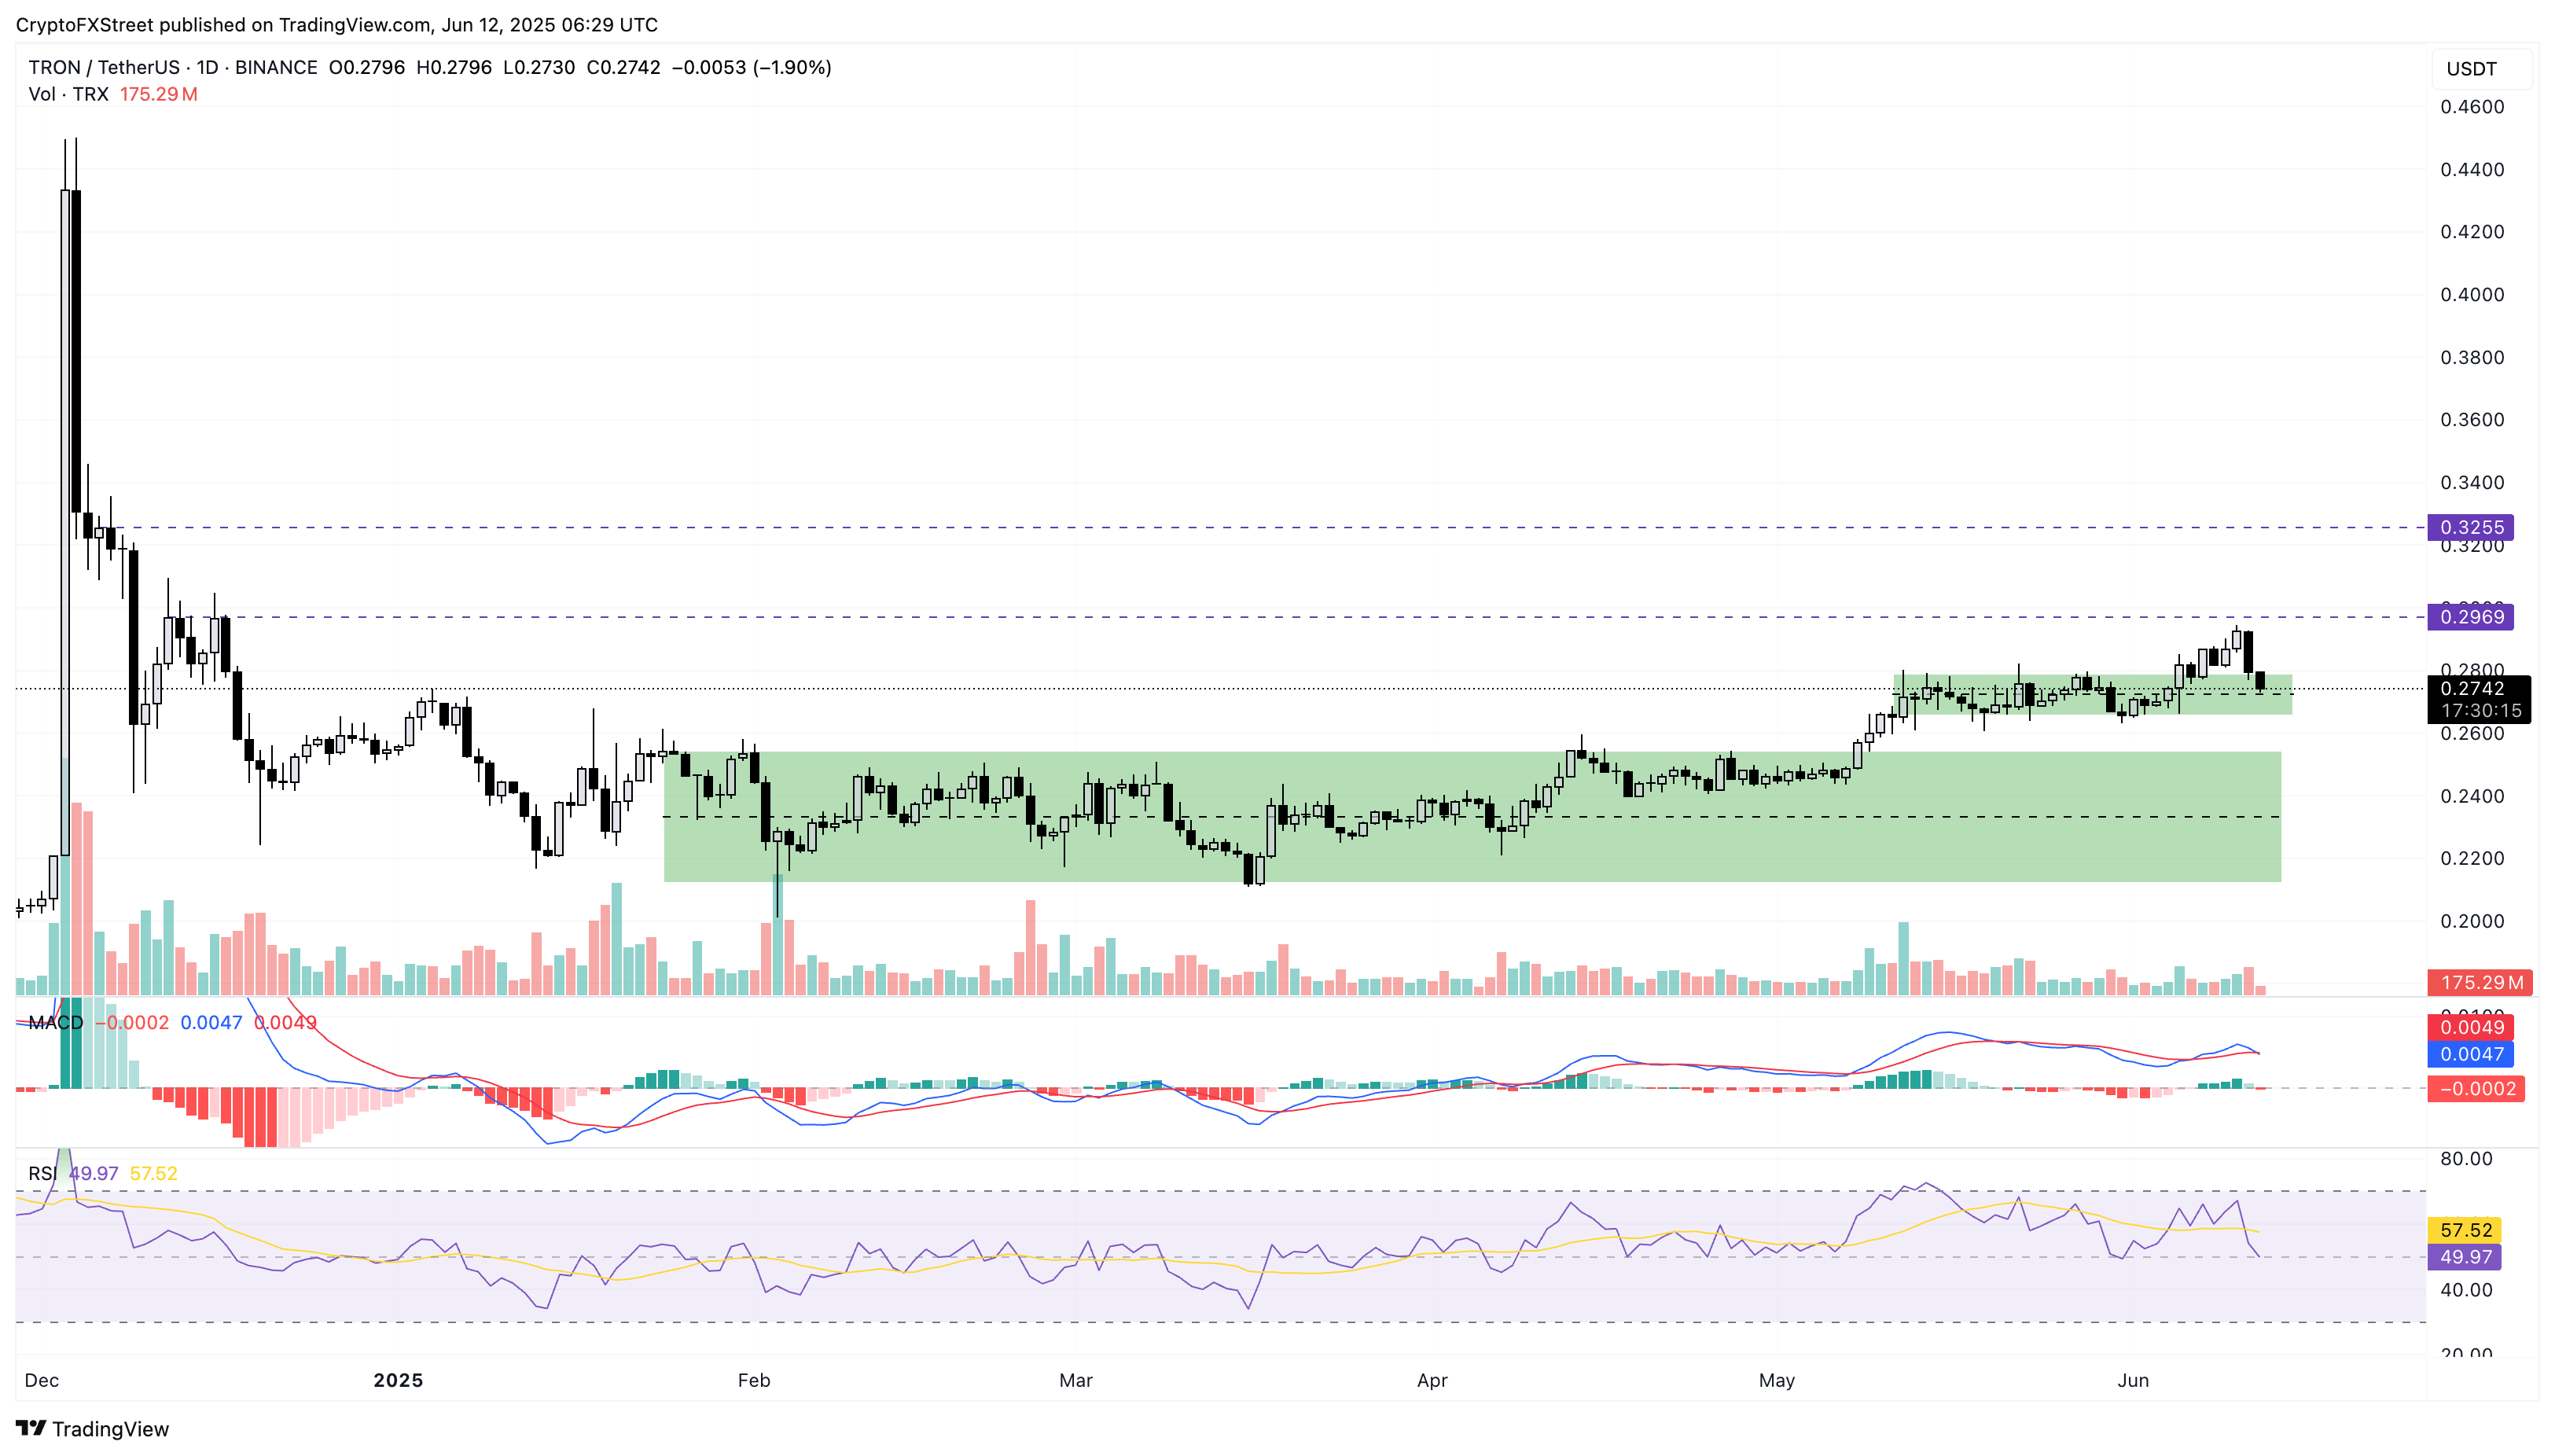
TRX/USDT daily price chart.
However, investors looking to buy Tron could find a closing above $0.28 as a potential signal of buyers retesting the $0.30 resistance.
Artigos Recomendados


