
Top Crypto Gainers: MYX, MNT and WIF rally ahead of Fed's rate decision
- MYX Finance bounces off a crucial support, hinting at an extended recovery.
- Mantle hits record high, with bulls targeting a surge above $1.80.
- Dogwifhat struggles to surpass a key resistance trendline.
MYX Finance (MYX), Mantle (MNT), and Dogwifhat (WIF) emerge as frontrunners as the broader cryptocurrency market recovers ahead of the US Federal Reserve’s decision on interest rates on Wednesday. The technical outlook for MYX and MNT holds a bullish incline, while WIF faces a key resistance trendline.
The 24-hour liquidations have crossed $440 million as the majority of the top 100 cryptocurrencies trade in the green. This highlights a positive shift in investors' mood as the broader financial market anticipates a 25 basis point rate cut at the Federal Open Market Committee (FOMC) meeting.
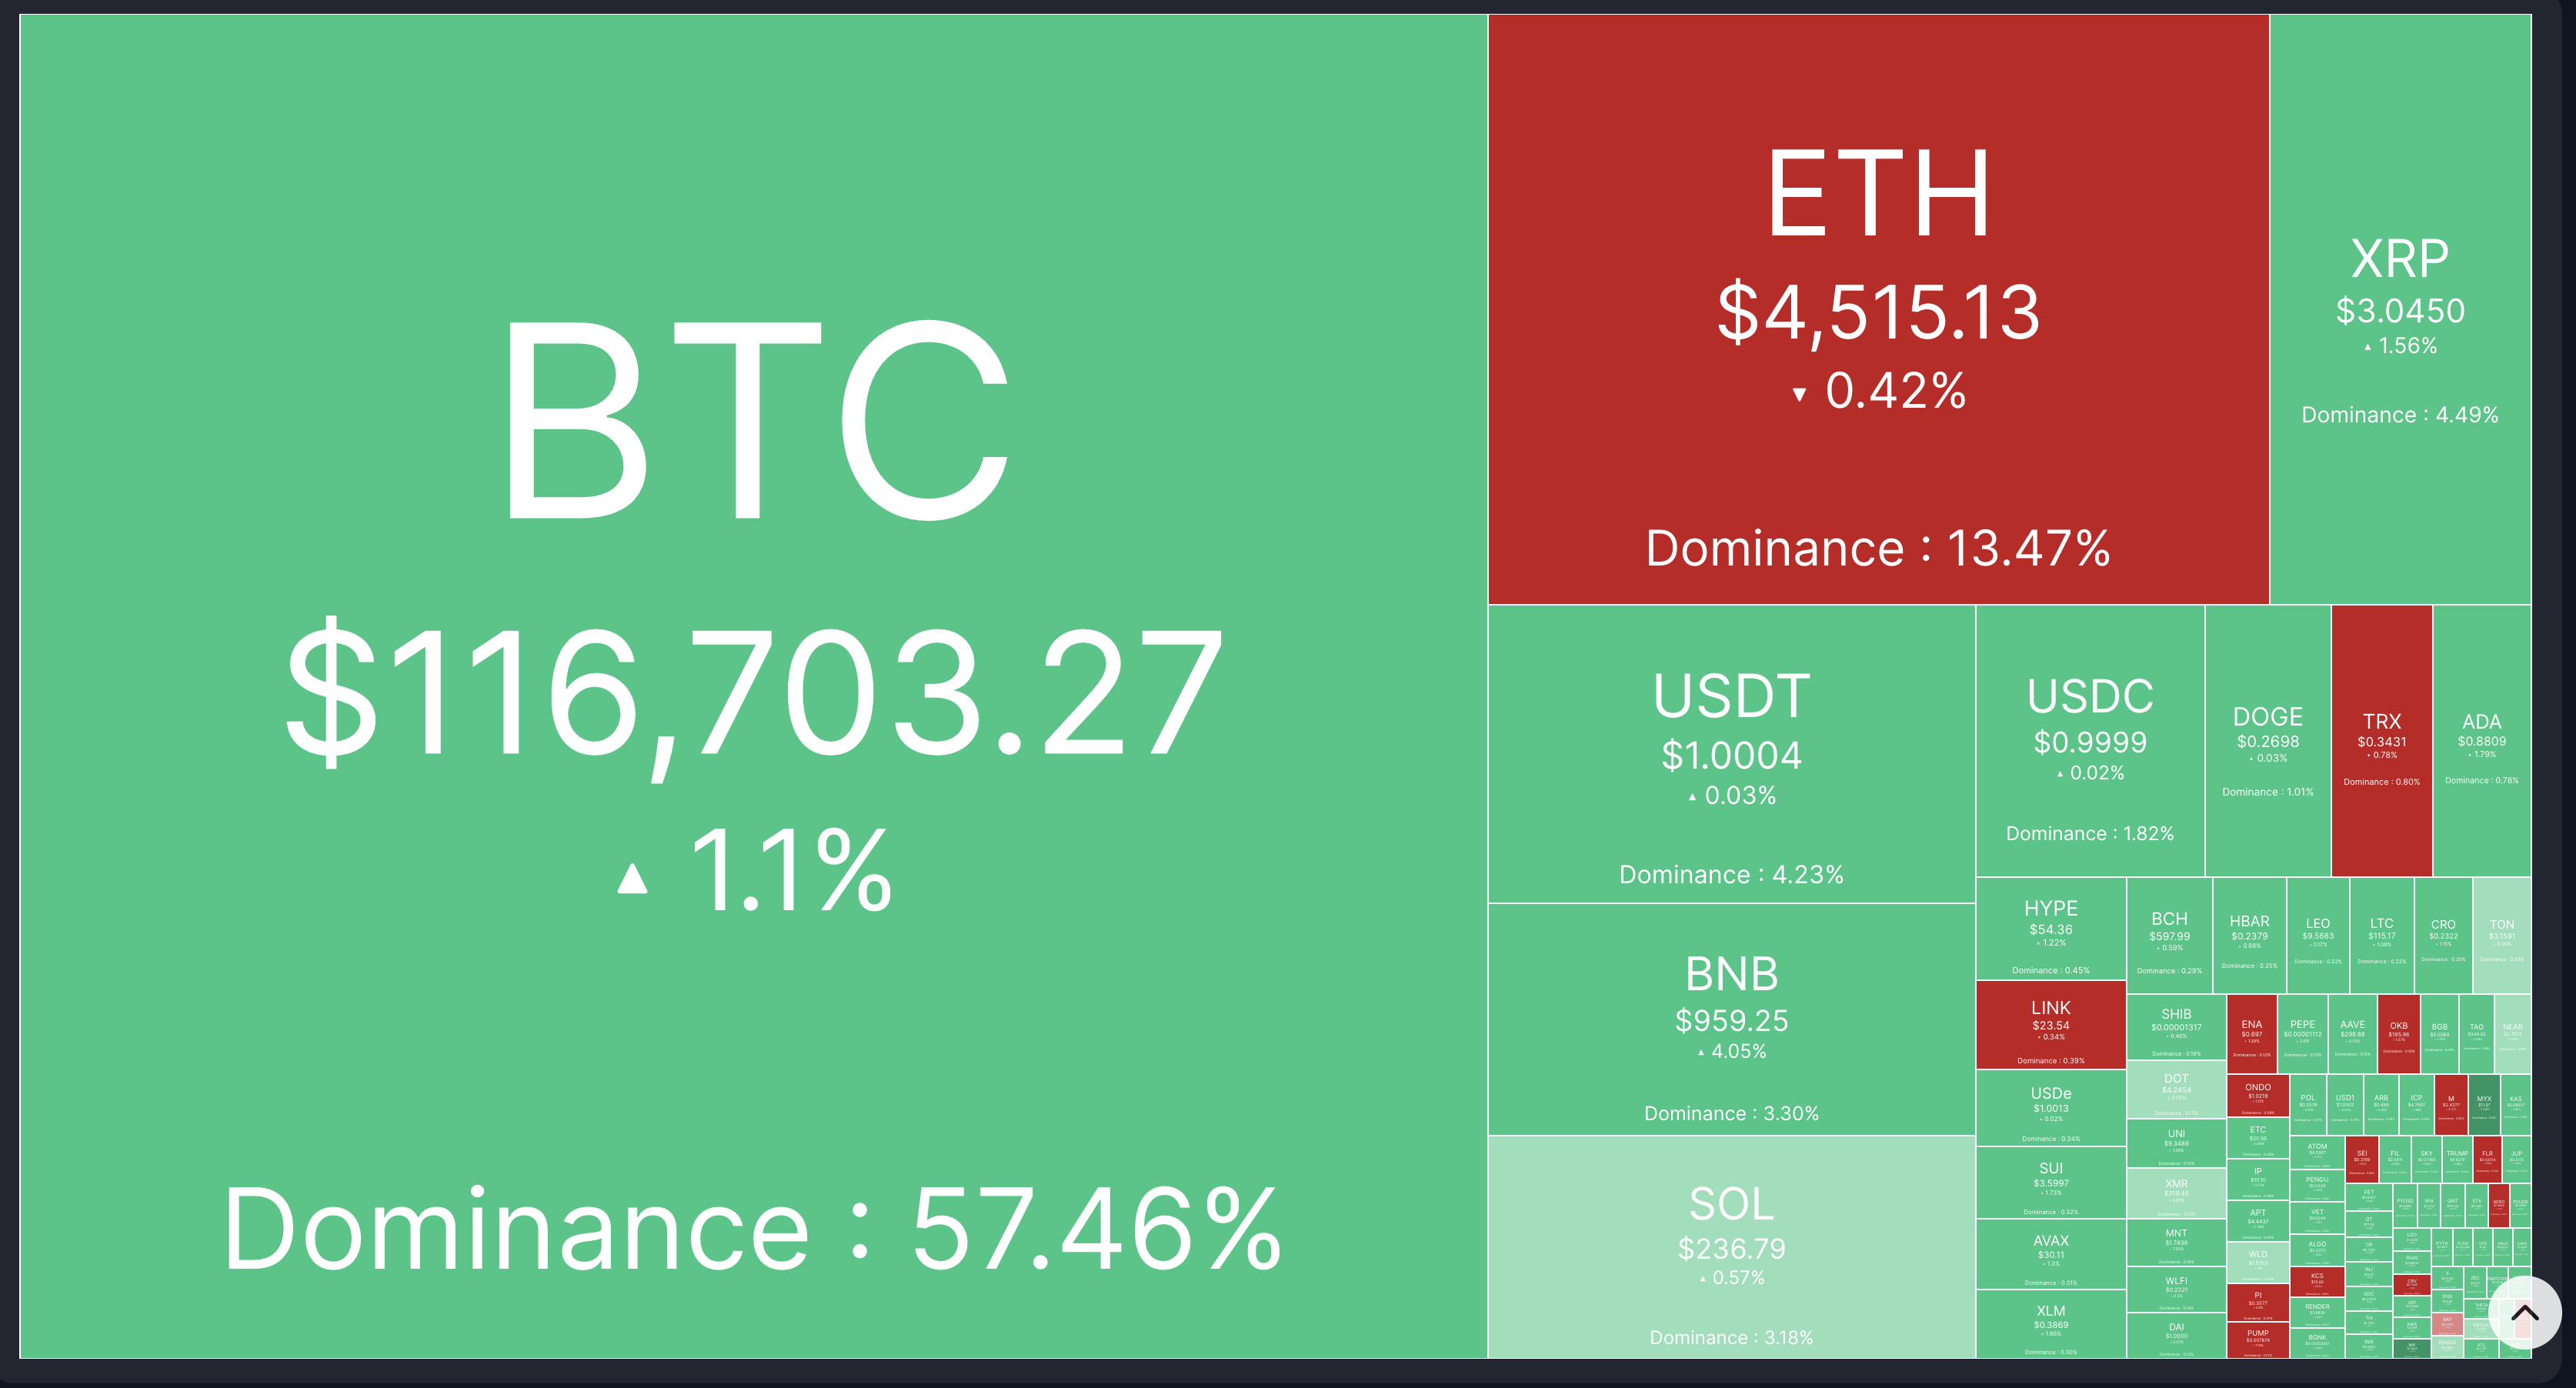
Cryptocurrency market heatmap. Source: CoinMarketCap
MYX Finance reversal gradually gains momentum
MYX Finance edges higher by over 8% at press time on Wednesday, extending the 8% gains from the previous day. The short-term recovery reclaims the $10.00 psychological level following the pullback seen near the end of last week.
MYX recovery targets the $19.00 peak as the buying pressure resurfaces.
Adding to the upside potential, the Relative Strength Index (RSI) at 67, hovering close to the overbought zone, suggests increased bullish momentum. Still, the Moving Average Convergence Divergence (MACD) moving closer to the signal line risks a potential crossover, which would signal a bearish shift.
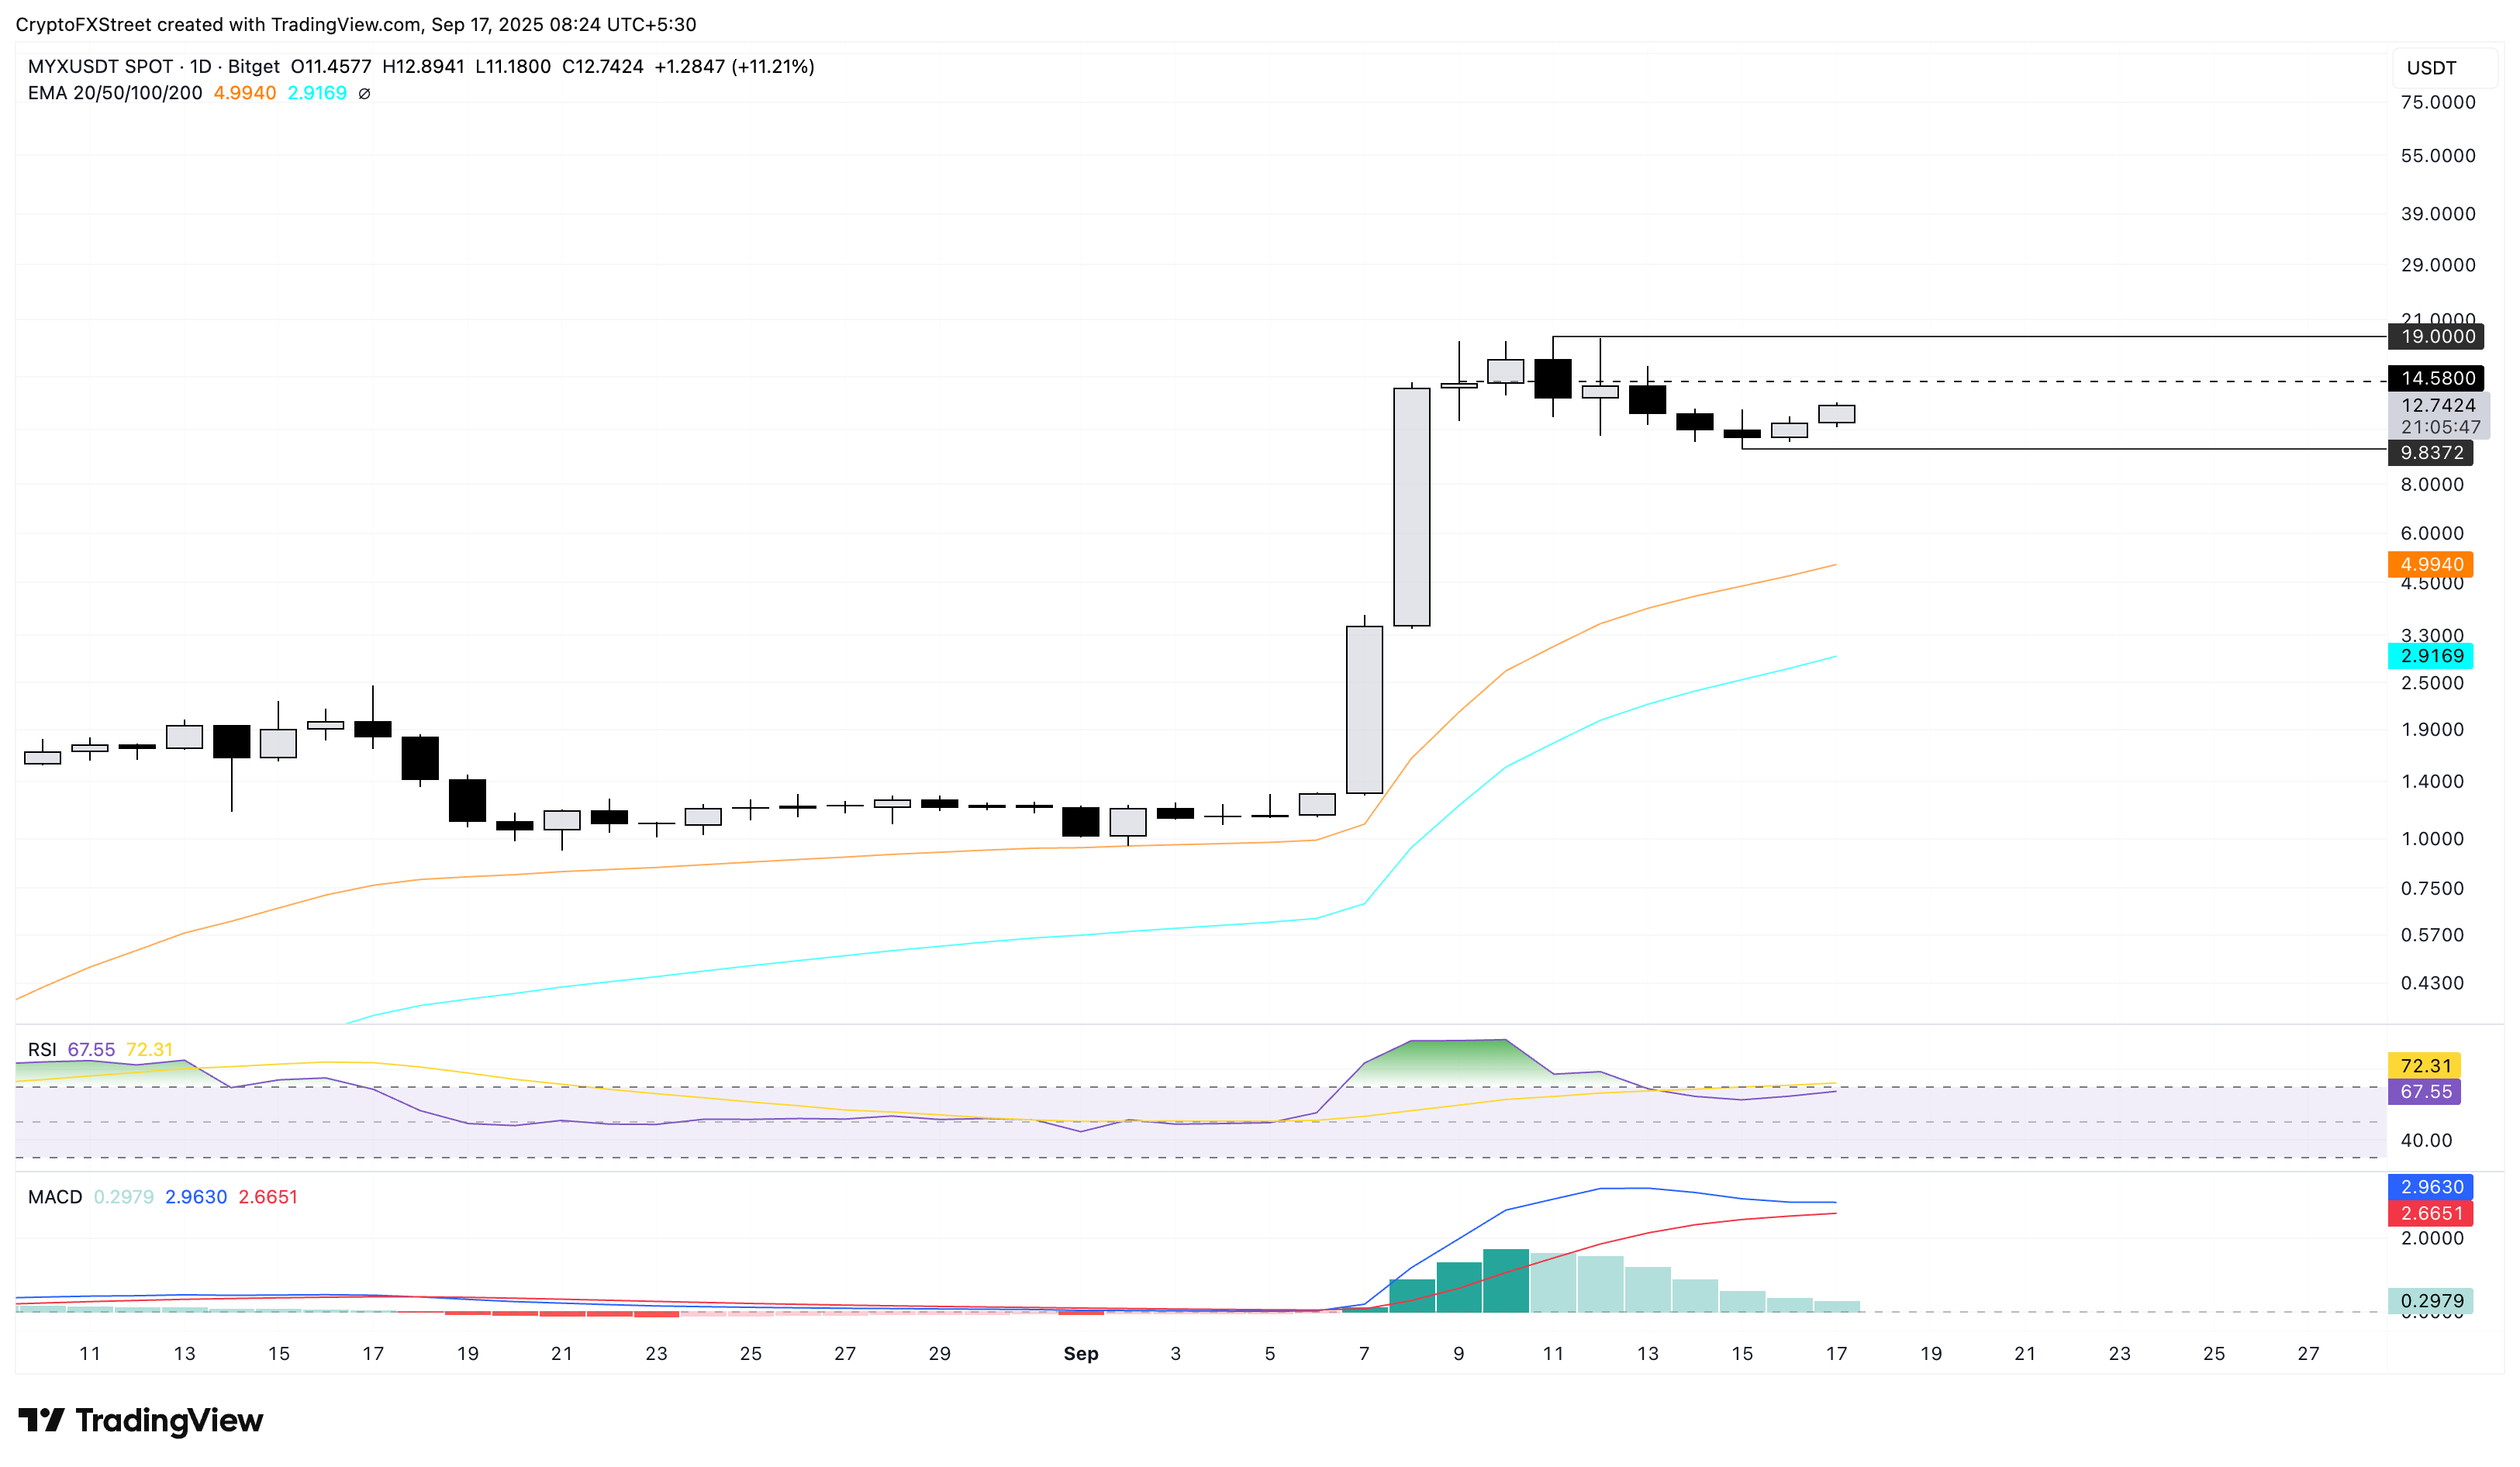
MYX/USDT daily price chart.
On the flip side, if MYX drops below $10.00 support level, it could extend the decline to the 50-day Exponential Moving Average (EMA) at $4.99.
Mantle enters discovery mode for a new all-time high
Mantle trades near $1.70 at the time of writing on Wednesday, retracing from the all-time high of $1.77 from the previous day. MNT targets the R2 pivot level at $1.80 as the immediate resistance.
A clean push above this level could further extend the MNT rally to the R3 pivot level at $2.21.
The RSI at 74 remains in the overbought zone, indicating heightened buying pressure. Additionally, the MACD keeps a steady uptrend with its signal line, indicating a bullish trend in motion.
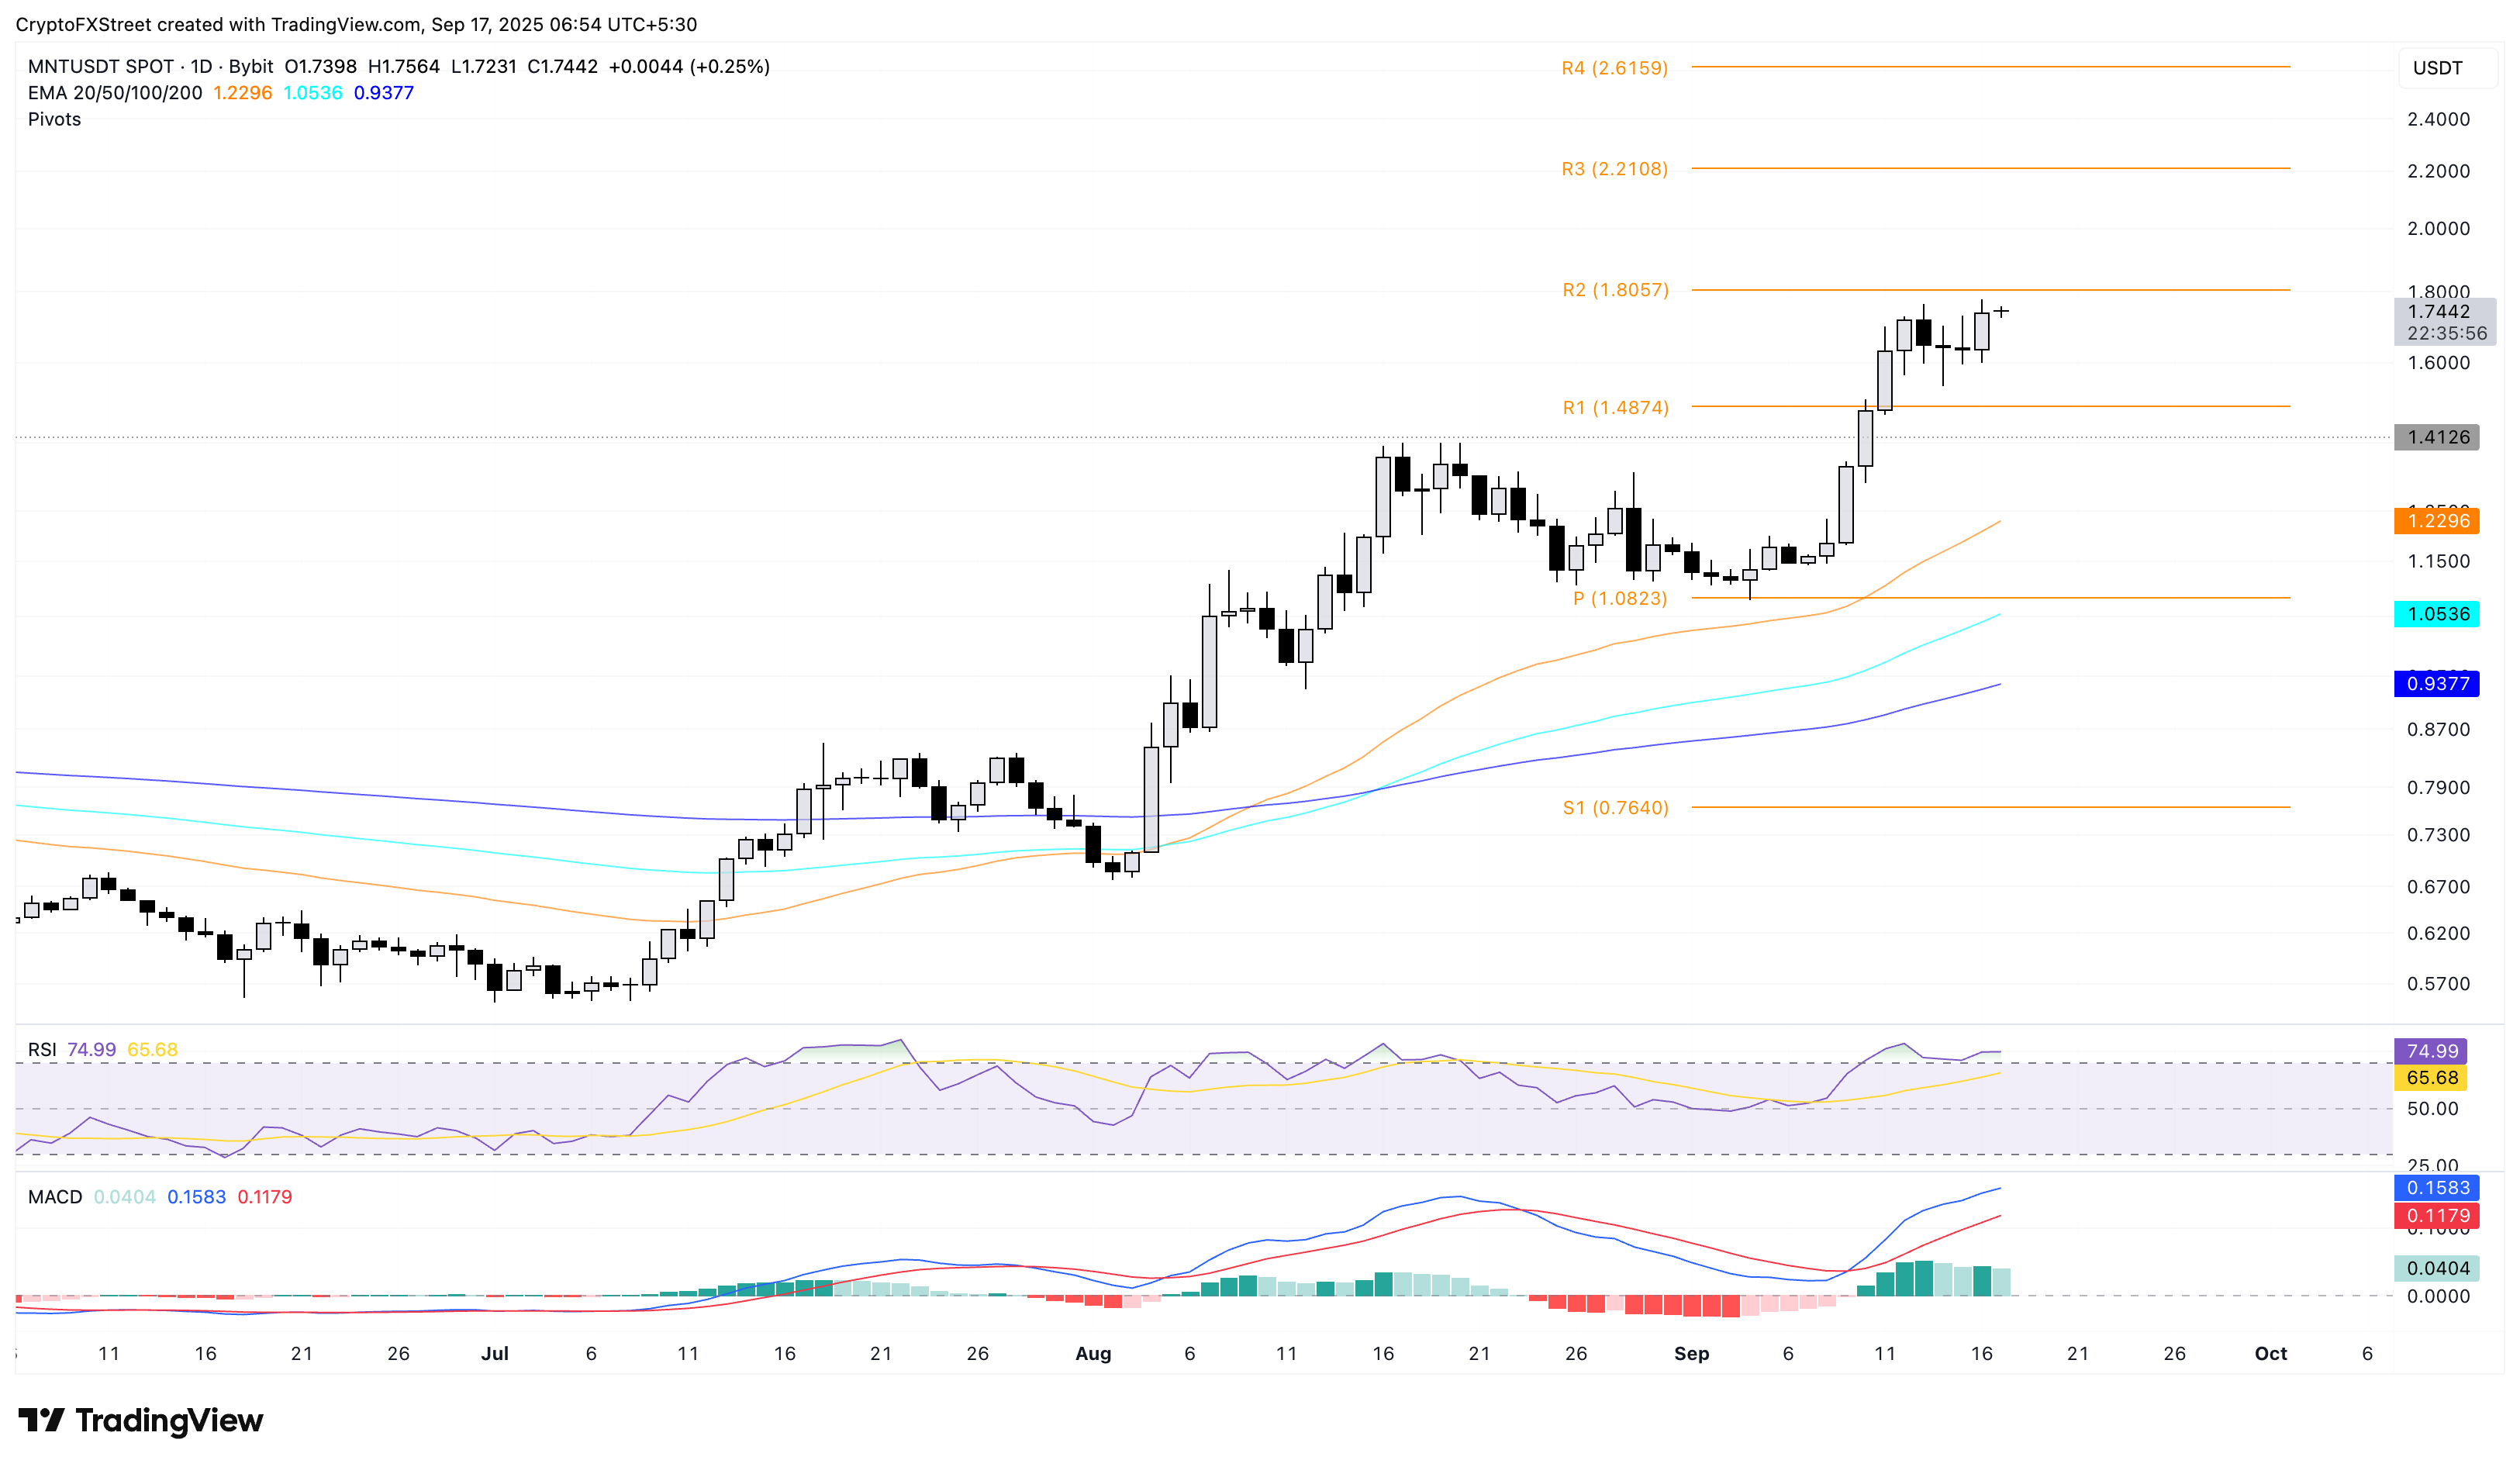
MNT/USDT daily price chart.
On the downside, if Mantle flips from the $1.80 level, the R1 pivot level, resistance turned support, at $1.48, could absorb the supply pressure.
Dogwifhat hits a key resistance trendline
Dogwifhat edges lower by under 1% at press time on Wednesday, from a key resistance trendline formed by connecting the November 13, 2024, and July 21, 2025 peaks on the daily chart. The 200-day EMA at $0.995 moves close to this resistance trendline, adding another obstacle to the potential uptrend.
A decisive close above this dynamic resistance at $0.995 could boost the WIF rally to the 50% retracement level at $1.212, drawn from the November 13, 2024, peak of $4.830 to the April 9, 2025, low of $0.304.
Adding to the breakout chances, the momentum indicators suggest a bullish bias in the trend momentum as the RSI at 57 bounces off the halfway line. At the same time, the uptrending MACD and its signal line have crossed above the zero level.
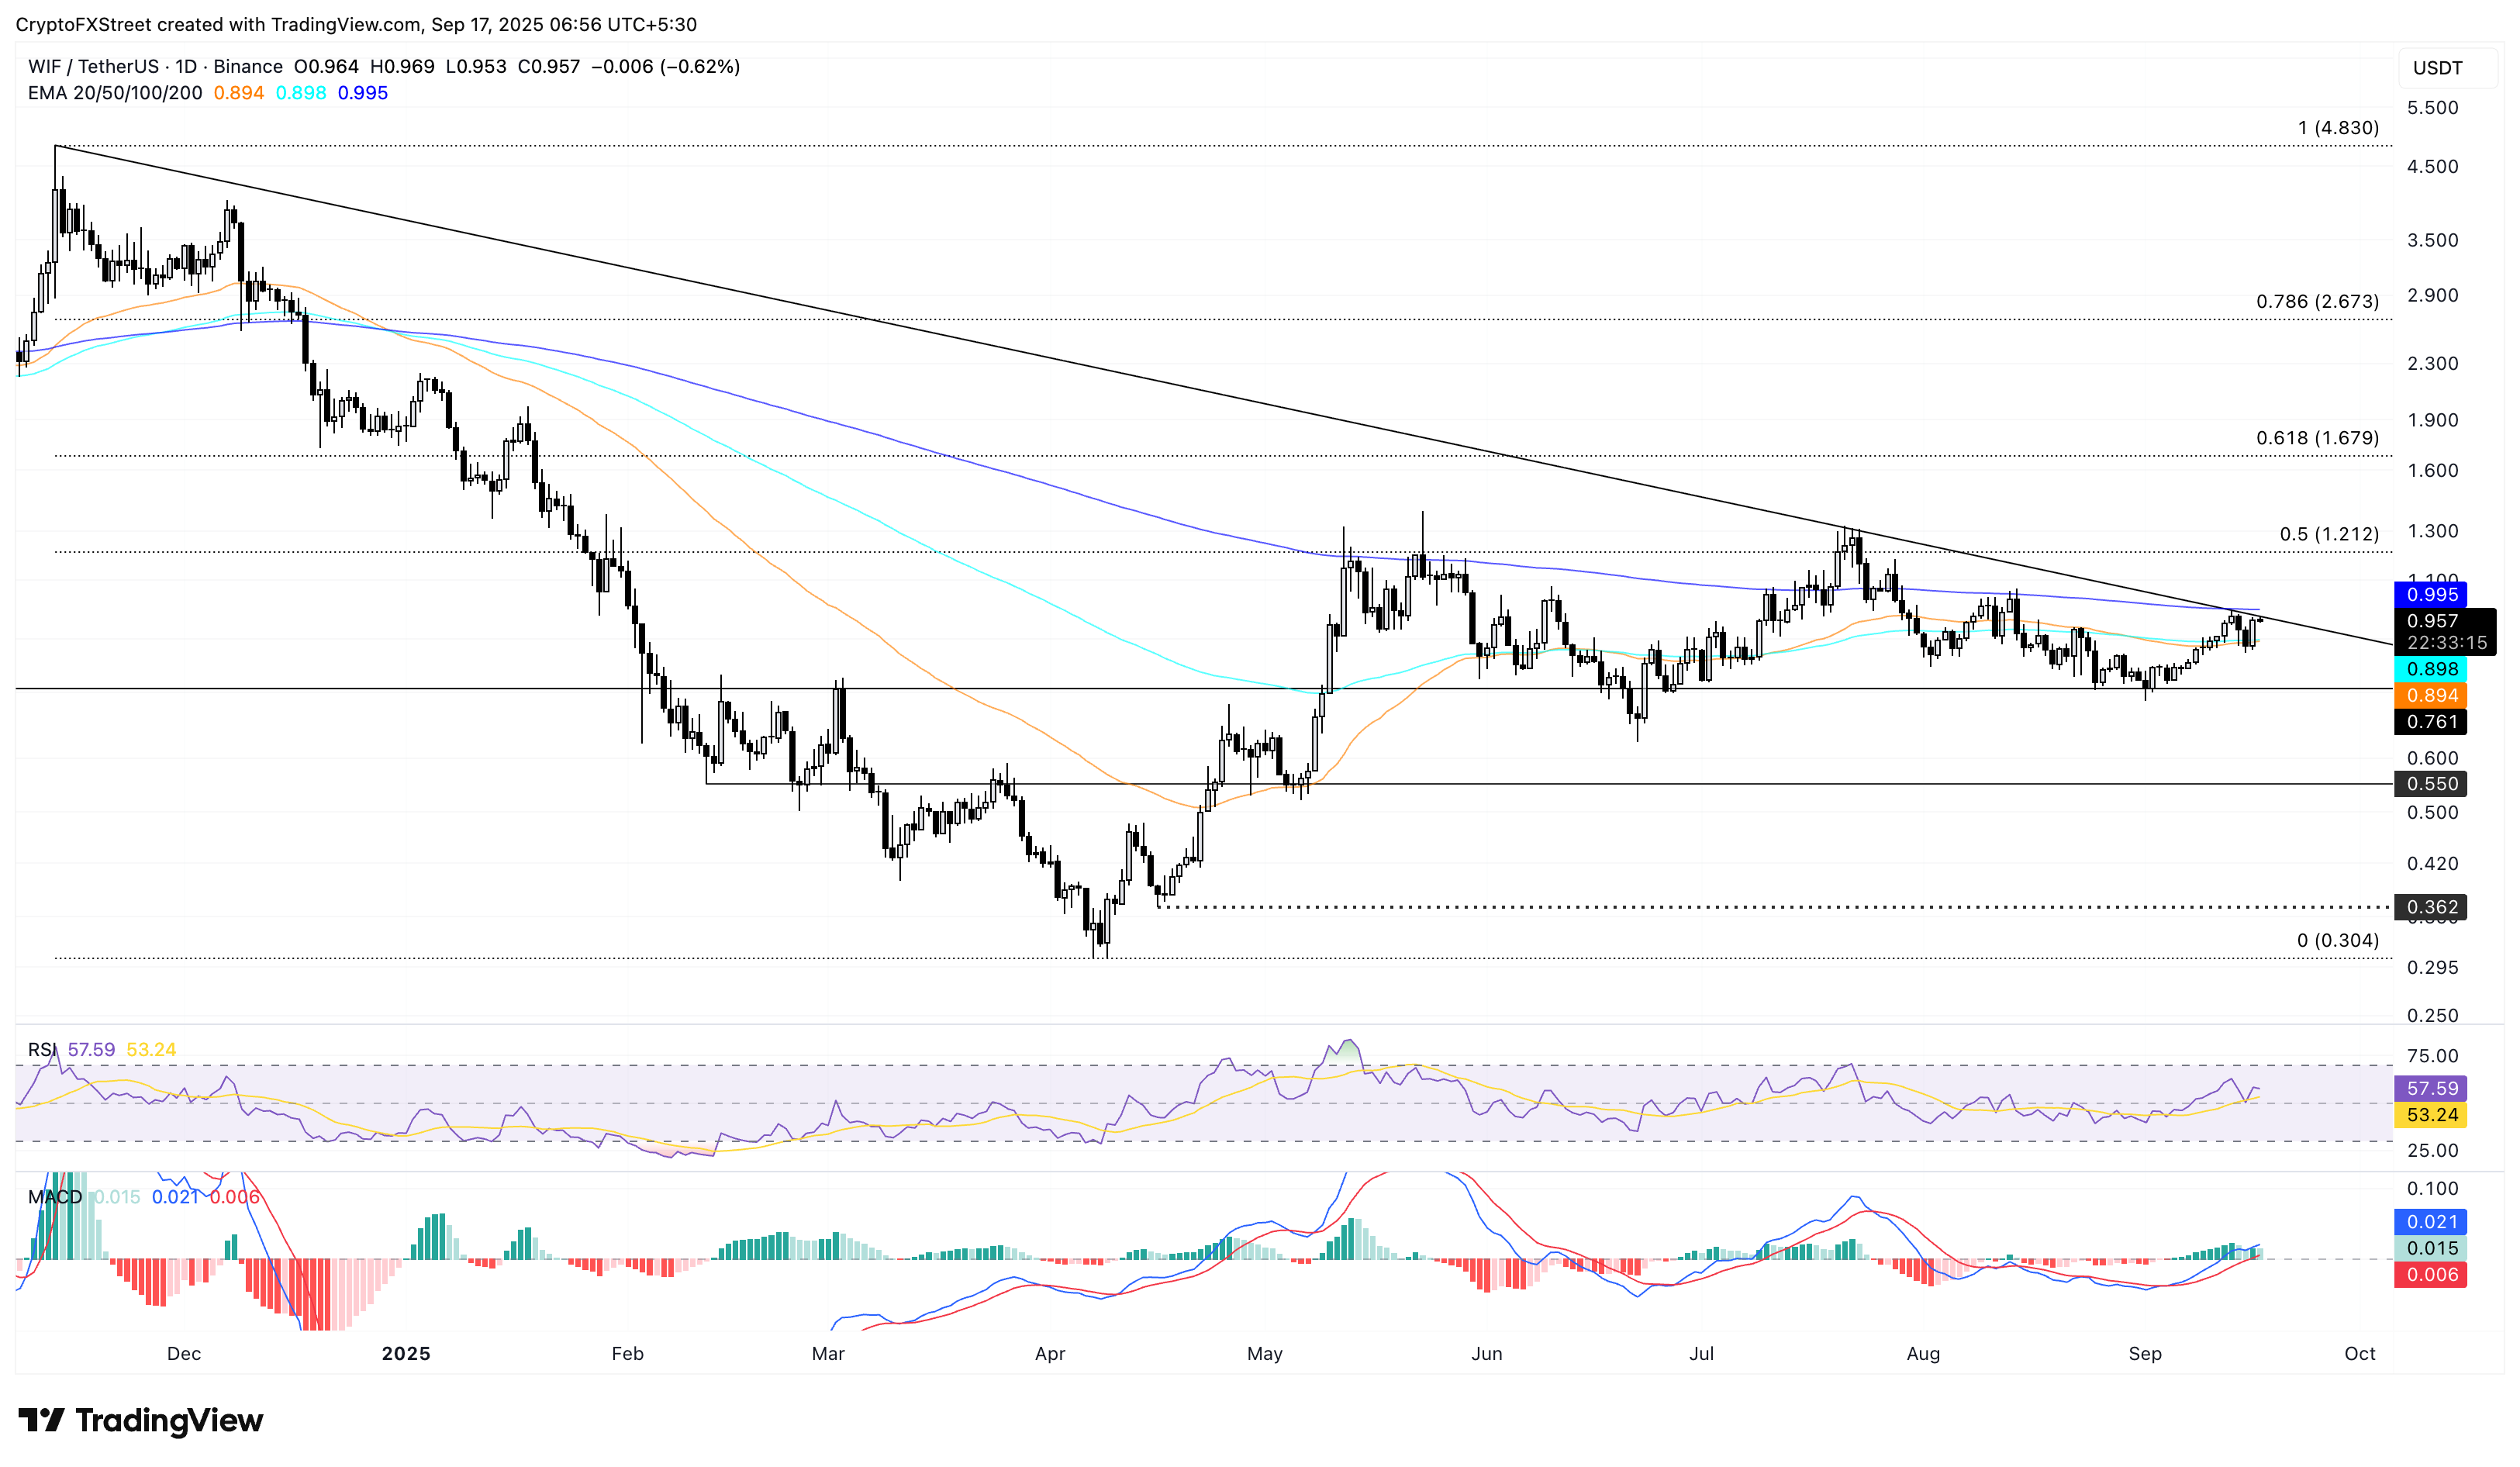
WIF/USDT daily price chart.
On the contrary, if WIF fails to surpass the overhead trendline, a potential reversal could retest the 50-day EMA at $0.894.
Artigos Recomendados


