
Litecoin Price Forecast: LTC’s new wallet with MWEB integration set to make privacy a default feature
- Litecoin price breaks above falling wedge, signaling a potential rally ahead.
- The Litecoin Foundation, in collaboration with AmericanFortress, announces the launch of a new privacy-focused wallet with MWEB integration.
- Santiment data showed that LTC transaction volume surged to 122.64 million, the highest level since June 2023.
Litecoin (LTC) is trading slightly down at around $111.90 at the time of writing on Tuesday, after breaking above the falling wedge pattern, which favors a bullish outlook. The announcement of a new wallet integration on Monday, featuring MimbleWimble Extension Blocks (MWEB), makes privacy a default feature for Litecoin, fueling some optimism. On-chain data highlights a surge in transaction volume, reaching its highest level since June 2023.
Litecoin is set to launch a new wallet with focus on privacy
Litecoin Foundation, in partnership with AmericanFortress, announced on Monday the launch of a new Litecoin-native (LIT) wallet, focusing on privacy. The wallet is set to launch in September and will integrate MWEB, FortressNames, and c-filtering, providing an intuitive UX and bulletproof privacy. This announcement enhances the privacy infrastructure of Litecoin, as privacy remains a key concern for cryptocurrency holders.

Litecoin sees boost from increasing network usage, growing miner confidence
Litecoin’s on-chain data provides further support for the bullish outlook. According to Santiment, daily transactions have spiked from 105.12 million on Sunday to 122.67 million on Monday, the highest year-to-date (YTD) and level not seen since June 2023, suggesting renewed network activity and growing user participation.
 [08-1757389848121-1757389848122.53.34, 09 Sep, 2025].png)
Litecoin transactions volume chart. Source: Santiment
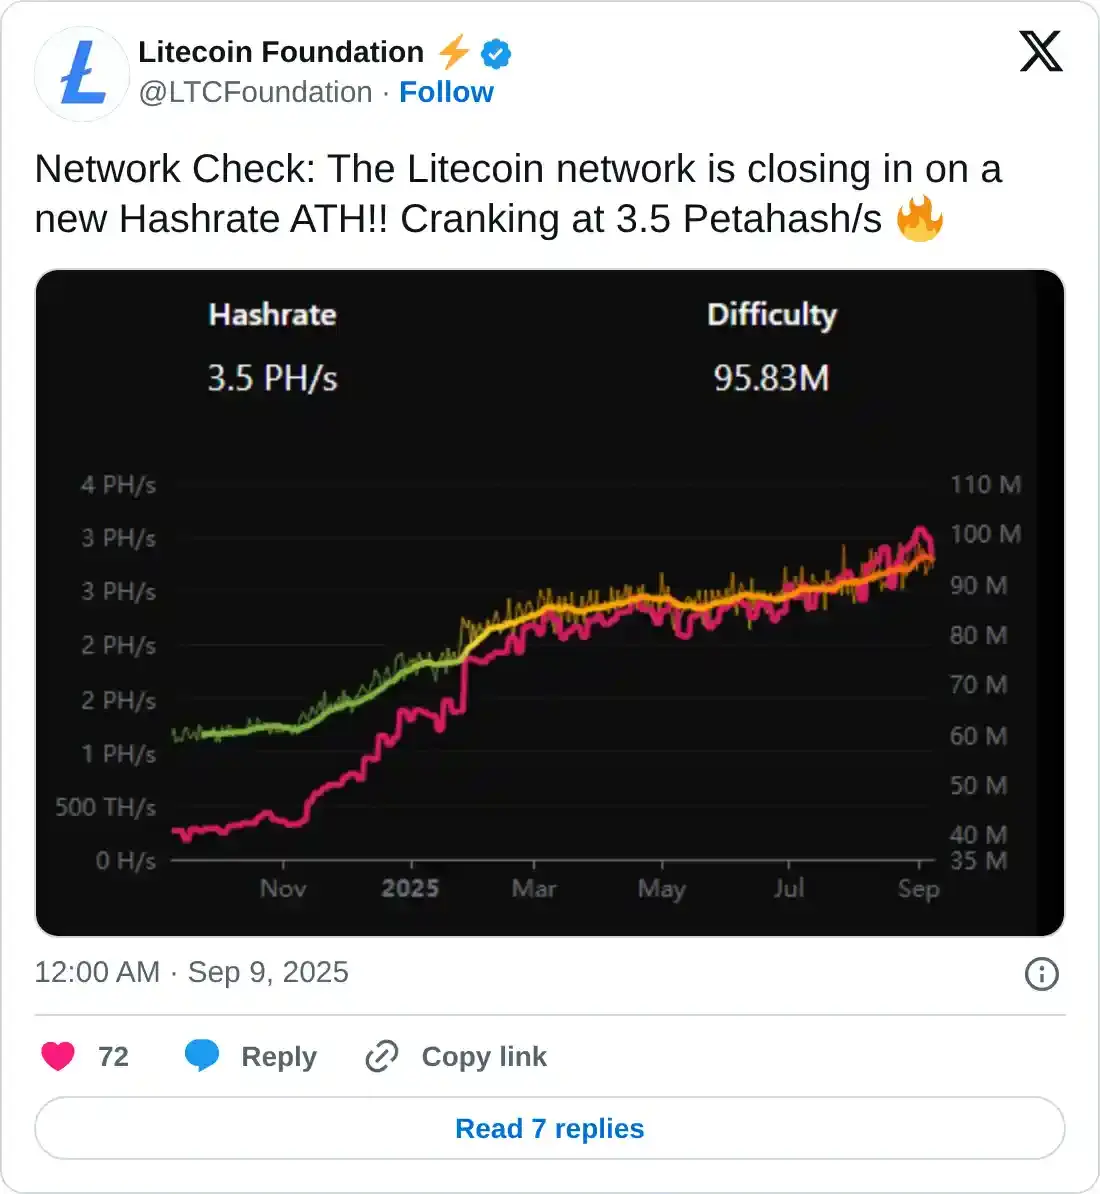
Apart from these, the Litecoin network is closing in on a new Hash Rate of 3.5 Petahash/s, setting new record highs that signal stronger network security and growing miner confidence in the ecosystem.
Litecoin Price Forecast: LTC breaks above the falling wedge pattern
Litecoin price broke above the falling wedge pattern (formed by connecting multiple highs and lows with two trendlines since early August) on Sunday, and a breakout favors the bulls. At the start of this week, on Monday, LTC declined slightly by 1.87%. At the time of writing on Tuesday, it continues to trade down, nearing its upper trendline boundary of the pattern.
If LTC finds support around the upper trendline boundary of the falling wedge and rebounds, it could extend the rally toward its August 14 high of $134.29.
The Relative Strength Index (RSI) on the daily chart is slipping below its neutral level of 50, indicating early signs of bearish momentum. For the bullish momentum to be sustained, the RSI must move above its neutral level. However, the Moving Average Convergence Divergence (MACD) lines are about to flip a bullish crossover, signalling a possible bullish momentum ahead.
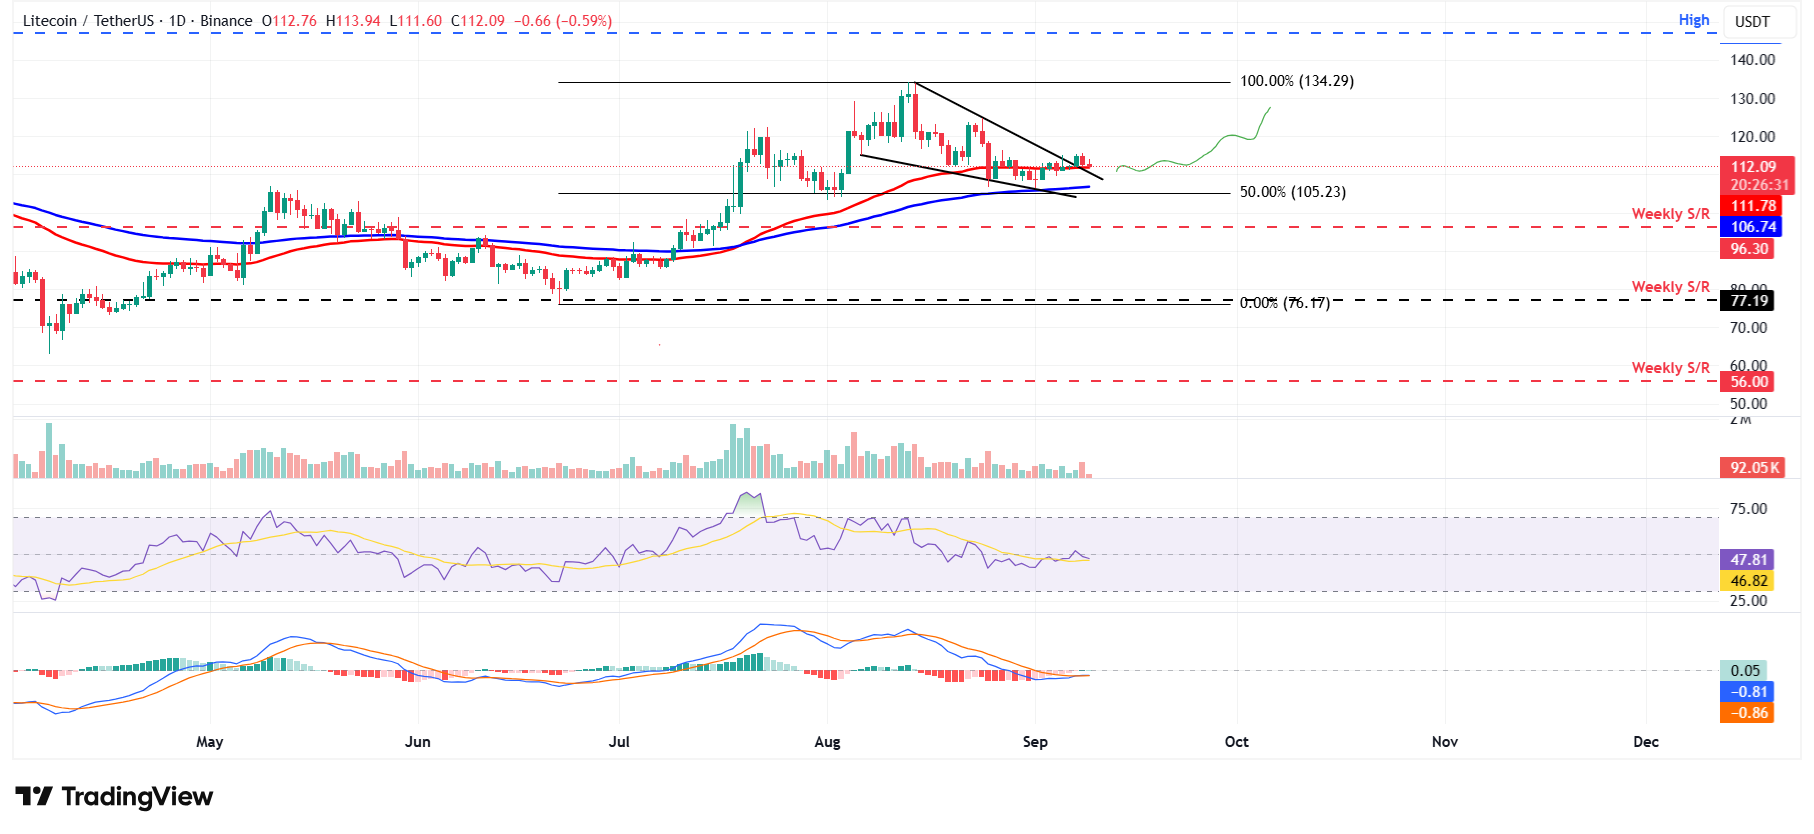
LTC/USDT daily chart
However, LTC faces a correction, which could extend the decline toward its 100-day Exponential Moving Average (EMA) at $106.74.
Artigos Recomendados


