
EUR/USD snaps losing streak, but market clouds continue to gather
- EUR/USD rose 0.4% on Thursday, snapping a six-day losing streak.
- Fiber has drawn dangerously close to the 200-day EMA, signaling a potential reversal.
- Key US inflation data looms ahead, just before tariffs are due to kick in.
EUR/USD caught a breather on Thursday, rising by four-tenths of one percent and snapping a six-day losing streak that saw Fiber shed 2% peak-to-trough. Tariff concerns continue to bubble away close to the center of investors’ attention spans, but Thursday saw some brief relief after US President Donald Trump focused elsewhere for the day, rather than ramping up a fresh batch of tariff proclamations via social media.
US GDP for Q4 2024 grew by 2.4%, surpassing expectations of 2.3%. However, Moody’s warned that higher tariffs and tax cuts may significantly increase government deficits and potentially downgrade US debt ratings, leading to higher Treasury yields.
S&P Global cautioned that US policy uncertainty could hinder global growth, while Fitch Ratings indicated that current tariffs might severely impact smaller economies like Brazil, India, and Vietnam, complicating their ability to purchase US goods. The CBO reduced its 2025 GDP forecast to 1.9%, predicting that this growth rate will persist through 2035, with inflation slowing to a near halt by 2025. They also foresee the budget deficit rising to 7.3% of GDP in 2025 without policy adjustments and that interest payments could consume 5.4% of GDP by 2055.
This week’s key US data release will be Core Personal Consumption Expenditure Price Index (PCE) inflation due on Friday. Investors will be hoping that a recent upturn in inflation figures will prove to be temporary, but median forecasts are expecting annualized PCE inflation to rise to 2.7% YoY in February.

EUR/USD price forecast
With Fiber’s near-term losing streak broken, EUR/USD bidders will be looking to push prices back above the current target at the 1.0900 handle. Fiber lost its foothold on the key technical level, but buyers managed to stop the bleed, at least for now.
Price action is still churning chart paper just north of the 200-day Exponential Moving Average (EMA) near 1.0700. If technical support breaks and selling pressure begins to dominate, it’s a long fall to the last swing low near 1.0350.
EUR/USD daily chart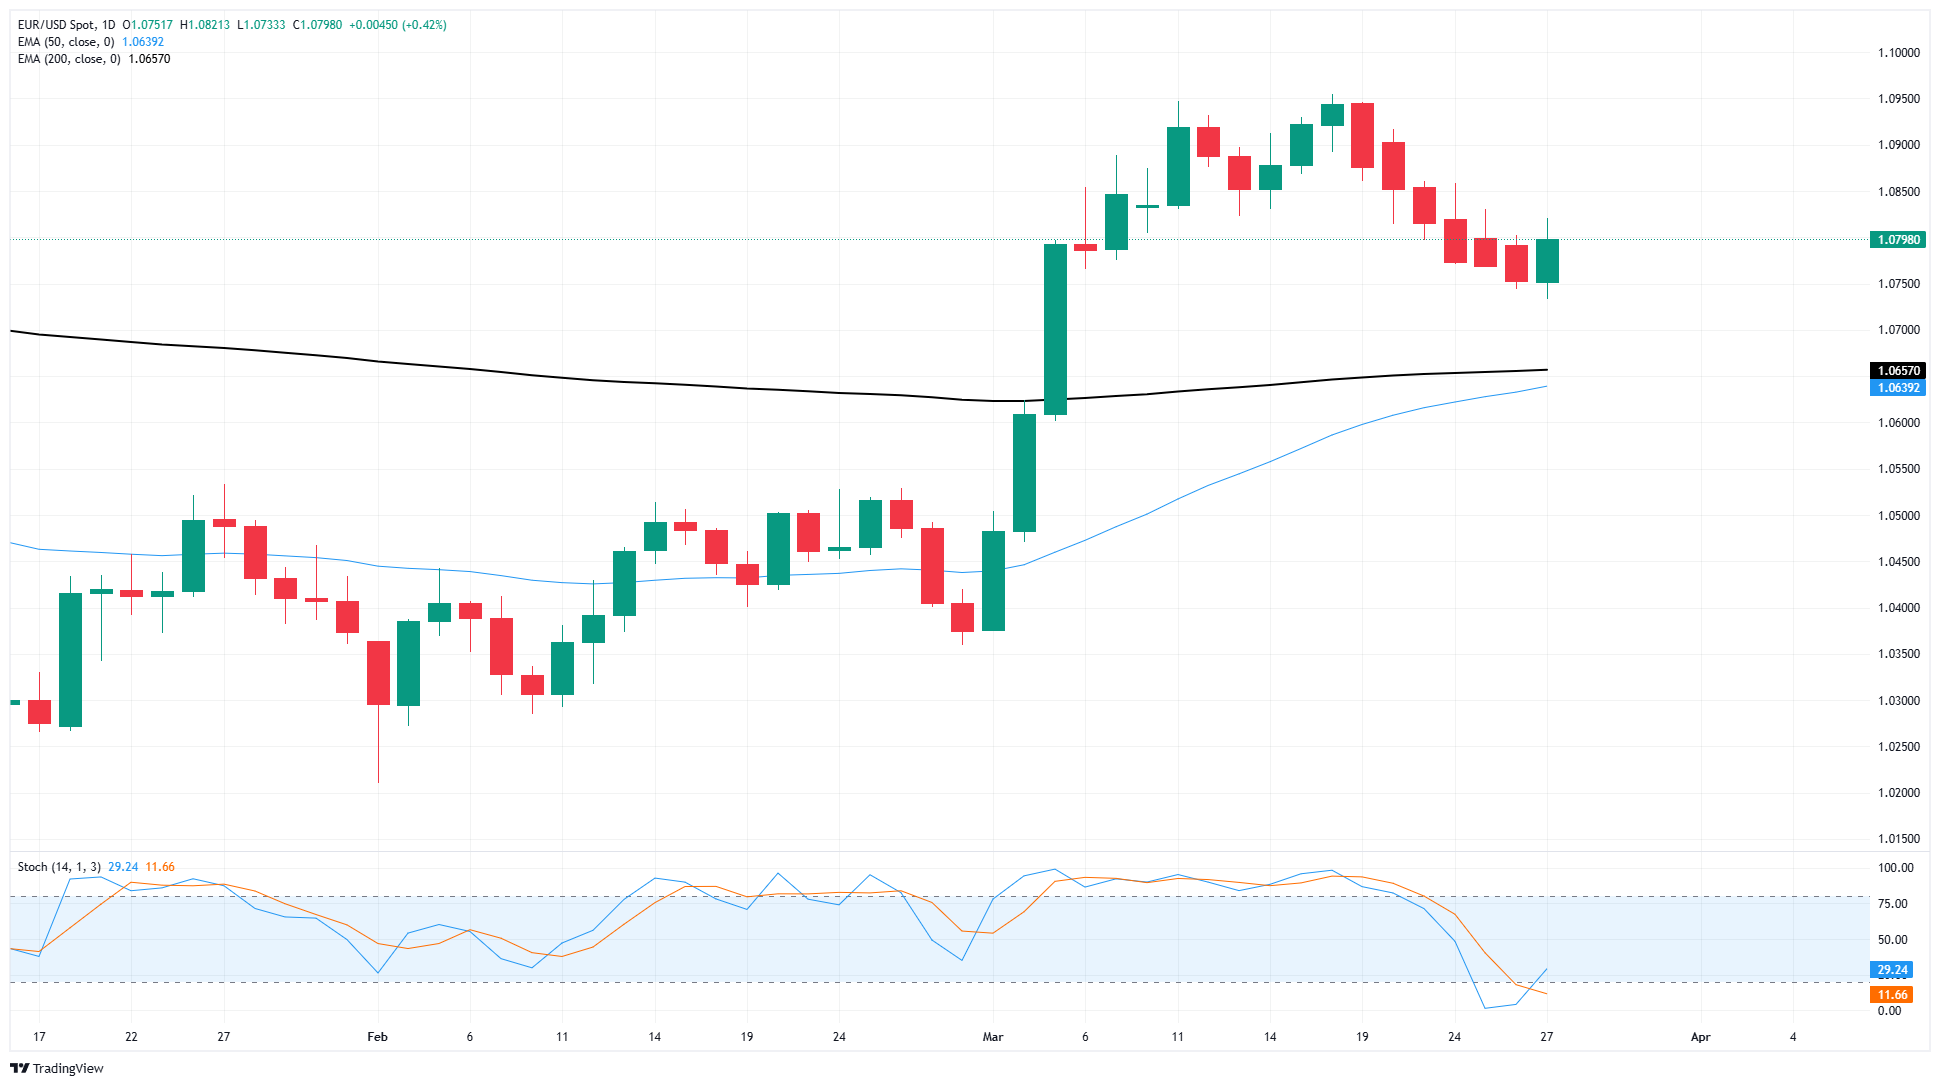
Euro FAQs
The Euro is the currency for the 19 European Union countries that belong to the Eurozone. It is the second most heavily traded currency in the world behind the US Dollar. In 2022, it accounted for 31% of all foreign exchange transactions, with an average daily turnover of over $2.2 trillion a day. EUR/USD is the most heavily traded currency pair in the world, accounting for an estimated 30% off all transactions, followed by EUR/JPY (4%), EUR/GBP (3%) and EUR/AUD (2%).
The European Central Bank (ECB) in Frankfurt, Germany, is the reserve bank for the Eurozone. The ECB sets interest rates and manages monetary policy. The ECB’s primary mandate is to maintain price stability, which means either controlling inflation or stimulating growth. Its primary tool is the raising or lowering of interest rates. Relatively high interest rates – or the expectation of higher rates – will usually benefit the Euro and vice versa. The ECB Governing Council makes monetary policy decisions at meetings held eight times a year. Decisions are made by heads of the Eurozone national banks and six permanent members, including the President of the ECB, Christine Lagarde.
Eurozone inflation data, measured by the Harmonized Index of Consumer Prices (HICP), is an important econometric for the Euro. If inflation rises more than expected, especially if above the ECB’s 2% target, it obliges the ECB to raise interest rates to bring it back under control. Relatively high interest rates compared to its counterparts will usually benefit the Euro, as it makes the region more attractive as a place for global investors to park their money.
Data releases gauge the health of the economy and can impact on the Euro. Indicators such as GDP, Manufacturing and Services PMIs, employment, and consumer sentiment surveys can all influence the direction of the single currency. A strong economy is good for the Euro. Not only does it attract more foreign investment but it may encourage the ECB to put up interest rates, which will directly strengthen the Euro. Otherwise, if economic data is weak, the Euro is likely to fall. Economic data for the four largest economies in the euro area (Germany, France, Italy and Spain) are especially significant, as they account for 75% of the Eurozone’s economy.
Another significant data release for the Euro is the Trade Balance. This indicator measures the difference between what a country earns from its exports and what it spends on imports over a given period. If a country produces highly sought after exports then its currency will gain in value purely from the extra demand created from foreign buyers seeking to purchase these goods. Therefore, a positive net Trade Balance strengthens a currency and vice versa for a negative balance.
Artigos Recomendados


