
GBP/USD pulls back towards 1.34 as Trump softens China rhetoric, US Dollar recovers
- GBP/USD dives as Trump signals tariffs on China are “not sustainable,” but reassures a fair trade deal is coming.
- UK GDP rises 0.1% in August, though weak jobs data fuels BoE rate-cut expectations.
- Markets fully price a 25-bps Fed cut in October; shutdown and credit concerns cloud outlook.
The GBP/USD retreats on Friday after hitting its highest level in a week of 1.3471 after US President Donald Trump revealed that elevated tariffs on China are not sustainable. Consequently, the Greenback printed gains as reflected by the pair, trading above the 1.34 handle down 0.12%.
Sterling slips after weekly highs as Fed easing bets and US shutdown dominate sentiment
Trump said that on an interview with Fox Business. He added, “I think we’re going to be fine with China, but we have to have a fair deal. It’s got to be fair,” and revealed that he would meet his Chinese counterpart Xi Jinping in South Korea in two weeks.
in the meantime, the US government shutdown extended to its seventeenth day, as an agreement between the White House and the Democrats, seem far at the time of writing.
Meanwhile, two US regional banks disclosed issues with fraudulent loans, igniting concerns about a credit crisis.
Across the pond, Sterling rose to a weekly high, on expectations that the Federal Reserve would resume its easing cycle, following dovish remarks by Jerome Powell on Tuesday.
Markets have fully priced in a 25-basis-point rate cut at the Federal Reserve’s October meeting, with just a 1% probability assigned to a larger 50-bps reduction, according to the CME FedWatch Tool.
Data in the UK, showed that the economy grew 0.1% in August, after contracting -0.1% in July, revealed the Office for National Statistics (ONS). Britain jobs data increased the chances for seeing the Bank of England cutting rates, following a slowdown in gage growth, an indication that the labor market is weakenin and that inflation could resume its downward path.
Traders are assigning a 44% probability to a 25-basis-point rate cut by the Bank of England in December, with full expectations for an easing move by March 2026. Markets also anticipate cumulative cuts totaling around 53 basis points by the end of 2026.
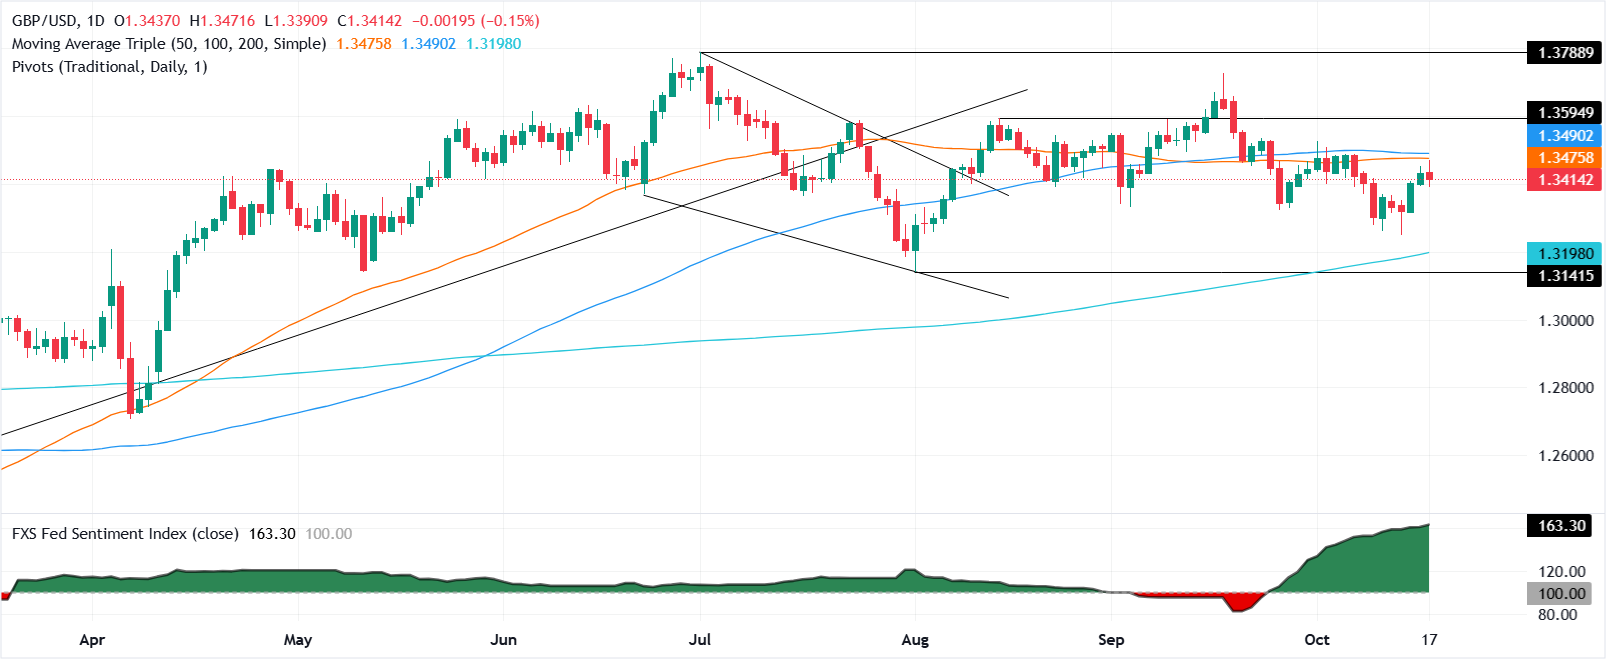
GBP/USD Price Chart – Daily
Pound Sterling Price This week
The table below shows the percentage change of British Pound (GBP) against listed major currencies this week. British Pound was the strongest against the Australian Dollar.
| USD | EUR | GBP | JPY | CAD | AUD | NZD | CHF | |
|---|---|---|---|---|---|---|---|---|
| USD | -0.45% | -0.48% | -1.07% | 0.38% | 0.42% | 0.40% | -1.16% | |
| EUR | 0.45% | -0.02% | -0.56% | 0.82% | 0.96% | 0.85% | -0.73% | |
| GBP | 0.48% | 0.02% | -0.50% | 0.85% | 0.97% | 0.87% | -0.73% | |
| JPY | 1.07% | 0.56% | 0.50% | 1.41% | 1.45% | 1.51% | -0.15% | |
| CAD | -0.38% | -0.82% | -0.85% | -1.41% | 0.00% | 0.03% | -1.57% | |
| AUD | -0.42% | -0.96% | -0.97% | -1.45% | -0.00% | -0.09% | -1.68% | |
| NZD | -0.40% | -0.85% | -0.87% | -1.51% | -0.03% | 0.09% | -1.59% | |
| CHF | 1.16% | 0.73% | 0.73% | 0.15% | 1.57% | 1.68% | 1.59% |
The heat map shows percentage changes of major currencies against each other. The base currency is picked from the left column, while the quote currency is picked from the top row. For example, if you pick the British Pound from the left column and move along the horizontal line to the US Dollar, the percentage change displayed in the box will represent GBP (base)/USD (quote).
Artigos Recomendados


