
EUR/USD pulls back from highs ahead of Eurozone business activity data
- The Euro trims Monday's gains, retreating below 1.1800 after hitting 1.1820 highs.
- Eurozone flash PMIs are expected to show that business activity grew at a steady pace in September.
- Later on the day, the US preliminary PMIs and Fed's Powell will provide fundamental guidance to the USD.
EUR/USD eases from highs, following a sharp rebound on Monday. The pair has returned below 1.1800, trading at 1.1795 at the time of writing, after hitting 1.1820 earlier on the day. Traders appear to have become cautious, awaiting the preliminary Purchasing Managers Index (PMI) figures and Fed Chairman Jerome Powell's speech, both due later on the day.
On Monday, a slew of Fed officials provided a range of monetary policy views. Governor Stephen Miran, recently appointed by US President Donald Trump, offered the most dovish one, stating that interest rates should be close to 2% as changes in immigration, lower taxes, and the revenue from trade tariffs will drive down underlying interest rates, making current monetary policy too restrictive.
On the other side of the spectrum, St. Louis and Cleveland Fed Presidents, Alberto Mussalem and Beth Hammack, showed ongoing concerns about inflation and remained more cautious about further interest rate cuts. The US Dollar, however, maintained its bearish tone against its main peers.
In Tuesday's calendar, the preliminary PMI figures from the Eurozone and the US will be the main data points until Friday's Personal Consumption Expenditures (PCE) Price Index release. Markets will want to test the resilience of the US economy to the higher trade tariffs ahead of a speech from Fed's Powell, which might give further insight into the bank's forward guidance.
Euro Price Today
The table below shows the percentage change of Euro (EUR) against listed major currencies today. Euro was the strongest against the New Zealand Dollar.
| USD | EUR | GBP | JPY | CAD | AUD | NZD | CHF | |
|---|---|---|---|---|---|---|---|---|
| USD | 0.04% | -0.06% | 0.03% | 0.06% | 0.13% | 0.21% | -0.10% | |
| EUR | -0.04% | 0.03% | 0.00% | 0.07% | 0.17% | 0.23% | -0.08% | |
| GBP | 0.06% | -0.03% | 0.04% | 0.04% | 0.13% | 0.21% | -0.12% | |
| JPY | -0.03% | 0.00% | -0.04% | 0.02% | 0.15% | 0.19% | -0.04% | |
| CAD | -0.06% | -0.07% | -0.04% | -0.02% | 0.08% | 0.15% | -0.16% | |
| AUD | -0.13% | -0.17% | -0.13% | -0.15% | -0.08% | 0.06% | -0.17% | |
| NZD | -0.21% | -0.23% | -0.21% | -0.19% | -0.15% | -0.06% | -0.31% | |
| CHF | 0.10% | 0.08% | 0.12% | 0.04% | 0.16% | 0.17% | 0.31% |
The heat map shows percentage changes of major currencies against each other. The base currency is picked from the left column, while the quote currency is picked from the top row. For example, if you pick the Euro from the left column and move along the horizontal line to the US Dollar, the percentage change displayed in the box will represent EUR (base)/USD (quote).
Daily digest market movers: US Dollar's losses steam as markets price further rate cuts
- The US Dollar's (USD) recovery from the four-year lows seen last week has lost momentum. Fed speakers failed to change the view that the bank will keep cutting rates this year, and probably also at the beginning of the next, which triggered significant Dollar reversals on Monday.
- In the Eurozone, the European Commission's preliminary Consumer Confidence Index improved to -14.9 in September from -15.5 in August. The final reading beat the market expectations of -15.3.
- At 08:00 GMT, the Eurozone's flash PMI data will be released. The HCOB Manufacturing PMI is expected to have improved to 50.9 in September from 50.7, while Services activity is seen expanding at a steady 50.5 pace.
- In the US, the Flash Manufacturing S&P Global Manufacturing PMI is seen down to 52 in September from 53 in August, and the Services Index easing to 53.9 from last month's 54.5 reading.
Technical Analysis: EUR/USD bulls have found resistance at the 1.1800 area
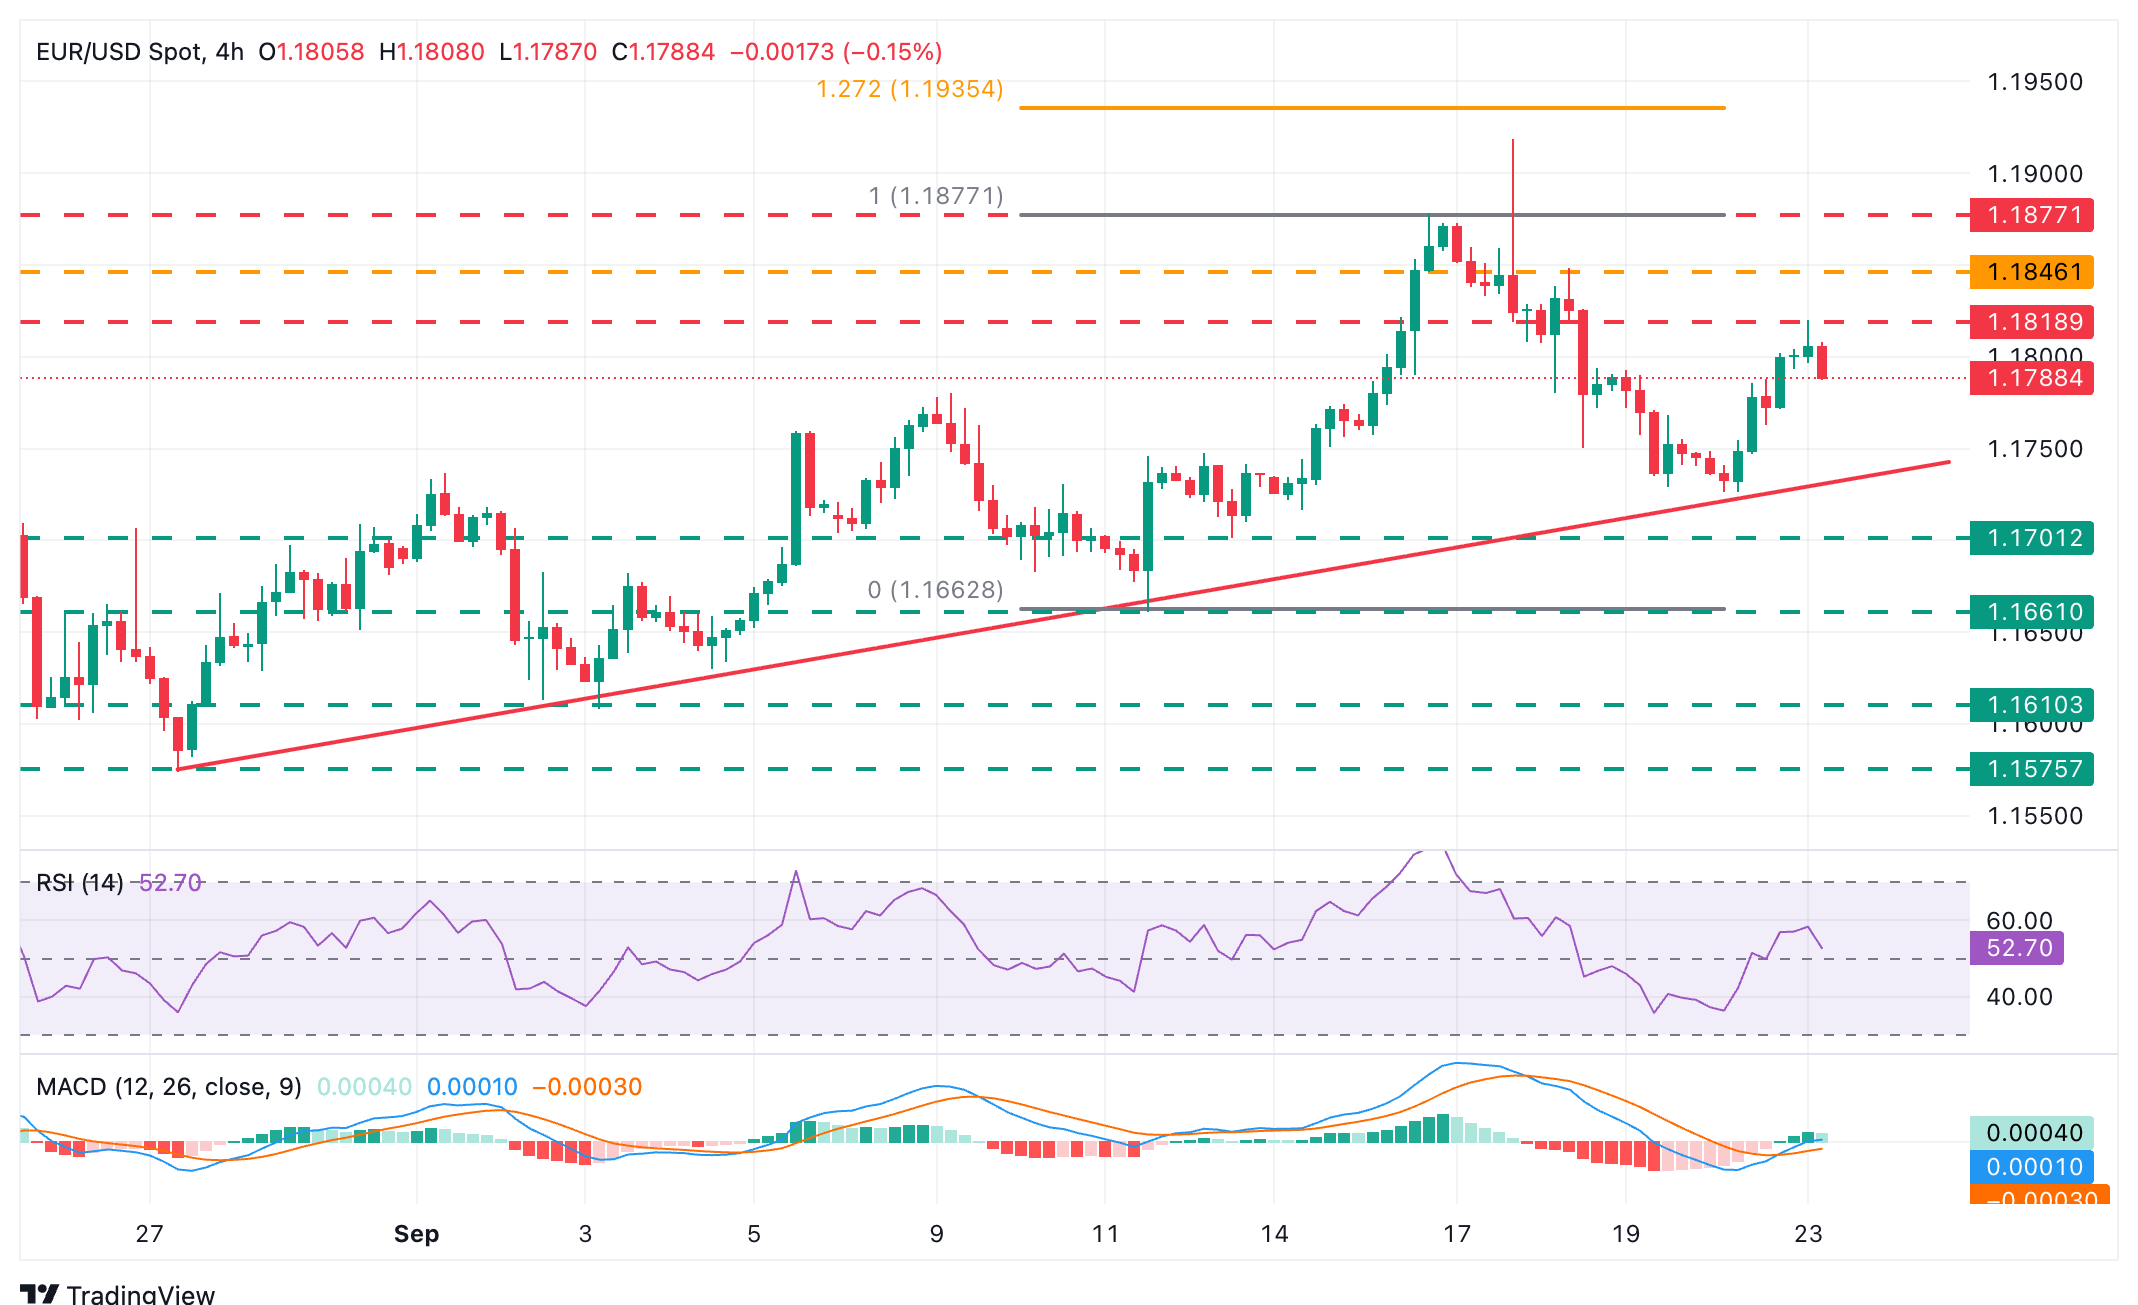
EUR/USD's rebound from the 1.1725 area on Monday has been capped at the 1.1800 area, with investors wary of risk ahead of business activity figures from Europe and the US as well as Fed Powell's speech. Technical indicators suggest that the pair's recovery has lost momentum, although the Relative Strength Index (RSI) remains within positive territory above the 50 level.
Immediate support lies at the trendline from the September 2 lows, now in the area of 1.1730. A confirmation below here would increase bearish pressure towards the September 12 and 11 lows at the 1.1700 area and 1.1660, respectively. To the upside, the intra-day high, at 1.1820, and the September 18 high, near 1.1850, are likely to challenge a potential bullish reaction ahead of the September 16 high at 1.1878.
Economic Indicator
HCOB Manufacturing PMI
The Manufacturing Purchasing Managers Index (PMI), released on a monthly basis by S&P Global and Hamburg Commercial Bank (HCOB), is a leading indicator gauging business activity in the Eurozone manufacturing sector. The data is derived from surveys of senior executives at private-sector companies from the manufacturing sector. Survey responses reflect the change, if any, in the current month compared to the previous month and can anticipate changing trends in official data series such as Gross Domestic Product (GDP), industrial production, employment and inflation. The index varies between 0 and 100, with levels of 50.0 signaling no change over the previous month. A reading above 50 indicates that the manufacturing economy is generally expanding, a bullish sign for the Euro (EUR). Meanwhile, a reading below 50 signals that activity among goods producers is generally declining, which is seen as bearish for EUR.
Read more.Next release: Tue Sep 23, 2025 08:00 (Prel)
Frequency: Monthly
Consensus: 50.9
Previous: 50.7
Source: S&P Global
Economic Indicator
HCOB Services PMI
The Services Purchasing Managers Index (PMI), released on a monthly basis by S&P Global and Hamburg Commercial Bank (HCOB), is a leading indicator gauging business activity in the Eurozone services sector. As the services sector dominates a large part of the economy, the Services PMI is an important indicator gauging the state of overall economic conditions. The data is derived from surveys of senior executives at private-sector companies from the services sector. Survey responses reflect the change, if any, in the current month compared to the previous month and can anticipate changing trends in official data series such as Gross Domestic Product (GDP), industrial production, employment and inflation. The index varies between 0 and 100, with levels of 50.0 signaling no change over the previous month. A reading above 50 indicates that the services economy is generally expanding, a bullish sign for the Euro (EUR). Meanwhile, a reading below 50 signals that activity among services providers is generally declining, which is seen as bearish for EUR.
Read more.Next release: Tue Sep 23, 2025 08:00 (Prel)
Frequency: Monthly
Consensus: 50.5
Previous: 50.5
Source: S&P Global
Artigos Recomendados


