
Silver Price Forecast: XAG/USD rebounds from two-week low, Fed Minutes in focus
- Silver rebounds sharply on Wednesday, snapping a four-day losing streak after falling to its lowest level since August 4.
- The rebound follows a pullback in the US Dollar, as political pressure mounts on the Fed after President Trump calls for Governor Lisa Cook's resignation.
- Traders await the release of the FOMC July meeting minutes, which could offer fresh clues on the Fed’s inflation outlook and rate trajectory, potentially impacting US Dollar flows and Silver prices.
Silver (XAG/USD) stages a sharp recovery on Wednesday, snapping a four-day losing streak after sliding to its lowest level in over two weeks, since August 4. The rebound comes as the US Dollar (USD) lost ground following renewed political pressure on the Federal Reserve (Fed), with US President Donald Trump publicly calling for the resignation of Fed Governor Lisa Cook. The safe-haven appeal of Silver re-emerged, helping the metal bounce from session lows.
At the time of writing, Silver is trading around $37.80, up nearly 1.0% on the day, having rebounded strongly from an intraday low of $36.96. The bounce coincides with growing market caution ahead of the release of the Federal Open Market Committee (FOMC) July meeting minutes at 18:00 GMT, which could offer insight into the Fed’s evolving inflation outlook and interest rate path.
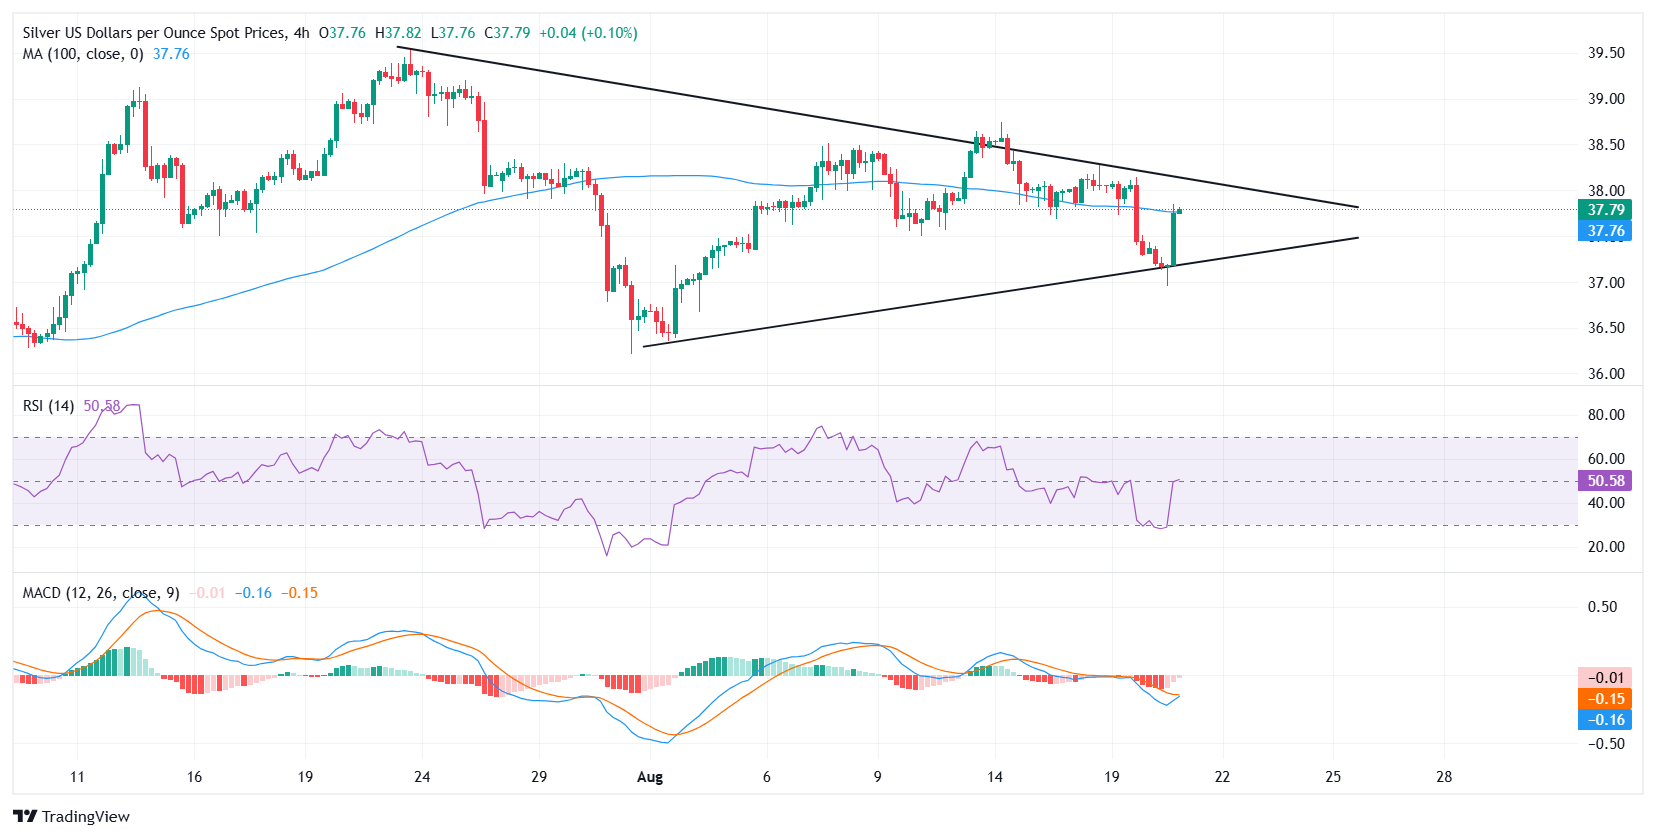
From a technical standpoint, Silver (XAG/USD) is trading within a symmetrical triangle pattern on a 4-hour chart. The price rebounded sharply from the lower boundary of the triangle formation near $37.00, where buyers re-emerged and defended key support. This bounce has brought the metal back toward the 100-period Simple Moving Average (SMA), which now acts as immediate resistance near $37.76.
A sustained break above the 100-SMA could pave the way for a retest of the triangle’s upper boundary near the $38.20 psychological level. A confirmed breakout above this confluence zone would likely accelerate bullish momentum, exposing the next upside targets at $38.74—the August 14 swing high, followed by $39.53, which marks the multi-year peak.
Momentum indicators are showing early signs of a potential bullish shift. The Relative Strength Index (RSI) has rebounded after briefly dipping into oversold territory, now climbing back toward the midline, which reflects improving intraday strength and fading bearish pressure. Meanwhile, the Moving Average Convergence Divergence (MACD) histogram is narrowing, and the MACD line is approaching a bullish crossover above the signal line, another indication that downside momentum is weakening and a reversal may be underway.
On the downside, failure to clear the 100-SMA may keep the metal confined within the triangle structure. A break below the $37.00 support could trigger a bearish breakdown, exposing the next support levels at $36.50 and $35.90.
Silver FAQs
Silver is a precious metal highly traded among investors. It has been historically used as a store of value and a medium of exchange. Although less popular than Gold, traders may turn to Silver to diversify their investment portfolio, for its intrinsic value or as a potential hedge during high-inflation periods. Investors can buy physical Silver, in coins or in bars, or trade it through vehicles such as Exchange Traded Funds, which track its price on international markets.
Silver prices can move due to a wide range of factors. Geopolitical instability or fears of a deep recession can make Silver price escalate due to its safe-haven status, although to a lesser extent than Gold's. As a yieldless asset, Silver tends to rise with lower interest rates. Its moves also depend on how the US Dollar (USD) behaves as the asset is priced in dollars (XAG/USD). A strong Dollar tends to keep the price of Silver at bay, whereas a weaker Dollar is likely to propel prices up. Other factors such as investment demand, mining supply – Silver is much more abundant than Gold – and recycling rates can also affect prices.
Silver is widely used in industry, particularly in sectors such as electronics or solar energy, as it has one of the highest electric conductivity of all metals – more than Copper and Gold. A surge in demand can increase prices, while a decline tends to lower them. Dynamics in the US, Chinese and Indian economies can also contribute to price swings: for the US and particularly China, their big industrial sectors use Silver in various processes; in India, consumers’ demand for the precious metal for jewellery also plays a key role in setting prices.
Silver prices tend to follow Gold's moves. When Gold prices rise, Silver typically follows suit, as their status as safe-haven assets is similar. The Gold/Silver ratio, which shows the number of ounces of Silver needed to equal the value of one ounce of Gold, may help to determine the relative valuation between both metals. Some investors may consider a high ratio as an indicator that Silver is undervalued, or Gold is overvalued. On the contrary, a low ratio might suggest that Gold is undervalued relative to Silver.
Artigos Recomendados


