EUR/JPY price forecast: Falls toward 171.00 on signs of a potential bearish shift

Fonte Fxstreet
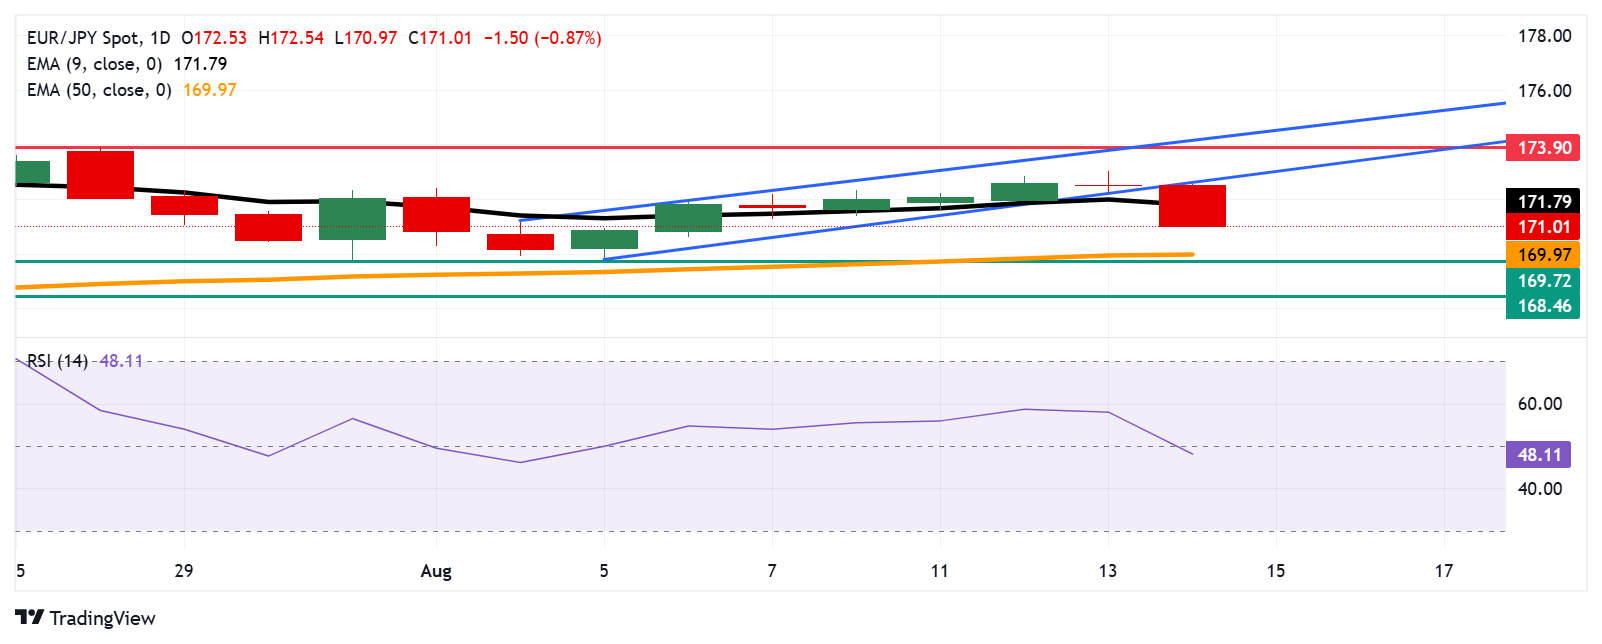
  • EUR/JPY may find the primary support at the 50-day EMA of 169.98.
  • A bearish shift appears as the currency cross broke below the ascending channel pattern.
  • The immediate resistance appears at the nine-day EMA of 171.79.

EUR/JPY depreciates more than 0.5%, trading around 171.20 during the European hours on Thursday. The technical analysis of the daily chart suggests a shift from bullish to bearish momentum as the currency cross has broken below the ascending channel pattern.

The 14-day Relative Strength Index (RSI) is positioned below the 50 mark, suggesting a bearish is in play. Additionally, the short-term price momentum is weaker as the EUR/JPY cross moved below the nine-day Exponential Moving Average (EMA).

On the downside, the EUR/JPY cross may target the 50-day EMA at 169.97, followed by the six-week low at 169.72, which was recorded on July 31. A break below this level would prompt the currency cross to test the two-month low at 168.46, registered on July 1.

The EUR/JPY cross could test the immediate barrier at the nine-day EMA of 171.81. A break above this level would strengthen short-term price momentum, allowing the currency cross to re-enter the ascending channel, signaling a false breakout and a bullish recovery. Further advances would lead the currency cross to approach 173.90, the highest since July 2024, recorded on July 28, 2025, followed by the upper boundary of the ascending channel around 174.30.

EUR/JPY: Daily Chart
Euro PRICE Today

The table below shows the percentage change of Euro (EUR) against listed major currencies today. Euro was the weakest against the Japanese Yen.

USD EUR GBP JPY CAD AUD NZD CHF
USD 0.29% 0.01% -0.57% 0.16% 0.28% 0.48% 0.23%
EUR -0.29% -0.25% -0.86% -0.14% -0.02% 0.17% -0.07%
GBP -0.01% 0.25% -0.62% 0.22% 0.30% 0.53% 0.28%
JPY 0.57% 0.86% 0.62% 0.76% 0.85% 0.95% 0.76%
CAD -0.16% 0.14% -0.22% -0.76% 0.16% 0.32% 0.07%
AUD -0.28% 0.02% -0.30% -0.85% -0.16% 0.23% -0.13%
NZD -0.48% -0.17% -0.53% -0.95% -0.32% -0.23% -0.29%
CHF -0.23% 0.07% -0.28% -0.76% -0.07% 0.13% 0.29%

The heat map shows percentage changes of major currencies against each other. The base currency is picked from the left column, while the quote currency is picked from the top row. For example, if you pick the Euro from the left column and move along the horizontal line to the US Dollar, the percentage change displayed in the box will represent EUR (base)/USD (quote).

Isenção de responsabilidade: Apenas para fins informativos. O desempenho passado não é indicativo de resultados futuros.
placeholder
Ouro atinge mínima de três semanas à medida que o dólar se estabiliza e esperanças de paz entre Rússia e Ucrânia aumentamO ouro (XAU/USD) atingiu uma mínima de quase três semanas durante a sessão asiática de quarta-feira, com os ursos aguardando um rompimento sustentado abaixo da Média Móvel Simples (SMA) de 100 dias antes de se posicionarem para novas perdas.
Autor  FXStreet
12 horas atrás
O ouro (XAU/USD) atingiu uma mínima de quase três semanas durante a sessão asiática de quarta-feira, com os ursos aguardando um rompimento sustentado abaixo da Média Móvel Simples (SMA) de 100 dias antes de se posicionarem para novas perdas.
placeholder
Previsão de Preços – Top 3: Bitcoin, Ethereum, Ripple – Suportes-chave de BTC, ETH e XRP rompidos à medida que a correção se aprofundaBitcoin (BTC), Ethereum (ETH) e Ripple (XRP) fecharam abaixo de zonas de suporte-chave à medida que a correção se aprofunda nesta semana. O BTC caiu abaixo de sua linha de tendência ascendente, enquanto o ETH recuou abaixo do nível crítico, mirando patamares abaixo de $4.000.
Autor  FXStreet
12 horas atrás
Bitcoin (BTC), Ethereum (ETH) e Ripple (XRP) fecharam abaixo de zonas de suporte-chave à medida que a correção se aprofunda nesta semana. O BTC caiu abaixo de sua linha de tendência ascendente, enquanto o ETH recuou abaixo do nível crítico, mirando patamares abaixo de $4.000.
placeholder
HGBS11 tem alta no lucro; HGRE11 mostra gestão ativa de portfólioO fundo de investimento imobiliário CSHG Brasil Shopping (HGBS11) reportou um lucro operacional de R$ 20,073 milhões no mês de julho, o que representa um crescimento de 19,39% em comparação com o resultado de R$ 16,813 milhões obtido em junho. O desempenho positivo permitiu a distribuição de R$ 0,15 por cota em dividendos aos seus investidores.
Autor  Pedro Augusto Prazeres
15 horas atrás
O fundo de investimento imobiliário CSHG Brasil Shopping (HGBS11) reportou um lucro operacional de R$ 20,073 milhões no mês de julho, o que representa um crescimento de 19,39% em comparação com o resultado de R$ 16,813 milhões obtido em junho. O desempenho positivo permitiu a distribuição de R$ 0,15 por cota em dividendos aos seus investidores.
placeholder
Ibovespa despenca 2,2% com bancos e dólar dispara; XP recua mais de 7% após balançoO Ibovespa, principal índice da bolsa de valores brasileira, fechou em forte queda de 2,20% nesta terça-feira (19/8), aos 134.295 pontos.
Autor  Pedro Augusto Prazeres
15 horas atrás
O Ibovespa, principal índice da bolsa de valores brasileira, fechou em forte queda de 2,20% nesta terça-feira (19/8), aos 134.295 pontos.
placeholder
ETFs de Ethereum registram saída de quase US$ 200 milhões e fila de “desestake” atinge recordeOs fundos de índice (ETFs) de Ether (ETH) à vista iniciaram a semana com uma forte onda de vendas, registrando saídas de quase US$ 200 milhões na segunda-feira (18/8), dando continuidade a uma tendência de retirada que começou na semana anterior.
Autor  Pedro Augusto Prazeres
15 horas atrás
Os fundos de índice (ETFs) de Ether (ETH) à vista iniciaram a semana com uma forte onda de vendas, registrando saídas de quase US$ 200 milhões na segunda-feira (18/8), dando continuidade a uma tendência de retirada que começou na semana anterior.
Produtos relacionados
goTop
quote