

Bitcoin Price Forecast: BTC could reach a new all-time high amid US-China trade optimism, US CPI release
- Bitcoin price edges slightly down on Wednesday after rallying 4.28% over the last two days.
- Risk-on sentiment remains strong as the US-China talks ease trade tensions ahead of the US CPI on Wednesday.
- K33 Research report highlights that current risk aversion in BTC may set the stage for further upside.
Bitcoin (BTC) price edges slightly down on Wednesday, remaining limited below its all-time high of $111,980. The risk-on sentiment remains strong as the US-China trade agreement eases tensions and the market looks ahead to the US Consumer Price Index (CPI) release on Wednesday.
Bitcoin moves away from its all-time high as US-China trade uncertainty eases
Bitcoin price rose sharply by 4.2% at the start of this week, on Monday, as news emerged that two major global economic powers, the US and China, had resumed trade talks in London. Following a two-day talk, both countries have agreed to ease export curbs, including those on rare earths and have established a framework to maintain the tariff truce.
In the meantime, US President Donald Trump received a favorable update late on Tuesday as a federal appeals court ruled that his “Liberation Day” tariffs can temporarily stay in effect. Last month, the US Court of International Trade blocked the implementation of Trump’s tariffs, saying that the method used to enact them was unlawful.
These ongoing developments have generated a risk-on sentiment in the market, with Bitcoin slightly correcting on Wednesday but still just 2.2% shy of its all-time high of $111,980.
Bitcoin traders await US CPI data
Haresh Menghani, an analyst at FXStreet, reports that investors await more cues about the Federal Reserve’s (Fed) path for interest rate cuts.
Menghani continued that the focus remains glued to the release of May's US Consumer Price Index (CPI) report later during the North American session on Wednesday.
A surprise uptick in the annual headline CPI inflation print could affirm bets that the Fed will keep unchanged its monetary policy in July. In this case, the USD (US Dollar) could see another leg higher in an immediate reaction, triggering a risk-off sentiment in the market that would cause a decline in the prices of riskier assets, such as Bitcoin.
Conversely, a softer-than-expected reading could revive the USD downtrend on renewed dovish Fed expectations, often boosting investor confidence across risk markets, leading to rallies in BTC.
Bitcoin’s current situation shows a bullish bias
Tuesday's K33 Research report highlights that current risk aversion may set the stage for further upside.
The report explains that funding rates and leverage indicators across platforms indicate sustained defensiveness, with Binance’s BTCUSDT perpetual averaging negative daily funding on Fridays and Sundays, as shown in the chart below.
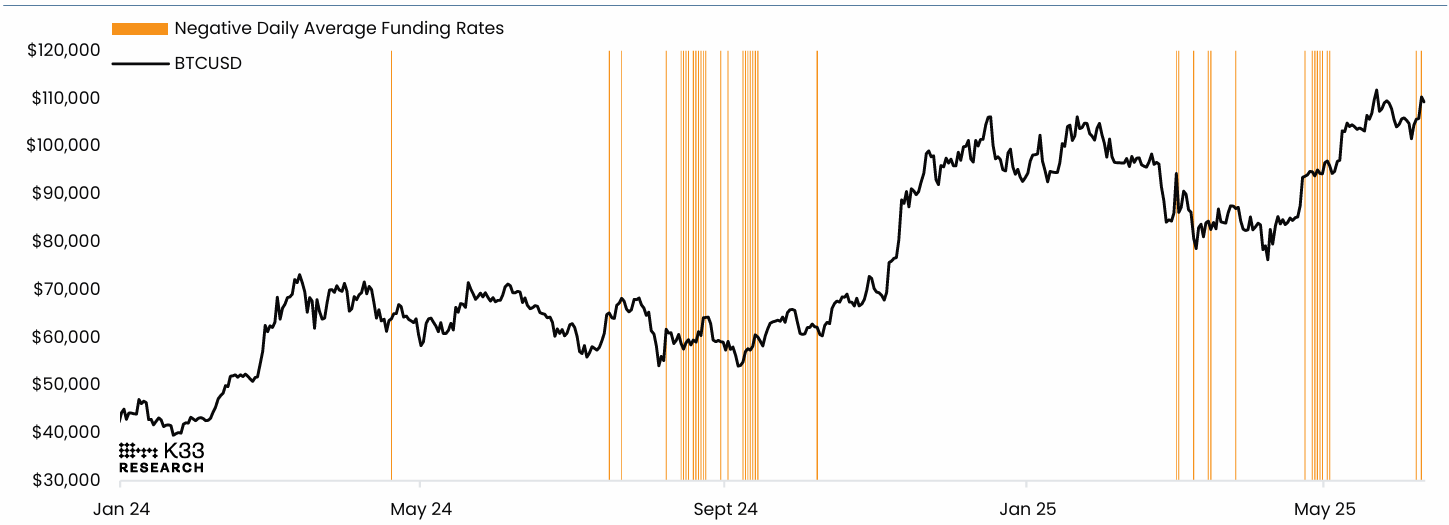
BTCUSD vs Days of Negative Funding Rates Chart. Source: K33 Research
Additionally, over the past week, average funding rates stood at 1.3% annualized, a level only seen near local bottoms over the last 2.5 years. Historically, BTC does not top in environments with negative funding; such conditions tend to precede rallies rather than mark peaks.
“All in all, risk aversion in perps points toward a healthy rally with constructive potency to materialize higher,” says a K33 analyst.
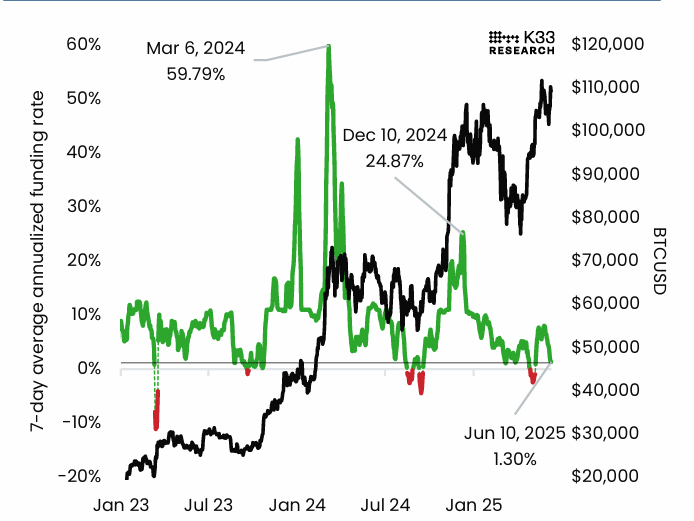
BTCUSDT Perpetual: 7-Day Average Annualized Funding Rates Chart. Source: K33 Research
Looking down, institutional demand has continued to strengthen so far this week. According to SoSoValue data, US spot Bitcoin Exchange Traded Funds (ETFs) recorded an inflow of $431.12 million on Tuesday, marking the second consecutive day of inflow this week. If this institutional inflow continues or intensifies, the BTC price could recover and head toward its all-time high of $111,980.
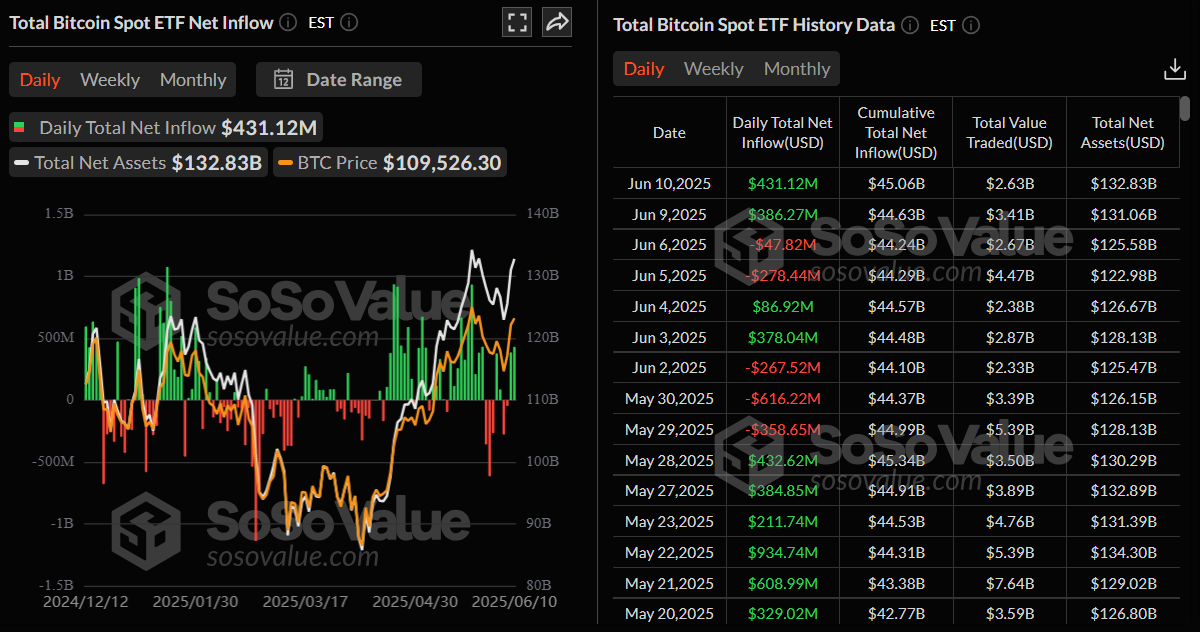
Total Bitcoin spot ETFs daily chart. Source: SoSoValue
Bitcoin Price Forecast: BTC could rally as it closes above key resistance
Bitcoin price retested and found support around its 50-day Exponential Moving Average (EMA) at $101,000 on Friday and then recovered sharply over the next three days. BTC closed above its key resistance level of $106,406 on Monday and hovered around $110,000 the next day. At the time of writing on Wednesday, it is trading slightly down at around $109,500.
If BTC continues its upward trend, it could extend the rally to retest its May 22 all-time high of $111,980.
The Relative Strength Index (RSI) on the daily chart reads 61, above its neutral level of 50, indicating strong bullish momentum. Moreover, the Moving Average Convergence Divergence (MACD) also showed a bullish crossover on Tuesday, giving a buy signal and indicating an upward trend.
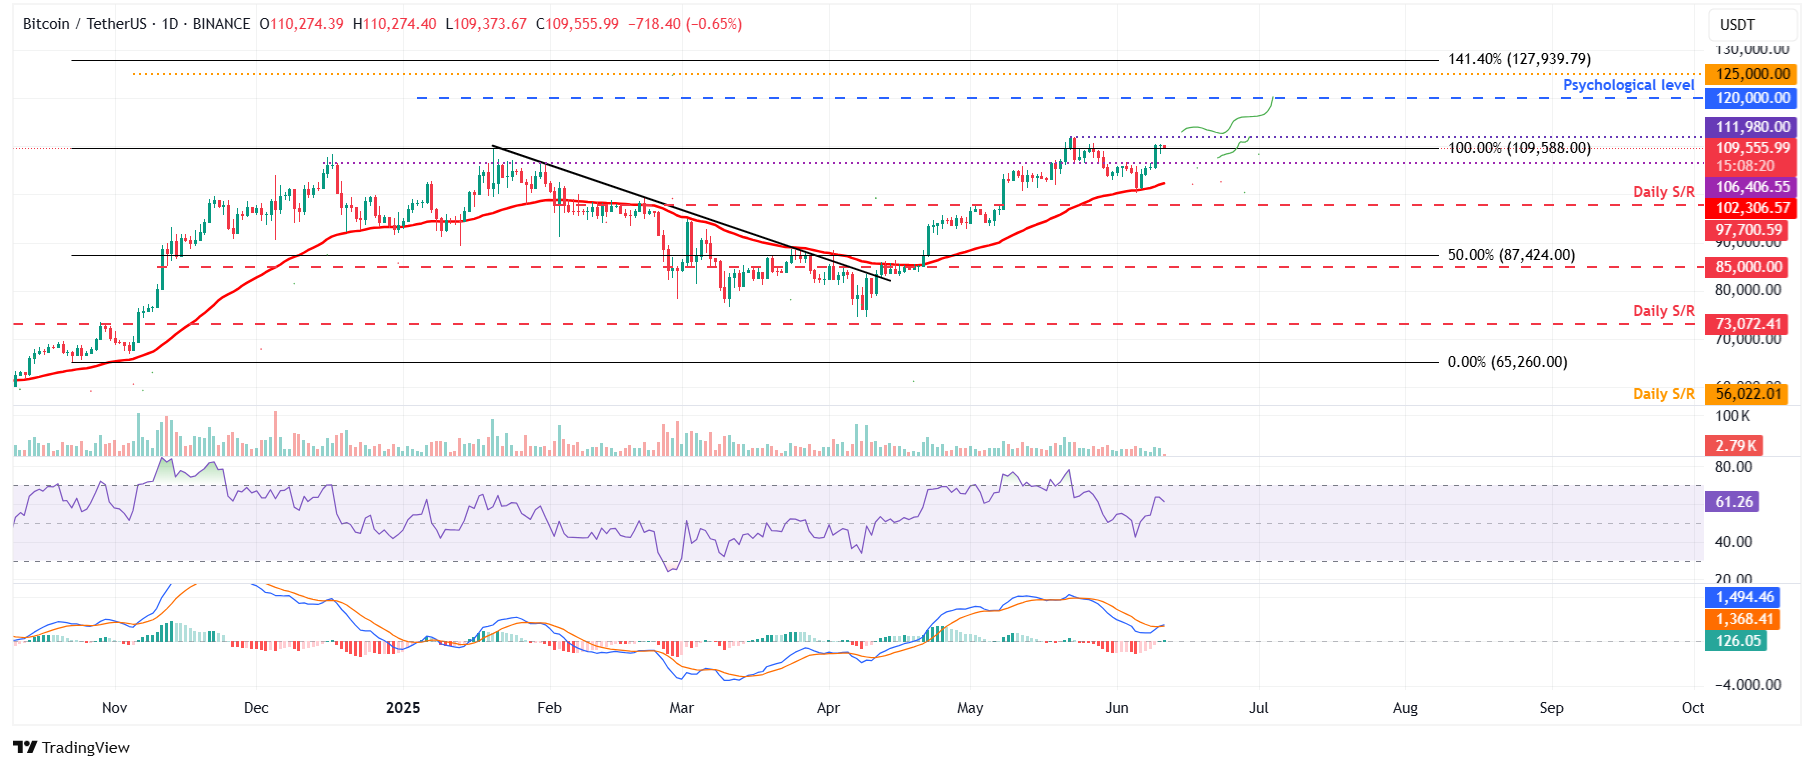
BTC/USDT daily chart
However, if BTC faces a correction, it could extend the decline to retest its daily support level at $106,406.
Bitcoin, altcoins, stablecoins FAQs
Bitcoin is the largest cryptocurrency by market capitalization, a virtual currency designed to serve as money. This form of payment cannot be controlled by any one person, group, or entity, which eliminates the need for third-party participation during financial transactions.
Altcoins are any cryptocurrency apart from Bitcoin, but some also regard Ethereum as a non-altcoin because it is from these two cryptocurrencies that forking happens. If this is true, then Litecoin is the first altcoin, forked from the Bitcoin protocol and, therefore, an “improved” version of it.
Stablecoins are cryptocurrencies designed to have a stable price, with their value backed by a reserve of the asset it represents. To achieve this, the value of any one stablecoin is pegged to a commodity or financial instrument, such as the US Dollar (USD), with its supply regulated by an algorithm or demand. The main goal of stablecoins is to provide an on/off-ramp for investors willing to trade and invest in cryptocurrencies. Stablecoins also allow investors to store value since cryptocurrencies, in general, are subject to volatility.
Bitcoin dominance is the ratio of Bitcoin's market capitalization to the total market capitalization of all cryptocurrencies combined. It provides a clear picture of Bitcoin’s interest among investors. A high BTC dominance typically happens before and during a bull run, in which investors resort to investing in relatively stable and high market capitalization cryptocurrency like Bitcoin. A drop in BTC dominance usually means that investors are moving their capital and/or profits to altcoins in a quest for higher returns, which usually triggers an explosion of altcoin rallies.
추천 기사


