Hyperliquid and Aptos Price Prediction: Exploring the impact of DeFi TVL bounce back
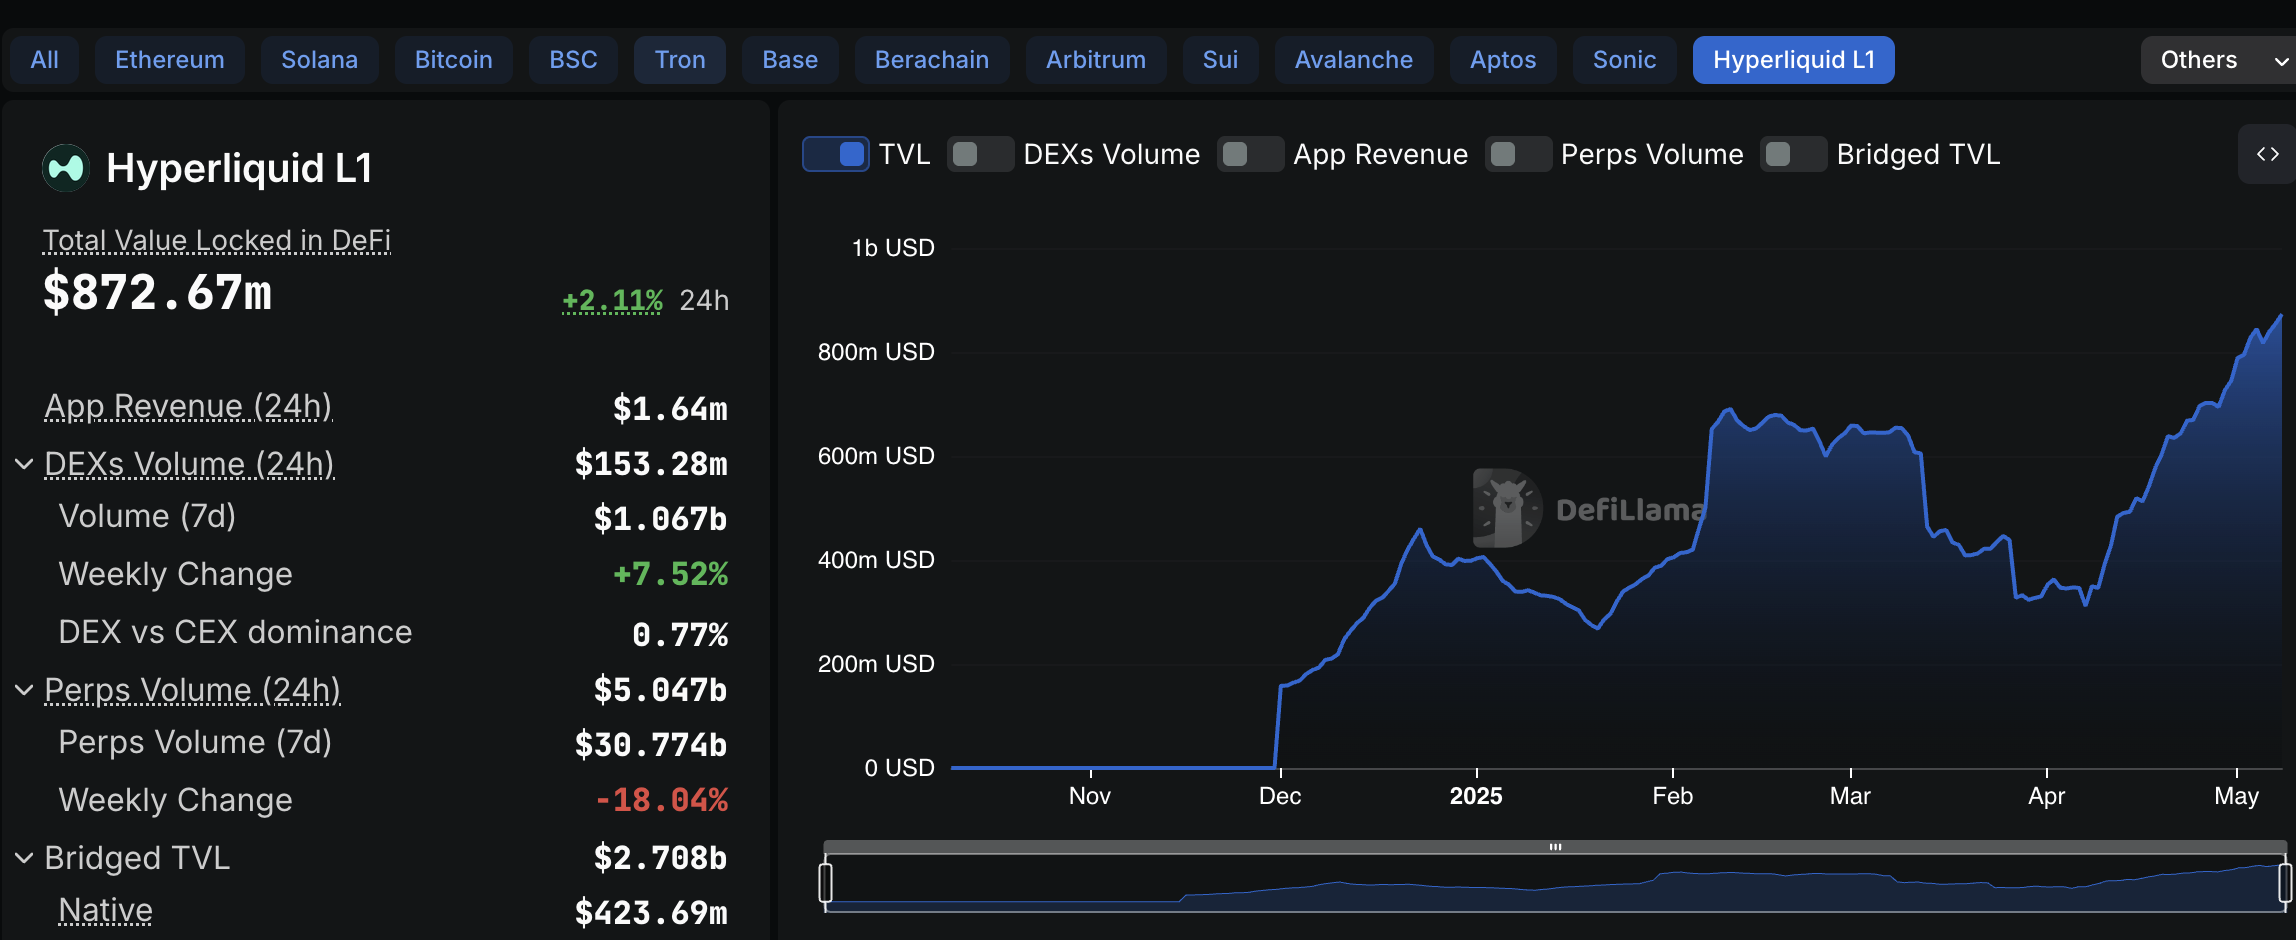
- Hyperliquid extends recovery above $20 as DeFi TVL hits all-time high at $872 million.
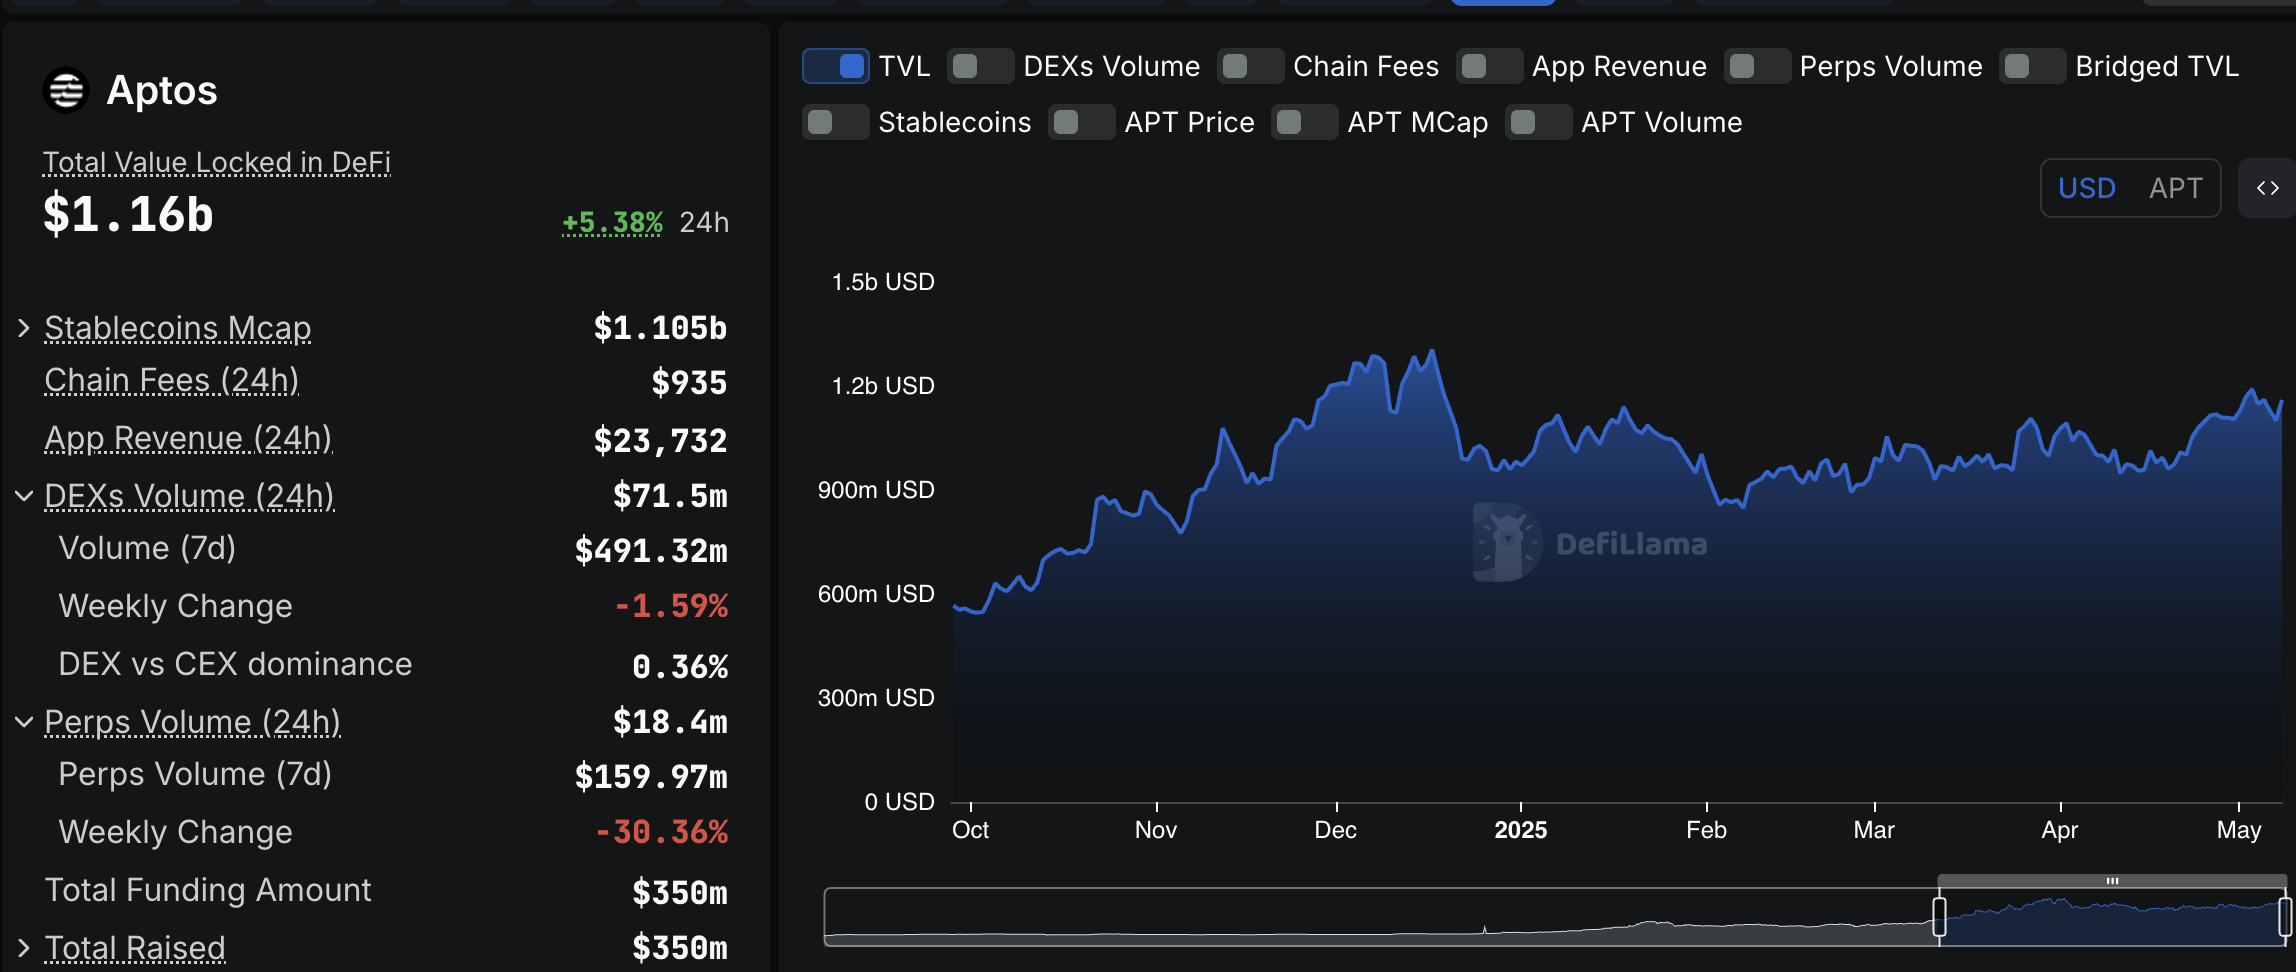
- Aptos has confirmed a trendline breakout supported by a 5.4% increase in TVL volume to $1.16 billion in the last 24 hours.
- Aptos recovers above the $5.00 level, supported by technicals and on-chain metrics amid broader risk-on sentiment.
The cryptocurrency market is in a fresh risk-on frenzy, influencing altcoins to wake up alongside Bitcoin (BTC). Hyperliquid (HYPE) and Aptos (APT) are trending upwards on Thursday as optimism mounts ahead of a potential trade deal announcement between the United States (US) and another country, reportedly to be the United Kingdom (UK).
Trump administration to announce trade deal
US President Donald Trump is expected to announce a trade deal with the UK at 14:00 GMT on Thursday in a “big news conference.” President Trump teased a new trade agreement with a “big and highly respected country” in a social media post on Wednesday, but did not specify which country.
However, a top UK government official confirmed early Thursday that President Trump would announce key points in the US-UK trade agreement.
Optimism for a trade deal between the US and the UK has ignited risk-on sentiment in the crypto market. Bitcoin (BTC) closes in on the $100,000 level in the European session, while Ethereum (ETH) extends gains above $1,900. Similarly, Ripple (XRP) steadies the uptrend above $2.20, hinting at a larger breakout.
Hyperliquid is back above $20 as DeFi TVL soars
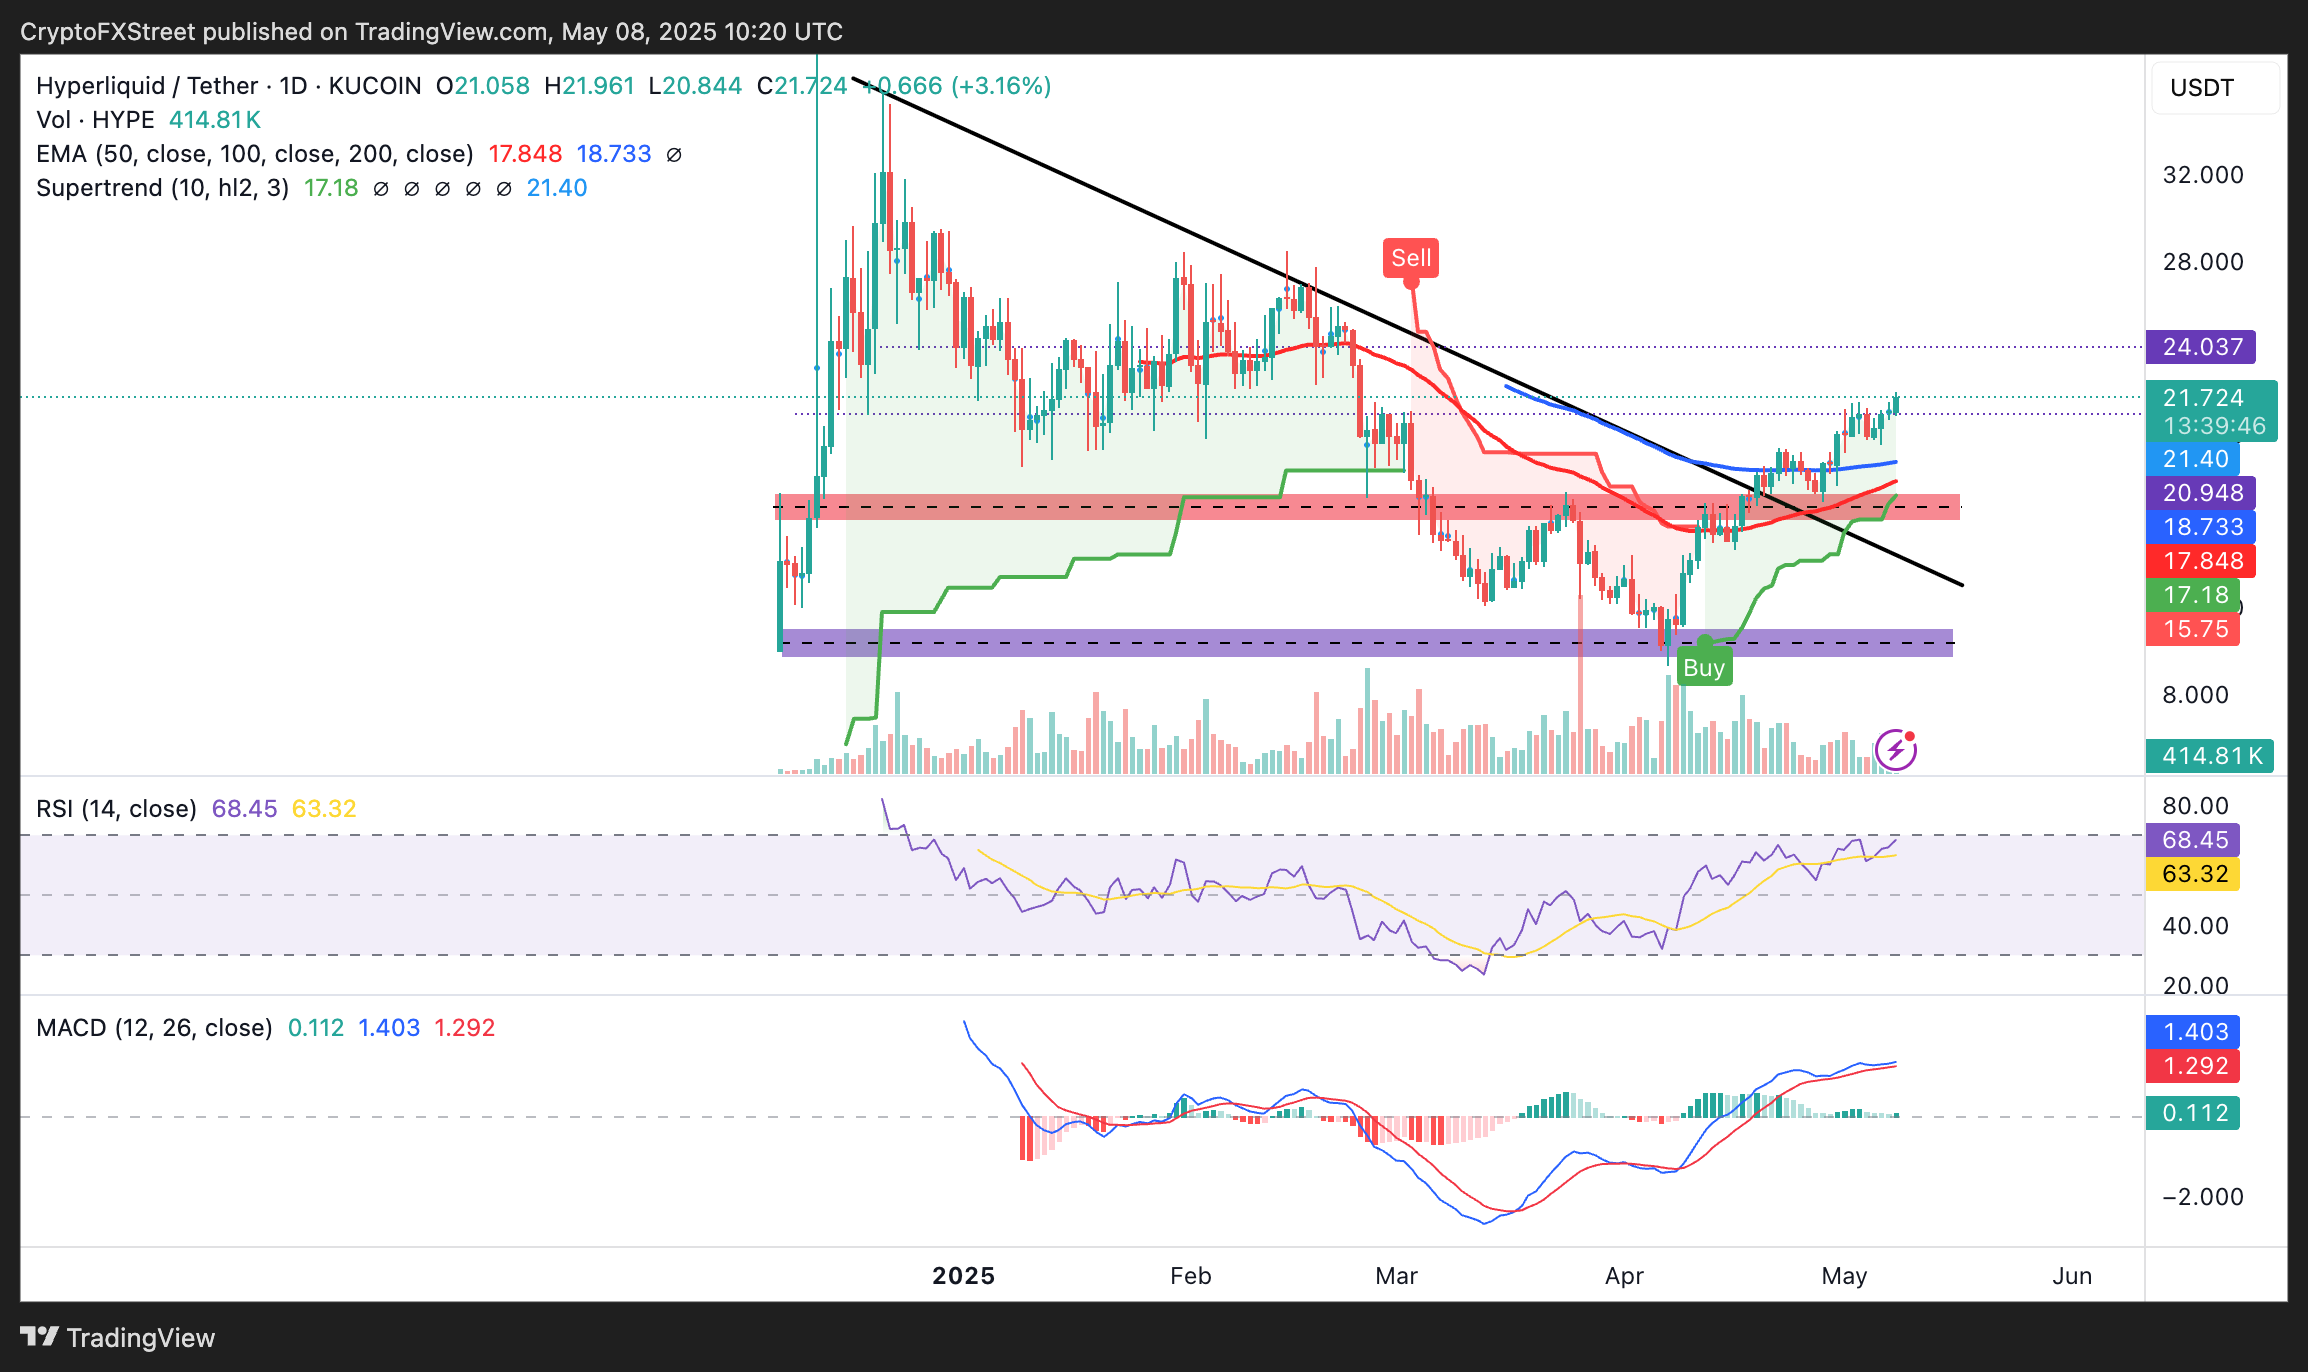
Hyperliquid’s price showcases a steady uptrend, nurtured from $9.30, a level HYPE tagged after President Trump’s tariff shocks in early April. A staggering 133% surge has seen layer-1 token exchange hands at $21.72 at the time of writing on Thursday.
HYPE’s uptrend occurred alongside a sharp increase in the platform’s Decentralised Finance (DeFi) Total Value Locked (TVL). DefiLlama’s TVL chart below illustrates the trend from zero in December to $690.21 million in February. The TVL volume was drawn down in March, hitting a low of $311.55 million on April 7 before reversing sharply to $872 million.

HYPE’s DeFi TVL: Source: DefiLlama
This upward trend in TVL shows rising adoption and user confidence in Hyperliquid’s DeFi ecosystem. TVL represents the total value of assets locked in its protocols, comprising lending, staking, or liquidity provision.
A persistent increase in TVL often signals increased trust and utility in a DeFi project. It can drive demand for the native token while reducing the circulating supply, further boosting prices higher.
Meanwhile, Hyperliquid’s price sits on top of key moving averages, including the 50-day and the 100-day Exponential Moving Averages (EMAs), which validates the bullish outlook.

HYPE/USDT daily chart
The Relative Strength Index (RSI) indicator’s upward trend at 68.45 bolsters HYPE’s bullish case. Further upside movement into the overbought region (70 and above) would pave the way for more gains. Key targets include previously tested resistances at $24.00 and $28.00, respectively.
Traders should stay cautious, as an overbought RSI might spark a reversal if positions are adjusted, potentially leading to a price drop.
Aptos’ price rally is on course to $10
Aptos’ price continues to gain steam, reflecting the positive sentiment in the broader cryptocurrency market. APT is up over 6% to trade at $5.00 at the time of writing after bouncing back from short-term support at around $4.50.
Like Hyperliquid, Aptos has experienced a major turnaround in its DeFi TVL, which has reached $1.16 billion from the April low of $947.77 million. The TVL increased nearly 6% in the last 24 hours, signaling confidence in the Aptos ecosystem. A further increase would contribute to keeping APT’s price steady toward the $10.00 target.

APT DeFi TVL volume | Source: DefiLlama
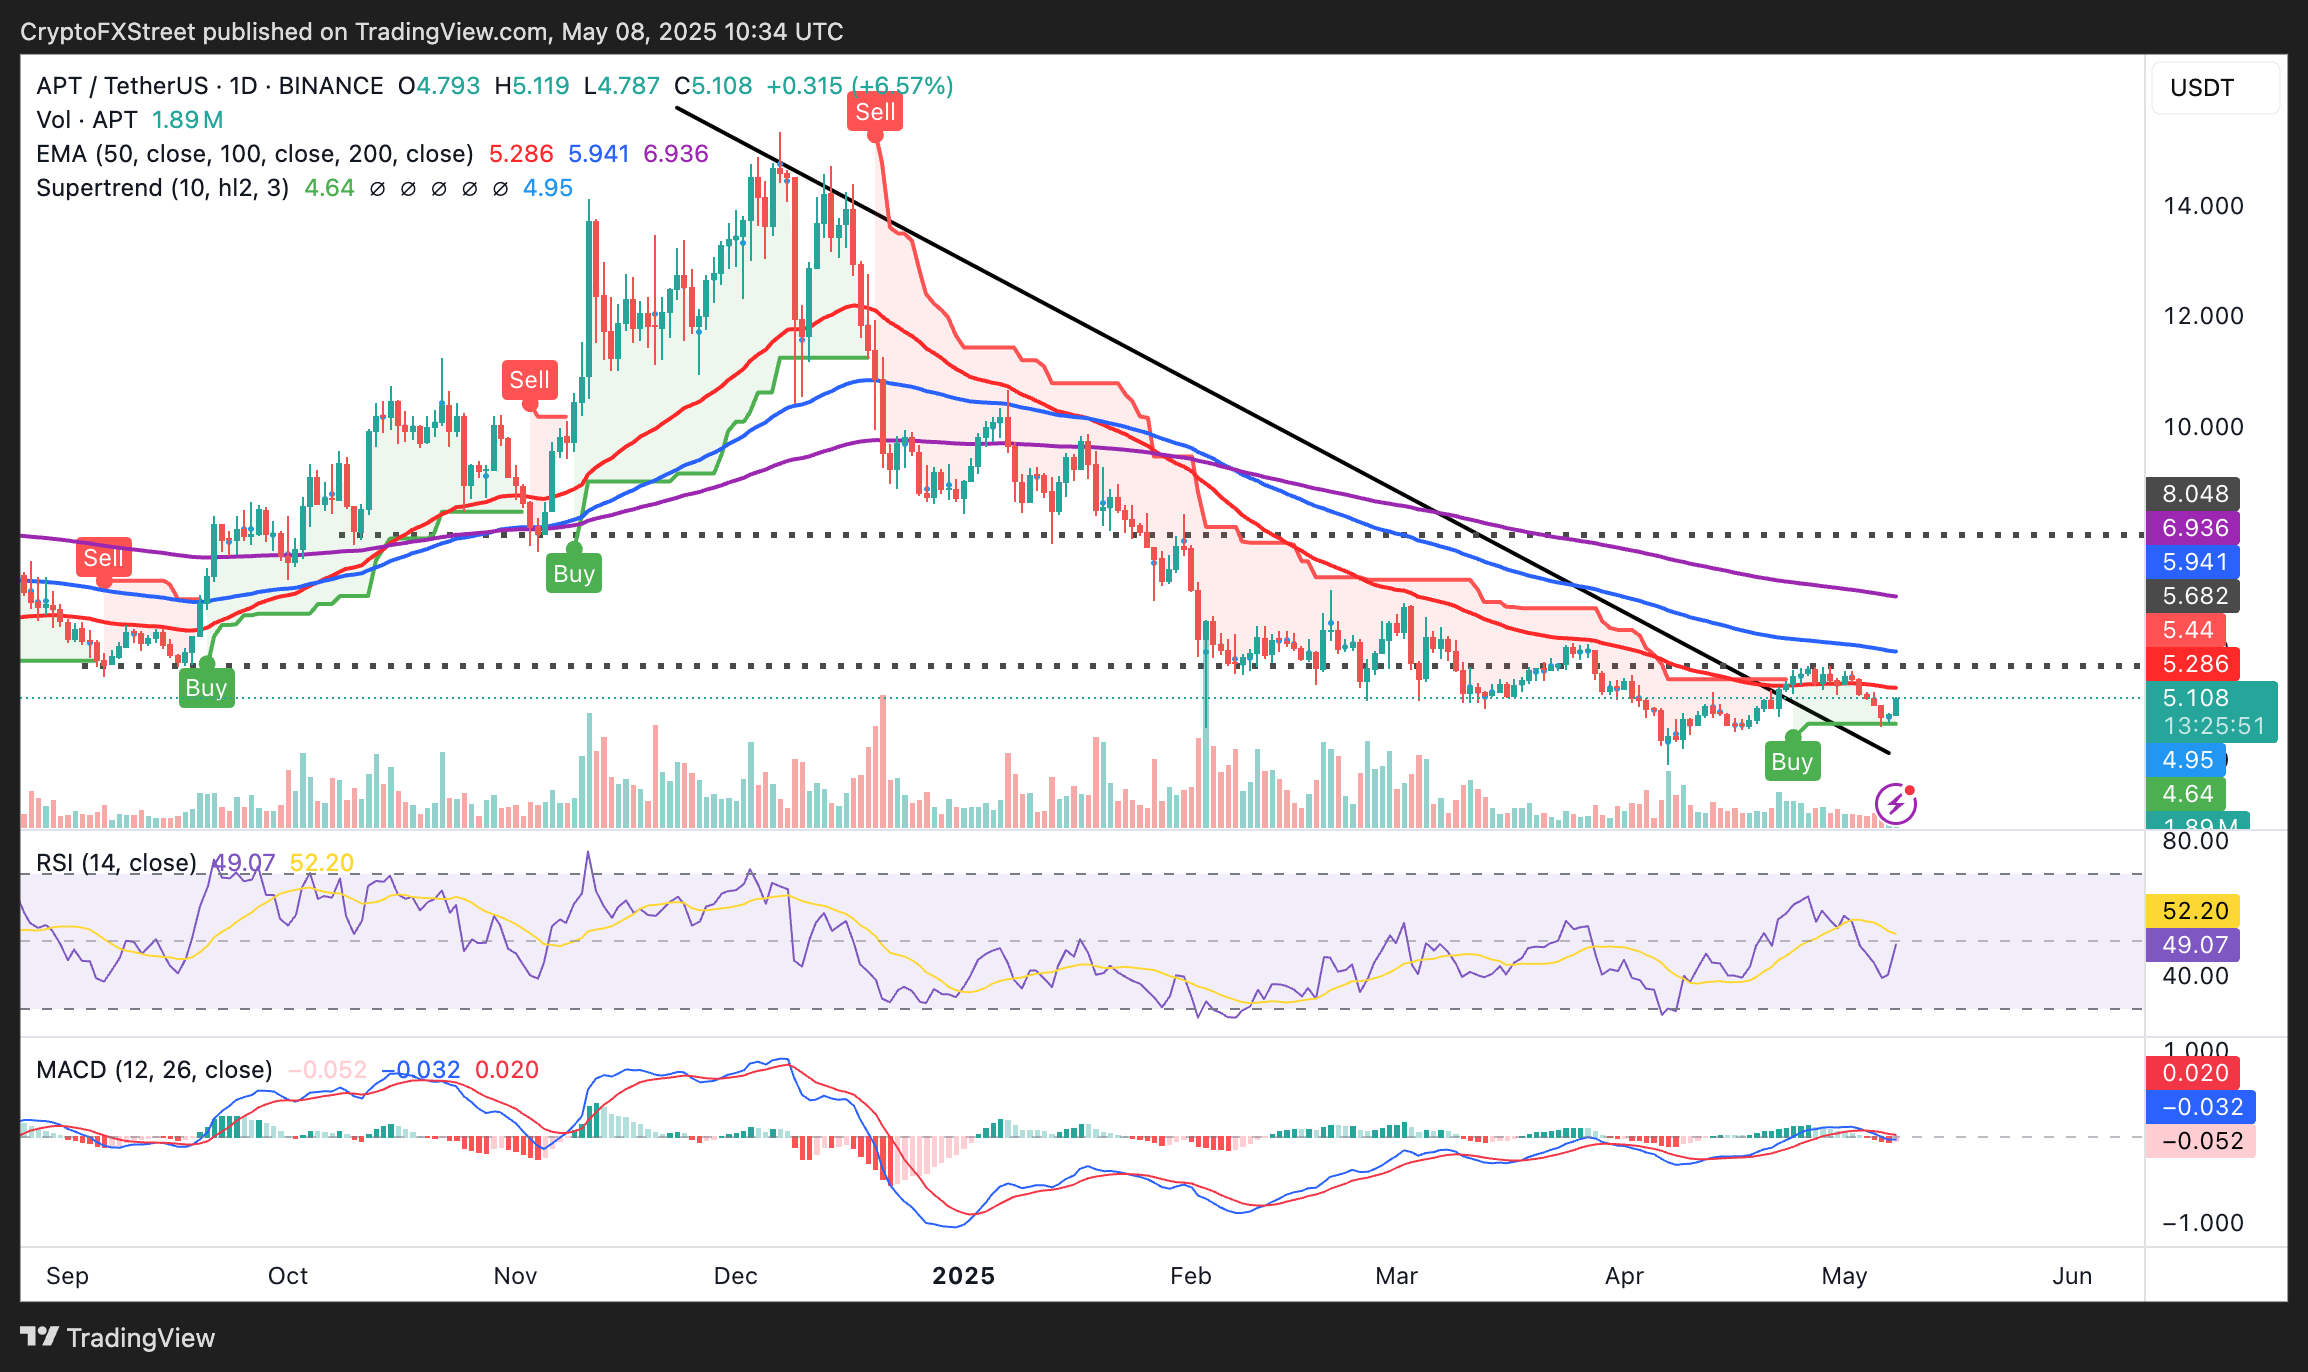
The Aptos daily chart analysis reveals that the path with the least resistance is firmly upwards, supported by a potential buy signal from the Moving Average Convergence Divergence. Trading this indicator requires confirming the MACD line (blue) crossing above the signal line (red) before activating buy orders.
Based on the upward-moving RSI indicator at 49.12, a strong bullish momentum is in play, which could see APT extend gains above the 50-day EMA resistance at $5.28. Such a move would make APT more attractive to risk-on traders, increasing the probability of a breakout towards $10.00.

APT/USDT daily chart
Still, traders should watch for resistance at the 100-day EMA near $5.94 and the 200-day EMA at $6.93, which might stall progress. If APT fails to break these levels, market dynamics could shift, possibly triggering a drop to the April 7 low of $3.89.
Cryptocurrency metrics FAQs
The developer or creator of each cryptocurrency decides on the total number of tokens that can be minted or issued. Only a certain number of these assets can be minted by mining, staking or other mechanisms. This is defined by the algorithm of the underlying blockchain technology. On the other hand, circulating supply can also be decreased via actions such as burning tokens, or mistakenly sending assets to addresses of other incompatible blockchains.
Market capitalization is the result of multiplying the circulating supply of a certain asset by the asset’s current market value.
Trading volume refers to the total number of tokens for a specific asset that has been transacted or exchanged between buyers and sellers within set trading hours, for example, 24 hours. It is used to gauge market sentiment, this metric combines all volumes on centralized exchanges and decentralized exchanges. Increasing trading volume often denotes the demand for a certain asset as more people are buying and selling the cryptocurrency.
Funding rates are a concept designed to encourage traders to take positions and ensure perpetual contract prices match spot markets. It defines a mechanism by exchanges to ensure that future prices and index prices periodic payments regularly converge. When the funding rate is positive, the price of the perpetual contract is higher than the mark price. This means traders who are bullish and have opened long positions pay traders who are in short positions. On the other hand, a negative funding rate means perpetual prices are below the mark price, and hence traders with short positions pay traders who have opened long positions.

