
Top 3 gainers ImmutableX, Morpho, Turbo: Altcoin sentiment recovers on retail investors’ return
- The Crypto Fear and Greed Index reaches 67, reflecting the bullish close in April and rising interest from retail investors.
- ImmutableX breaks above key trendline resistance, surging over 10% towards its $1.00 target.
- Morpho completes a wedge pattern breakout to test resistance at $1.45.
- Turbo bulls’ major comeback reclaims position above the 50-, 100-, and 200-day EMAs, reflecting the growing interest in meme coins.
Cryptocurrency prices are poised to extend gains following a bullish end to April. The recovery witnessed in the broader market reflects growing interest among retail investors, with select top 200 altcoins, such as ImmutableX (IMX), Morpho, and Turbo, flying the bullish flag high, with the highest gains over the past 24 hours.
Positive altcoin sentiment attracts retail investors
The total market capitalization crossed the $3 trillion mark after a 10% increase in the final eight days of April. It stands at $3.12 trillion as of the time of writing on Friday.
According to Santiment’s biweekly market update, “this surprise rebound has led many to shift their attention and profits into smaller altcoins.”
Santiment researchers say that whenever Bitcoin leads an initial rally and starts moving sideways, “investors generally start taking bigger risks in hopes of scoring even higher returns through more speculative (and riskier) purchases.”
Meme coins are experiencing a major comeback during this recovery cycle, underscoring the growing interest from retail investors. Santiment has noticed a significant increase in discussions surrounding high-risk tokens, with their respective volumes surging as illustrated in the chart below. Coincidentally, social dominance has declined for layer-1 and layer-2 altcoins, suggesting investors are inclined to speculative assets and short-term gains.
The crypto fear and greed index has remarkably recovered over the last few weeks, reaching a greed level of 67, up from an extreme fear level of around 18 observed on April 9.
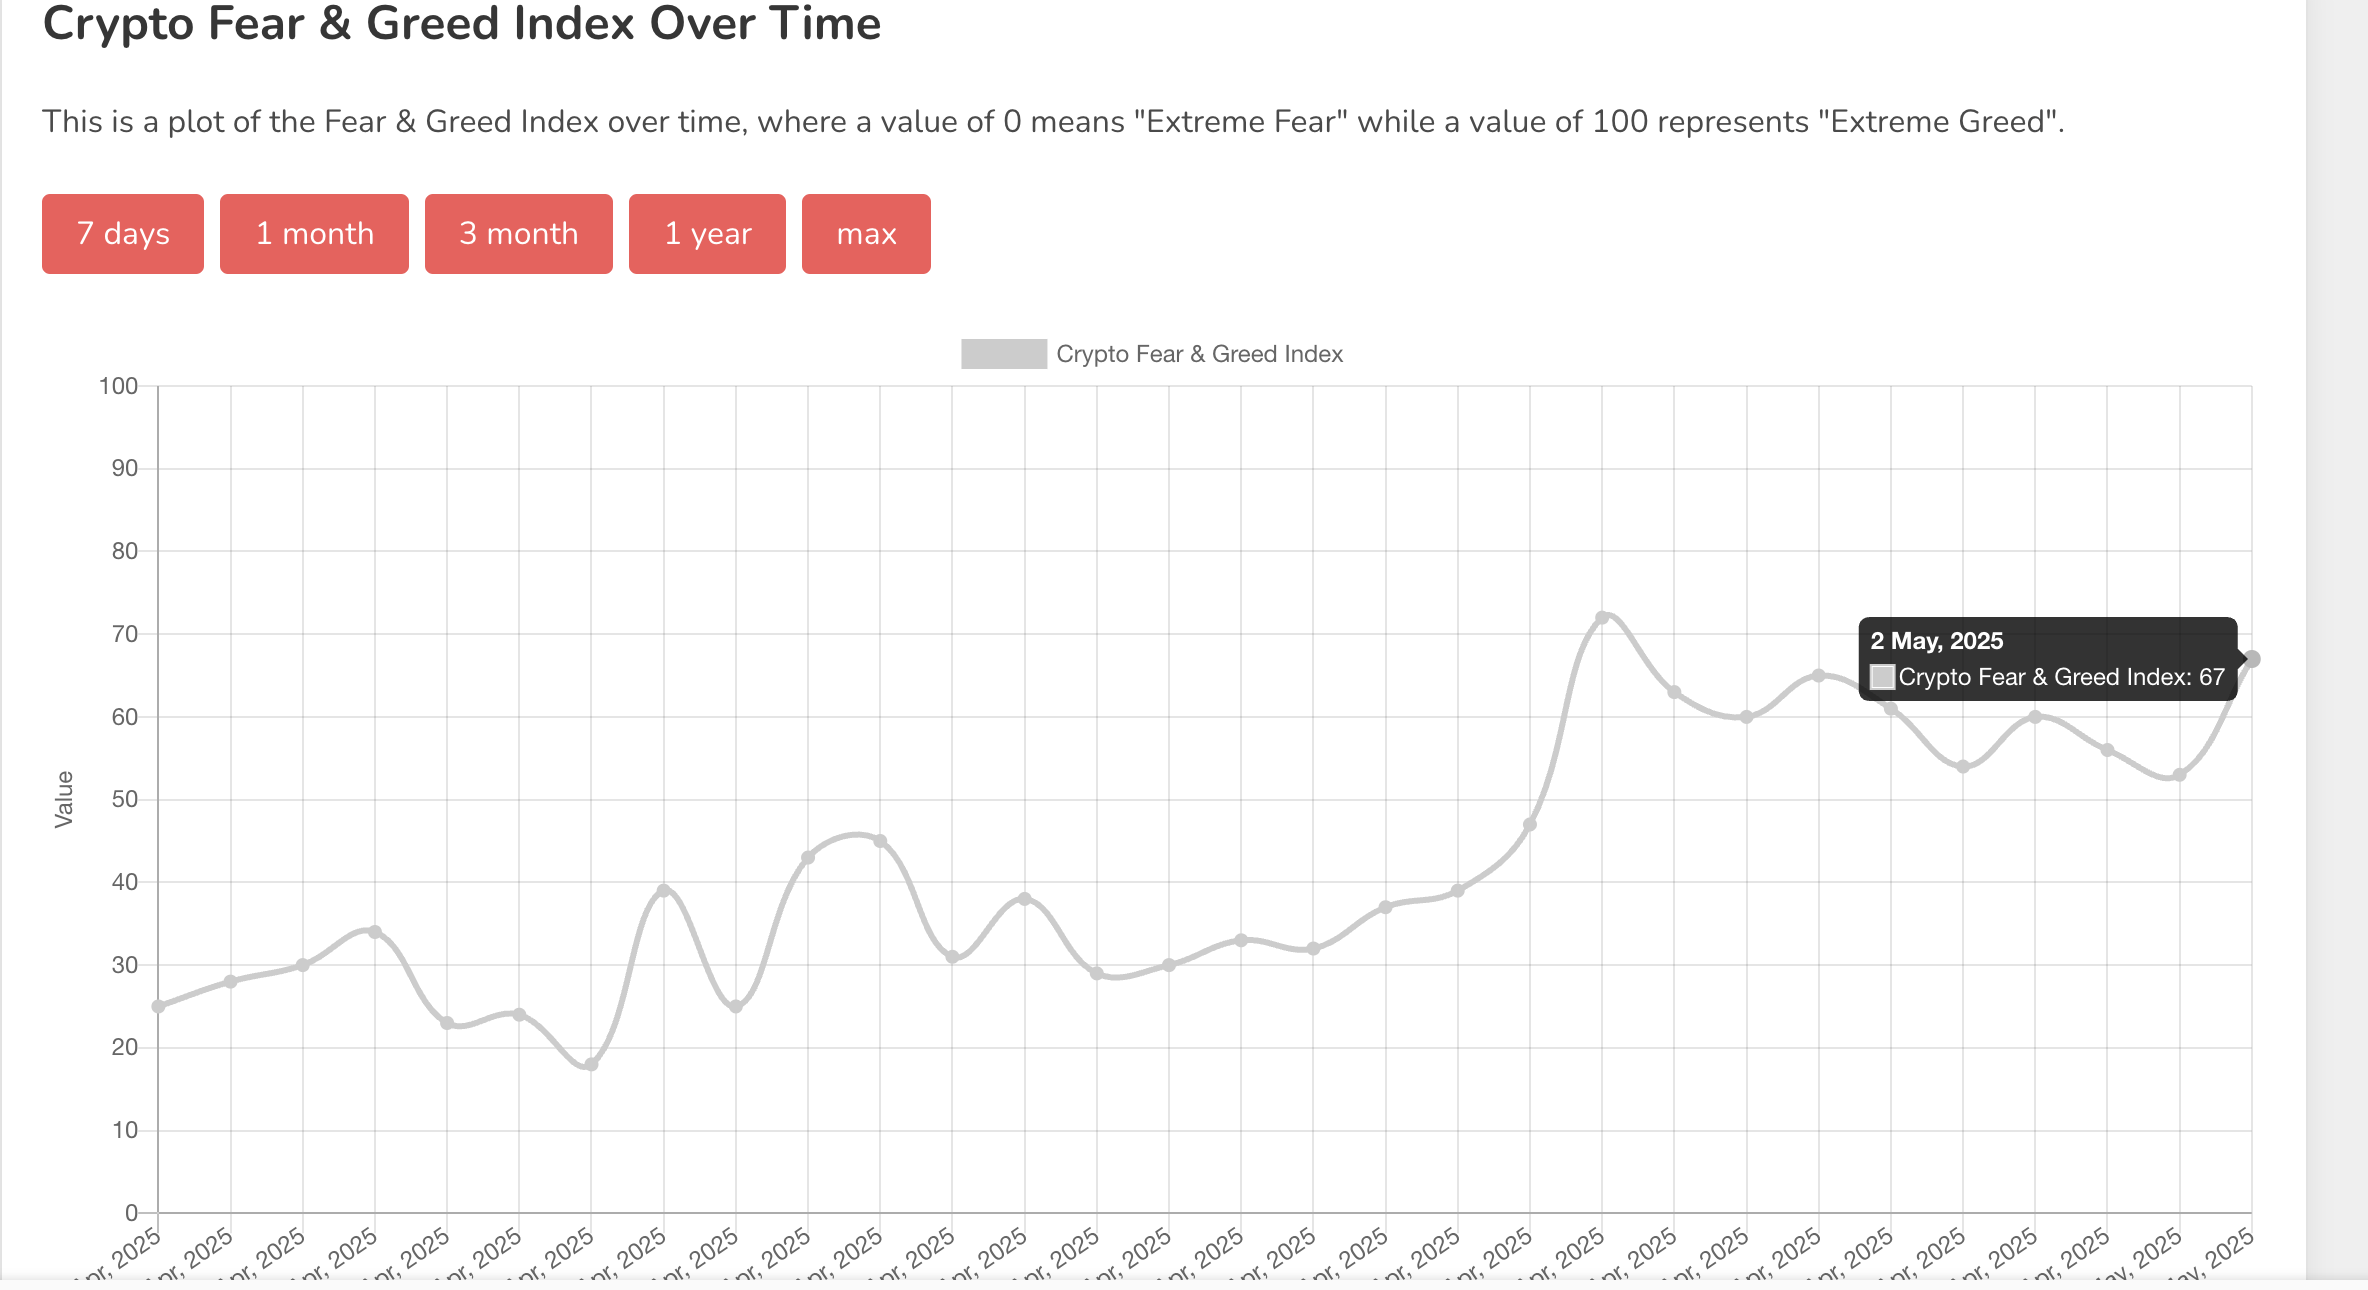
The crypto fear and greed index | Source: Alternative.me
Sentiment in global markets sank to historical lows amid United States (US) President Donald Trump’s push for reciprocal tariffs in early April. However, a major turnaround occurred after the tariffs were postponed, followed by a easing of trade tensions between the US and China.
ImmutableX accelerates bullish momentum
ImmutableX’s price extended gains to hover at $0.66 at the time of writing, supported by a bullish technical structure and robust trader interest. The token holds above the 50-day Exponential Moving Average (EMA) at $0.56 and has broken above the upper descending trendline, as bulls strive to reach higher levels.
A buy signal from the Moving Average Convergence Divergence (MACD) indicator affirms IMX’s bullish outlook. This call to buy occurred when the MACD line (blue) crossed above the signal line (red) in mid-April. Still, the SuperTrend indicator flashed another buy signal on April 22, paving the way for an extended run, targeting highs above $1.00.
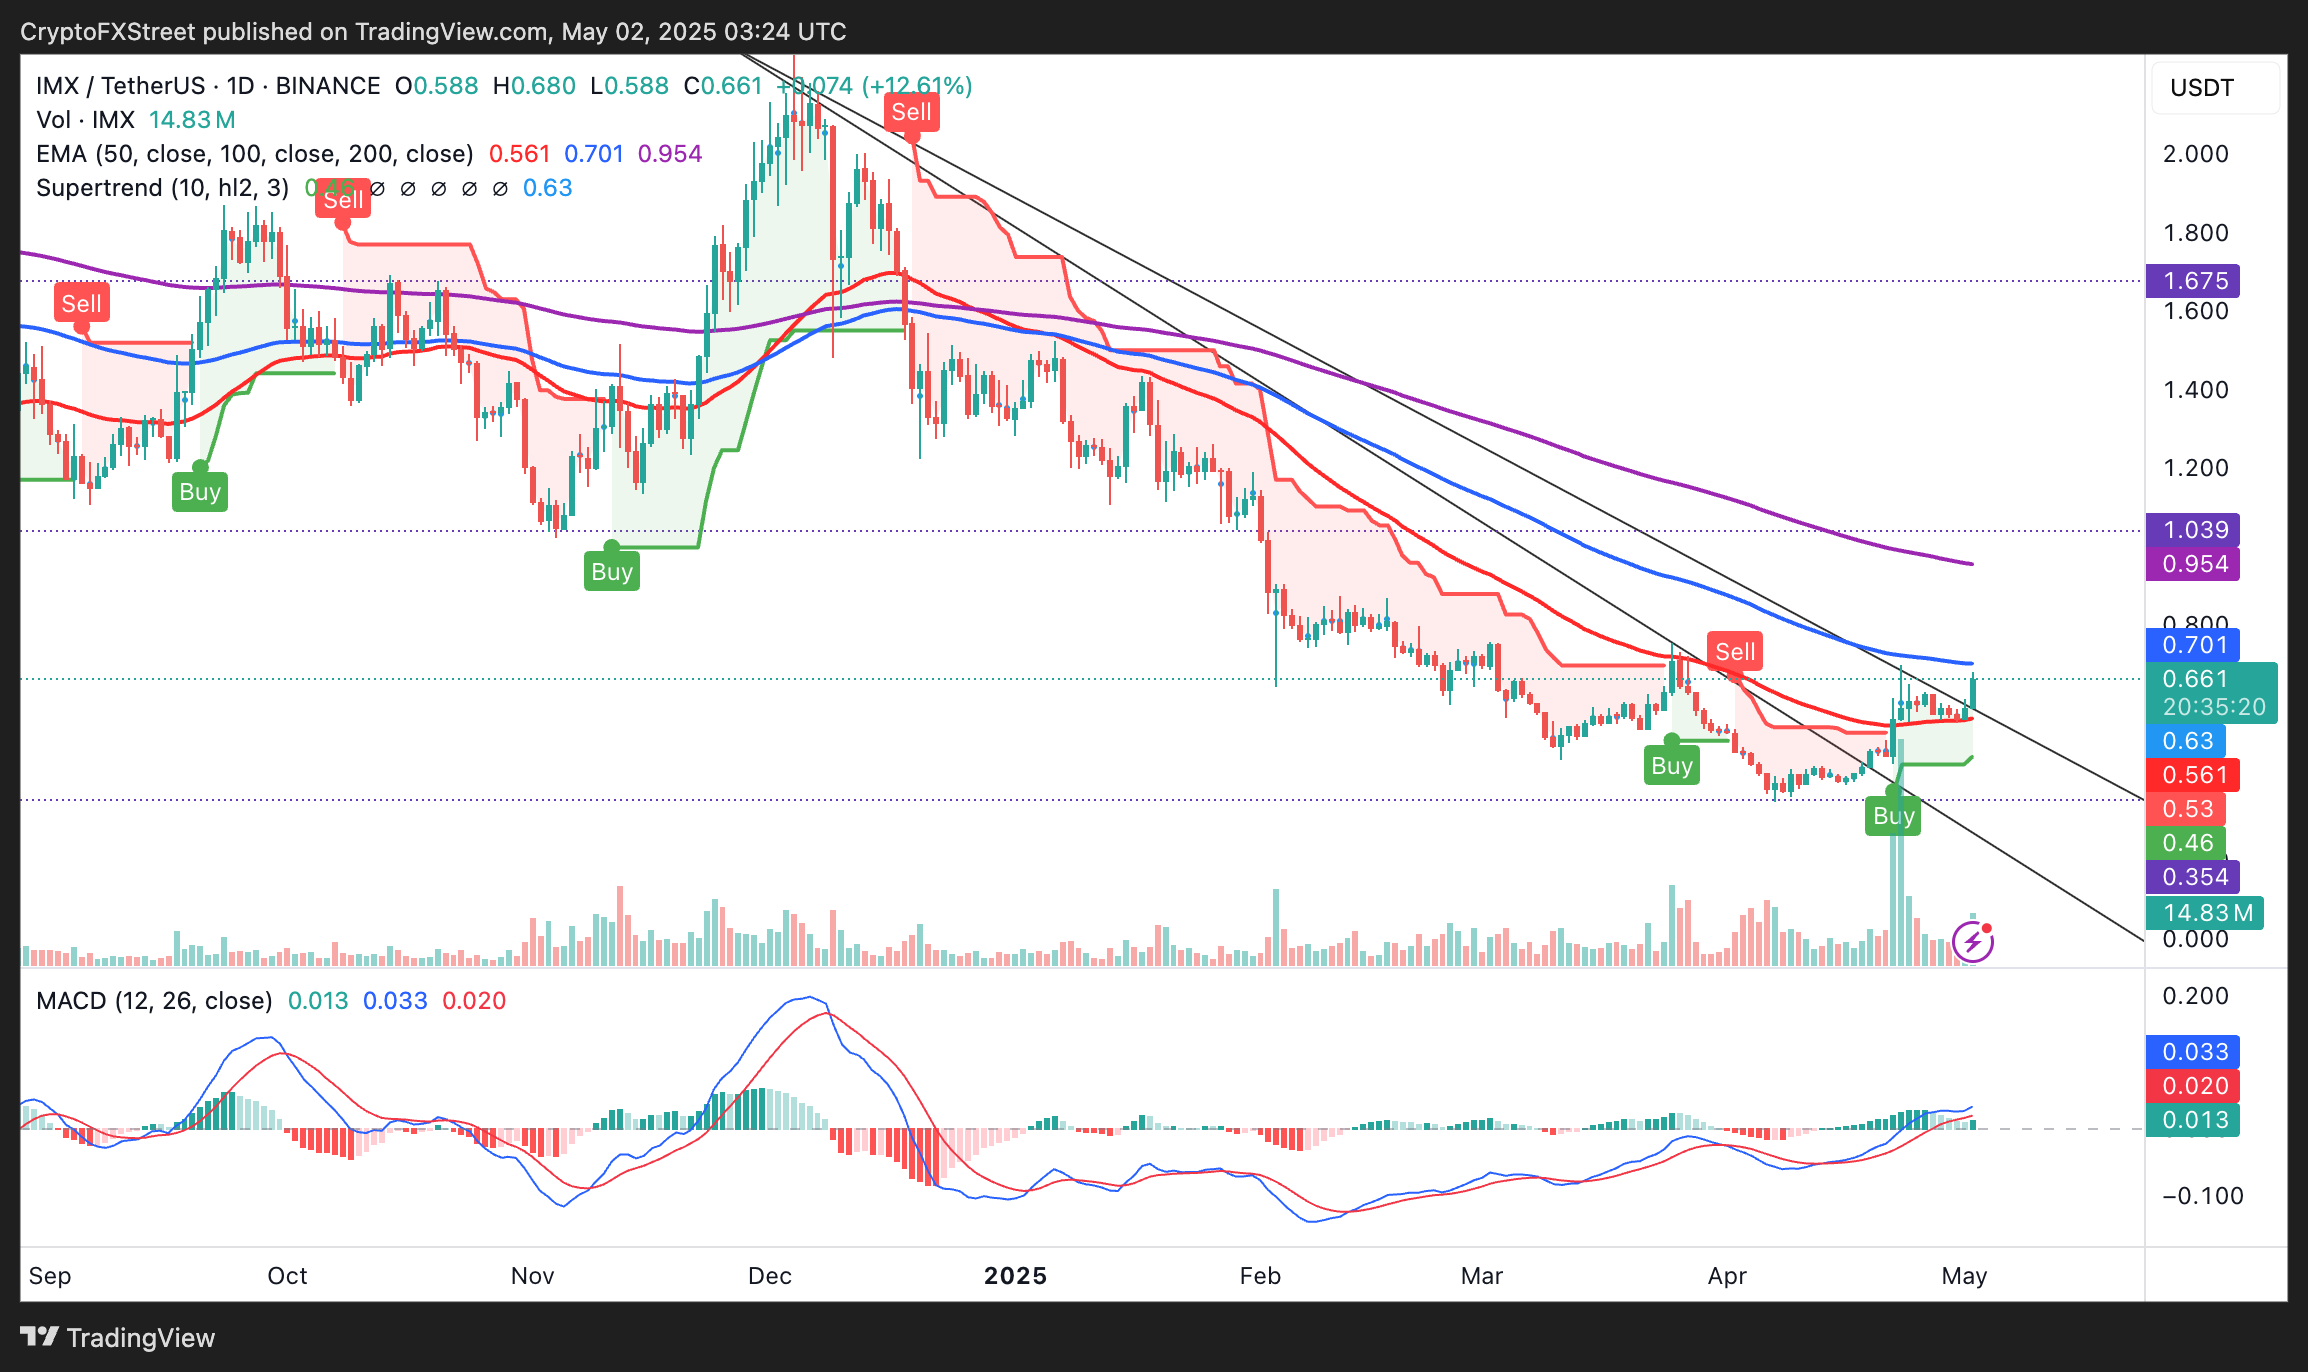
IMX/USDT daily chart
Despite the bullish structure, ImmutableX sits below the 100- and 200-day EMAs at $0.70 and $0.95, which could challenge the uptrend. Traders should prepare for potential profit-taking at these levels. If IMX reverses due to strong overhead pressure, the 50-day EMA at $0.56 may provide support. A break below this could lead to a retest of April’s low at $0.35.
Morpho consolidates following major breakout
Morpho’s price has begun to move sideways after a major run from its April low at $0.82. The token confirmed a wedge pattern breakout on April 17, clearing the way for a rebound to test $1.45 resistance during the Asian session on Friday.
Trading at $1.43 at the time of writing, Morpho shows signs of maintaining its uptrend, bolstered by a SuperTrend buy signal and the MACD crossing above the mean line with expanding green histograms.
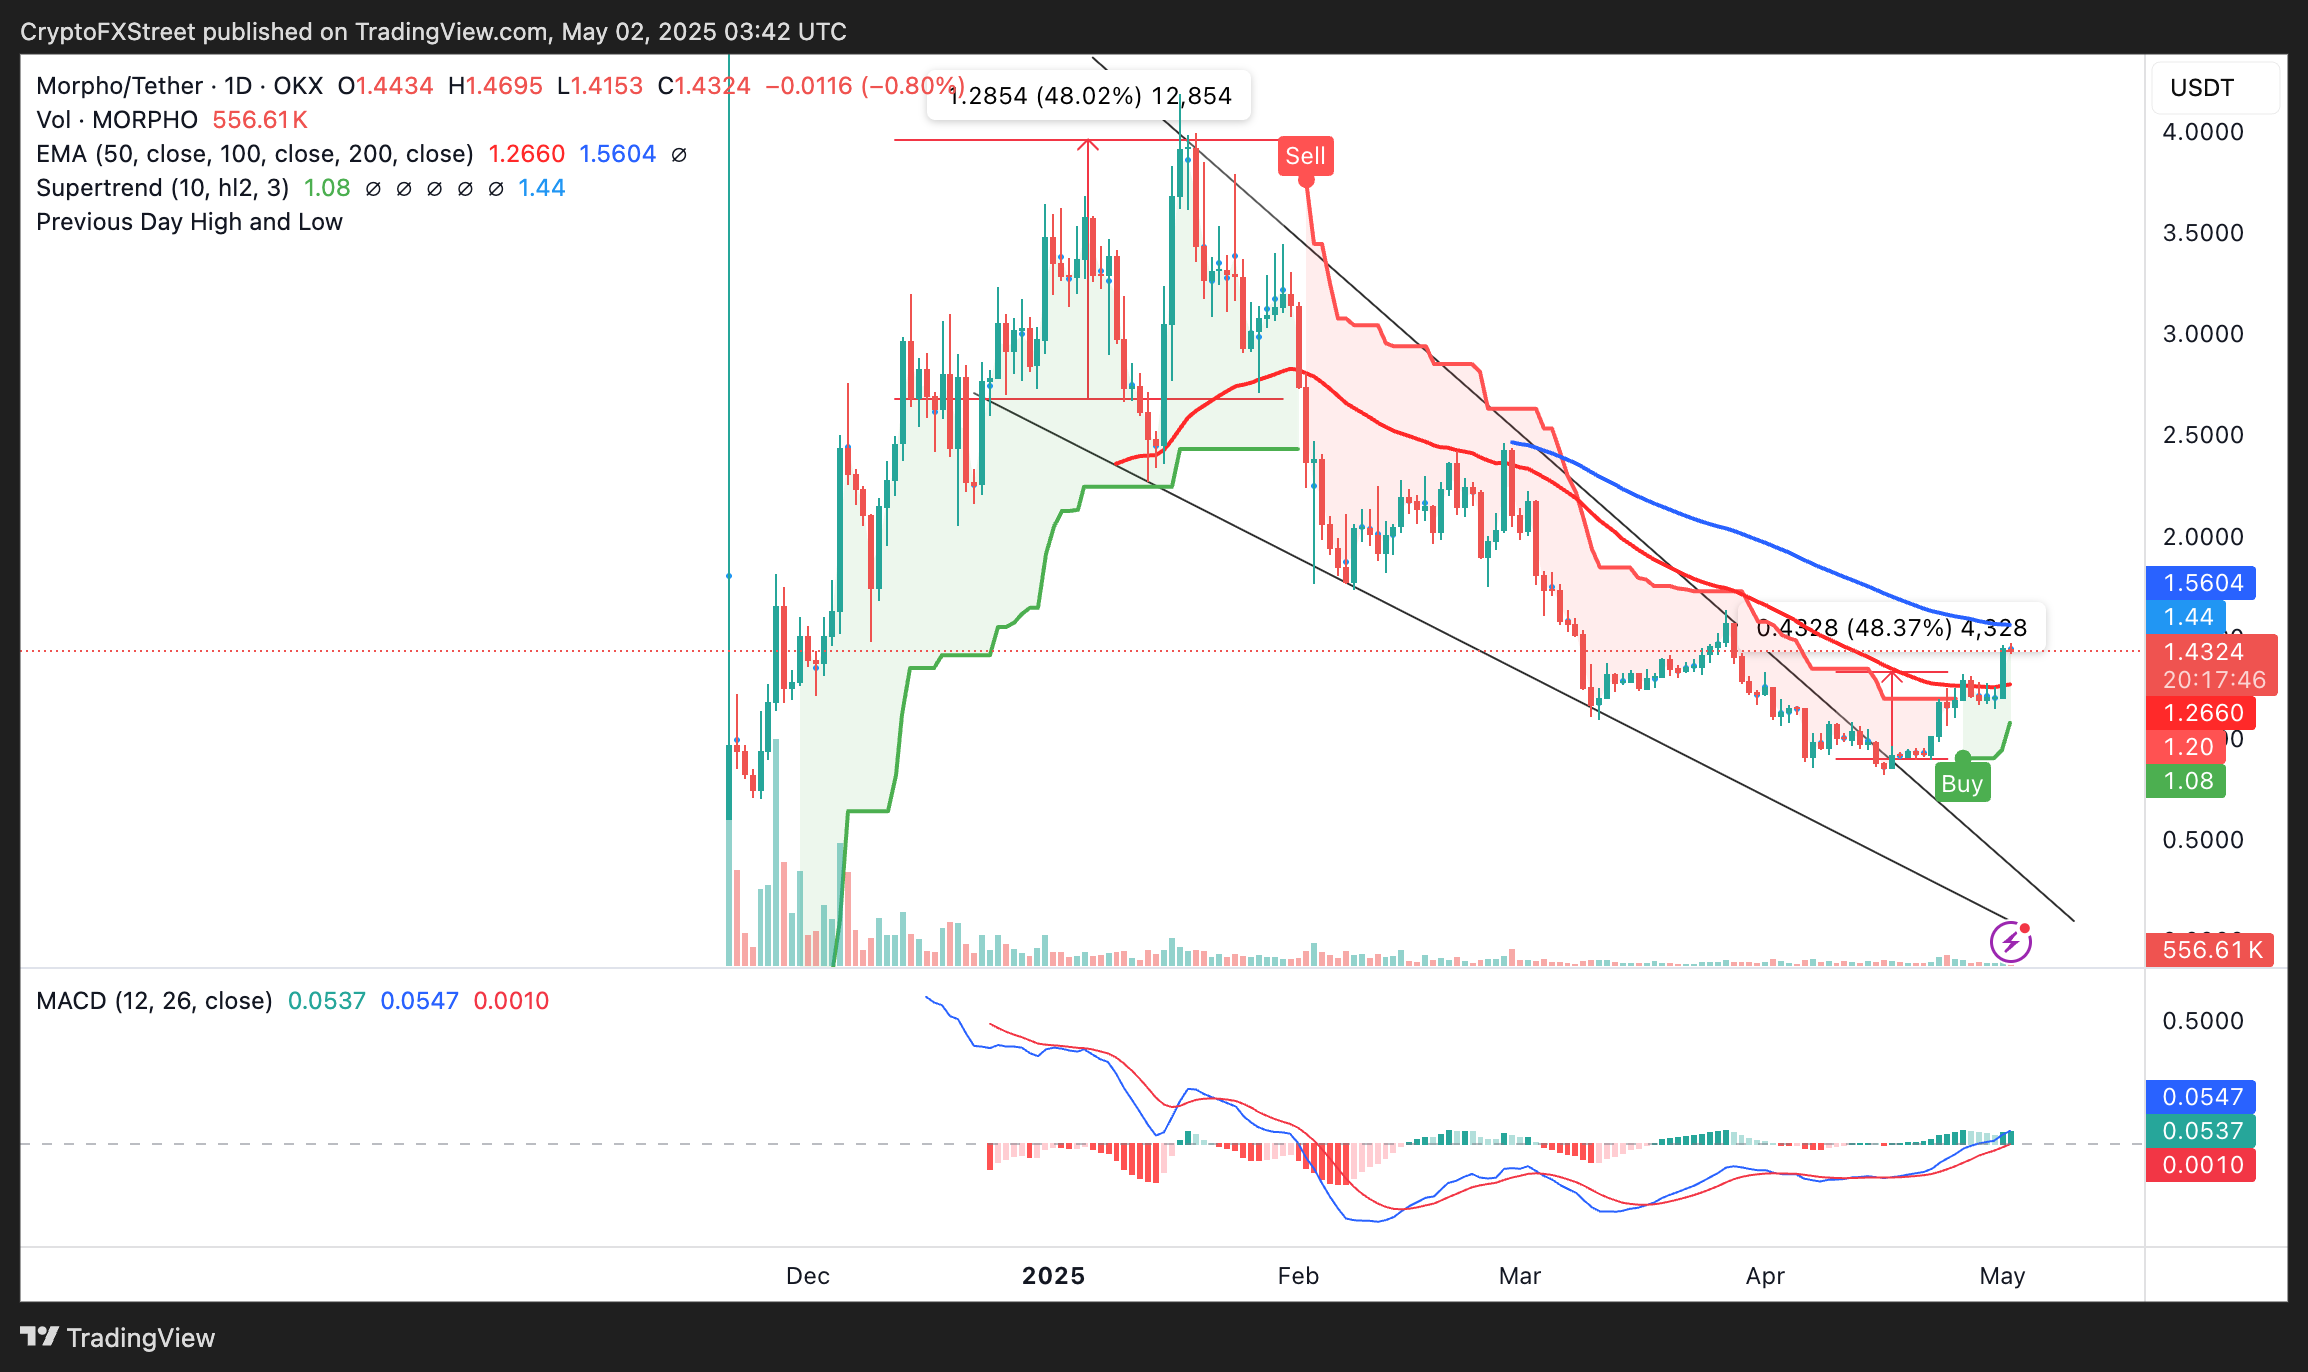
MORPHO/USDT daily chart
A break above the immediate 100-day EMA resistance at $1.56 could push the token closer to its $2.00 short-term goal. However, in the event of a reversal, support at the 50-day EMA, around $1.26, would come in handy to prevent extended losses toward its April low of $0.82.
Turbo uptrend steady above the 200-day EMA
Turbo is among the meme coins that have performed well during April’s bullish comeback. The token has experienced a staggering 256% surge from $0.0013, currently trading at $0.0049 at the time of writing.
The 200-day EMA at $0.0045 could reduce downside risks, encouraging traders to seek exposure and anticipating another breakout towards the psychological resistance at $0.01.
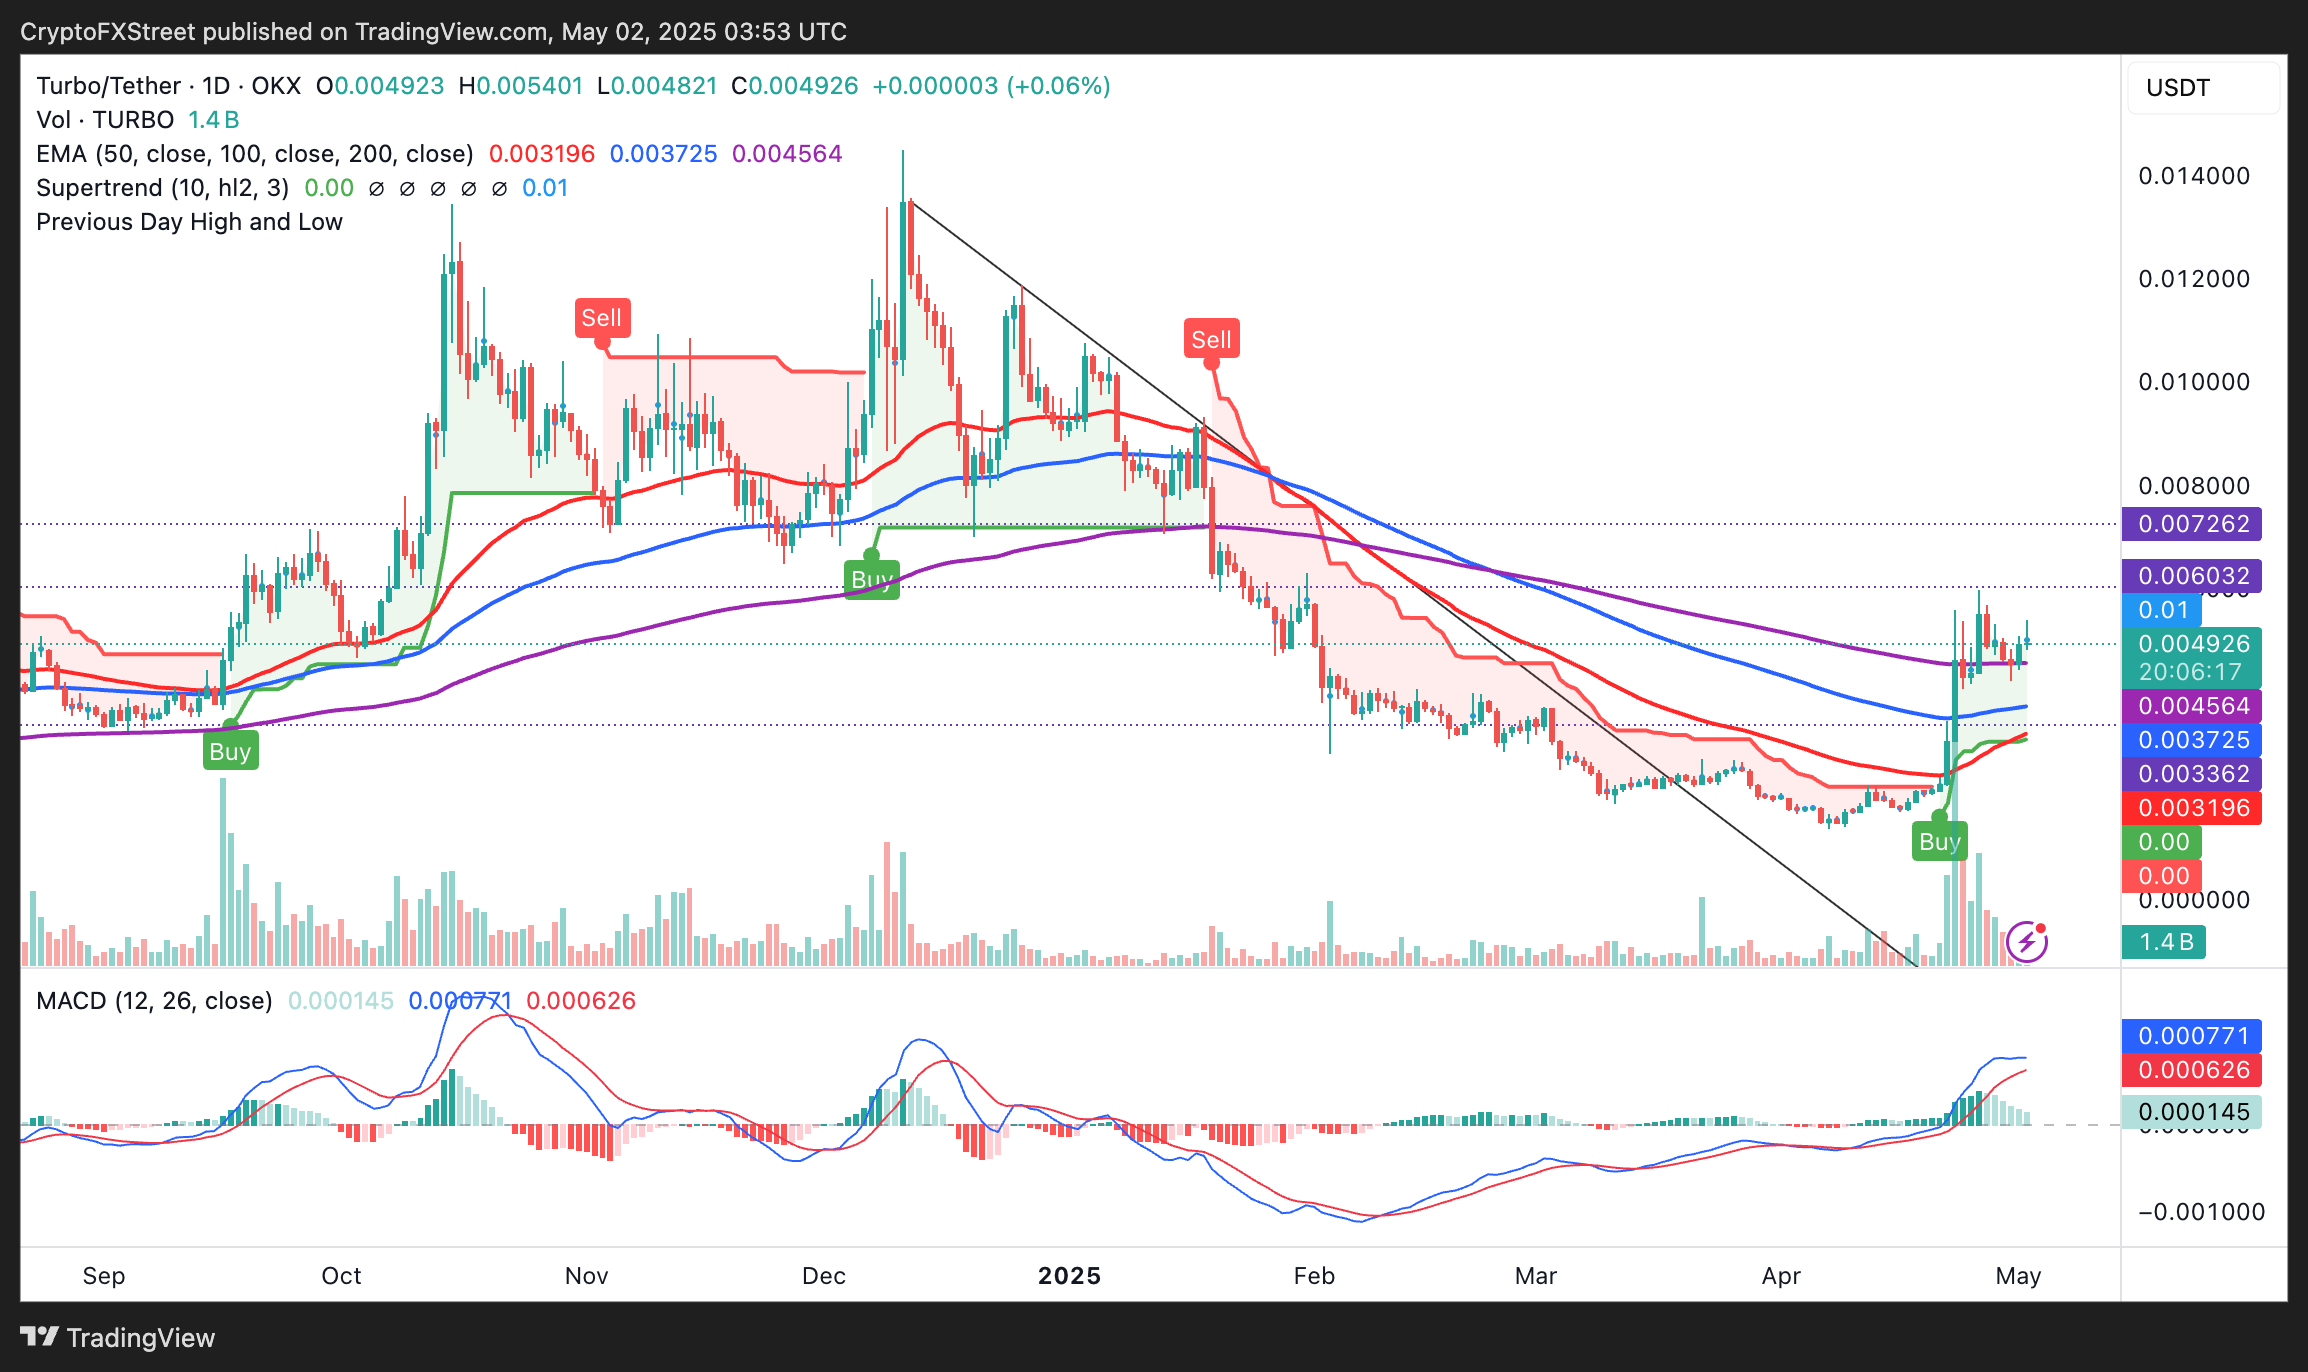
TURBO/USDT daily chart
However, supply zones at $0.0060 and $0.0072 could slow the rally due to potential profit-taking. If selling pressure overwhelms the bulls, Turbo could extend the down leg below the 200-day EMA at $0.0045 to test support at the 100-day EMA ($0.0037) and the 50-day EMA ($0.0031).
Cryptocurrency prices FAQs
Token launches influence demand and adoption among market participants. Listings on crypto exchanges deepen the liquidity for an asset and add new participants to an asset’s network. This is typically bullish for a digital asset.
A hack is an event in which an attacker captures a large volume of the asset from a DeFi bridge or hot wallet of an exchange or any other crypto platform via exploits, bugs or other methods. The exploiter then transfers these tokens out of the exchange platforms to ultimately sell or swap the assets for other cryptocurrencies or stablecoins. Such events often involve an en masse panic triggering a sell-off in the affected assets.
Macroeconomic events like the US Federal Reserve’s decision on interest rates influence crypto assets mainly through the direct impact they have on the US Dollar. An increase in interest rate typically negatively influences Bitcoin and altcoin prices, and vice versa. If the US Dollar index declines, risk assets and associated leverage for trading gets cheaper, in turn driving crypto prices higher.
Halvings are typically considered bullish events as they slash the block reward in half for miners, constricting the supply of the asset. At consistent demand if the supply reduces, the asset’s price climbs.
추천 기사


