
Solana Price Forecast: SOL eyes bullish breakout as stablecoin market cap hits $13 billion and ETF odds soar
- Solana price hovers around $149 on Thursday after finding support around its 50-day EMA the previous day.
- DeFiLlama data indicate that SOL’s stablecoin market cap has surged to $13 billion, reflecting increasing network usage.
- Bloomberg Intelligence boosts Solana ETF approval odds to 90%.
Solana (SOL) price is stabilizing at around $149 at the time of writing on Thursday, after finding support around its 50-day Exponential Moving Average (EMA) the previous day. On-chain data support a bullish thesis as SOL’s stablecoin market capitalization has surged to $13 billion, reflecting increasing network usage. Moreover, Bloomberg Intelligence reports that the likelihood of US regulators approving a Solana spot Exchange-Traded Fund (ETF) in 2025 has risen to 90%.
Solana stablecoin activity soars
The value of stablecoins on the Solana blockchain has steadily risen since early February. According to DefiLlama data, the stablecoin market capitalization currently stands at $13.06 billion. Such stablecoin activity and value increase on the SOL project indicate a bullish outlook, as it boosts network usage and can attract more users to the ecosystem, driven by Decentralized Finance (DeFi), meme coins, and payment use cases.
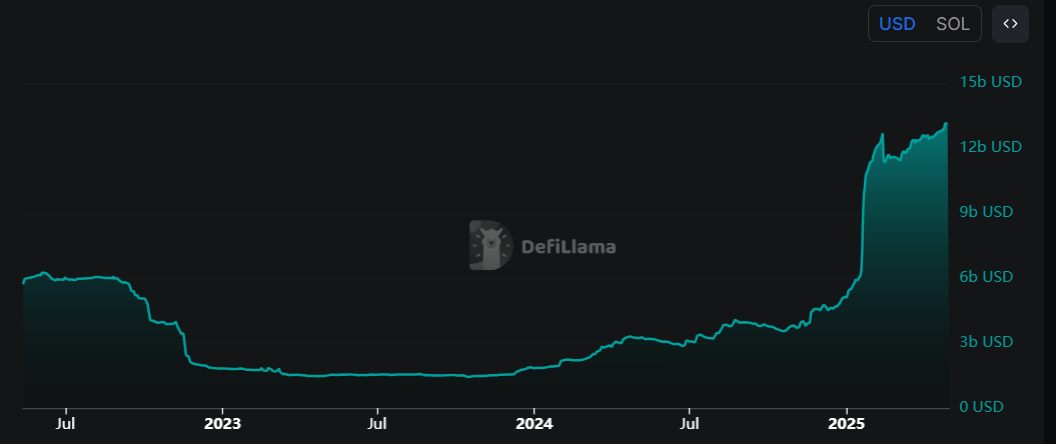
Solana stablecoin market capitalization chart. Source: DefiLlama
Solana ETF approval chances rise to 90%, fueling market optimism
According to Bloomberg Intelligence, the likelihood of US regulators approving a Solana spot ETF in 2025 has risen to 90%. The report also shows that other spot crypto ETFs, such as Litecoin (LTC), Ripple (XRP), Dogecoin (DOGE), Cardano (ADA), Polkadot (DOT), Hedera (HBAR), and Avalanche (AVAX), have odds above 70%.
Six asset managers — Grayscale, VanEck, 21Shares, Canary, Bitwise, and Franklin — have filed for an SOL ETF and are awaiting clearance from the US Securities and Exchange Commission (SEC) to list the ETF. ETF filings by big investment companies are generally positive signs for Solana in the long term, as an ETF can make it easier for traditional investors to gain exposure to SOL without needing to purchase and store the cryptocurrency directly. Moreover, approving an ETF could lend more legitimacy to SOL and increase liquidity.
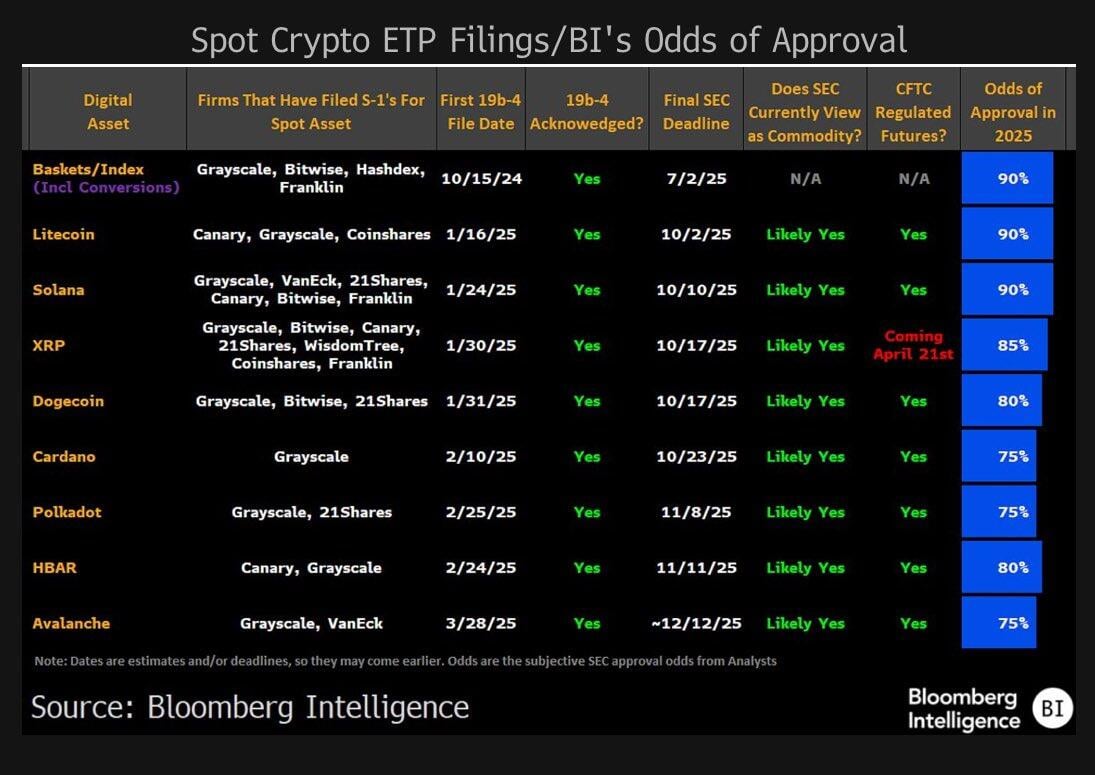
Spot crypto ETF filing chart. Source: Bloomberg Intelligence
Solana Price Forecast: SOL finds support around its 50-day EMA
Solana price faced rejection around its daily resistance level of $160 last week. It declined by 5% over the next five days, finding support around its 50-day EMA at $140.30 on Wednesday. At the time of writing on Thursday, it hovers around $149.
If the 50-day EMA at $140.30 continues to hold and SOL closes above $160, it could extend the rally to retest its next daily resistance at $177.66.
The Relative Strength Index (RSI) on the daily chart reads 61, above its neutral level of 50, indicating bullish momentum.
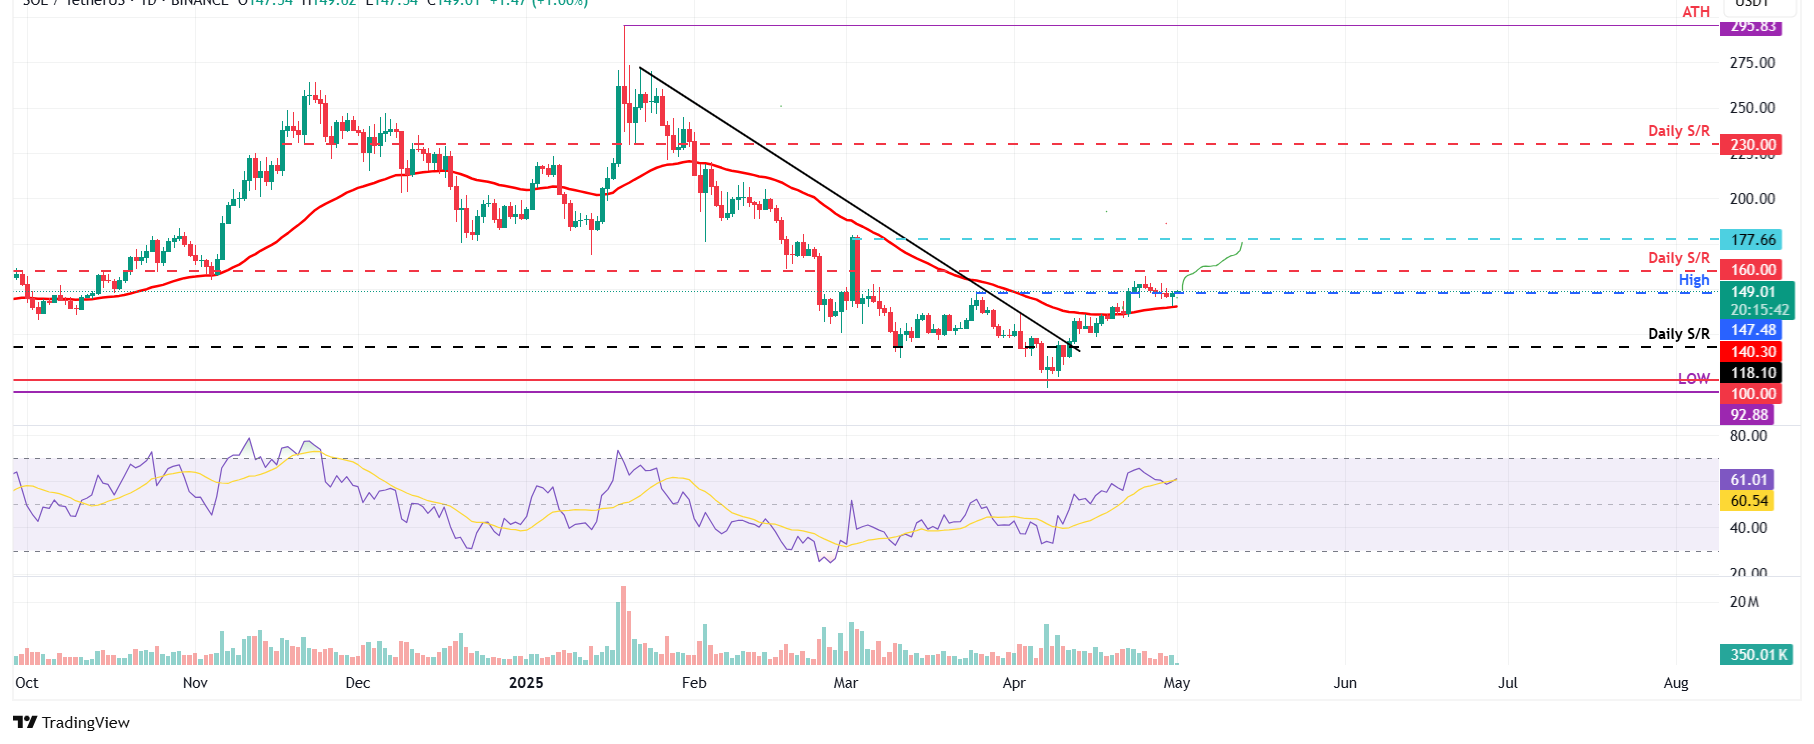
SOL/USDT daily chart
However, if SOL closes below $140.30, its 50-day EMA could extend the correction to retest its daily support level at $118.10.
추천 기사


