
EUR/USD Price Analysis: Bullish trend holds despite minor pullback after European session
- EUR/USD trades near the mid-1.13 to low-1.14 zone after a slight pullback on Tuesday.
- Overall bias remains bullish, backed by key moving averages despite mixed signals from indicators.
- Support rests around the mid-1.13 area while resistance is found just under the 1.14 handle.
The EUR/USD is flashing a bullish tone on Tuesday’s session after the European close, even as the pair slightly retraced from earlier highs and now trades near the mid-1.13 to low-1.14 area. Despite a modest dip during the session, broader technical signals continue to suggest upside potential. While the Relative Strength Index (RSI) sits at a neutral reading and the MACD issues a sell signal, the bullish bias is reinforced by moving averages aligned to the upside.
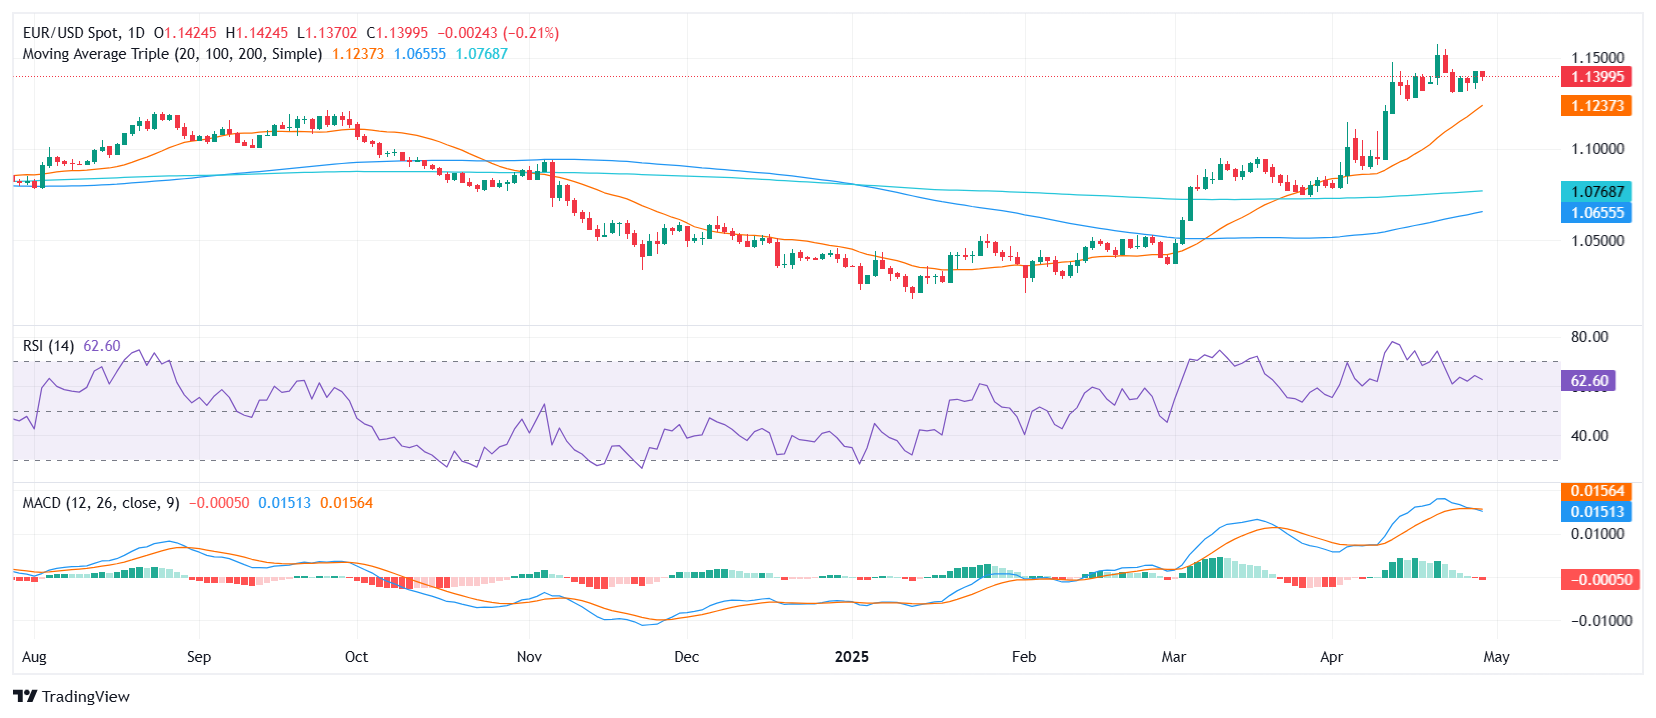
Looking deeper into the indicators, the RSI hovers around 63, staying comfortably out of overbought territory, suggesting the pair still has room to run. The MACD, on the other hand, provides a short-term sell signal, hinting at some ongoing consolidation or potential pullback. The Average Directional Index (ADX) around 51 reflects a neutral trend strength, and the Stochastic RSI remains low near 16, implying that bearish momentum is not yet dominant.
On the positive side, the bullish structure remains intact thanks to the 20-day simple moving average at 1.1240, the 100-day at 1.0659, and the 200-day at 1.0774 — all pointing upward. Exponential moving averages also support the outlook, with the 10-day EMA at 1.1357 and 30-day EMA at 1.1149, reinforcing the upward trend.
Support is seen around 1.1380, followed by 1.1357 and deeper near 1.1249. On the upside, resistance comes into play around 1.1395. While short-term signals may suggest some hesitation, the broader technical framework still favors bullish continuation as long as the pair holds above key support zones.
Daily Chart
추천 기사


