

Meme coins to watch as Bitcoin price steadies
- Bitcoin price hovers around $95,000, supported by continued spot BTC ETFs’ inflows.
- Trump Official is a key meme coin to watch ahead of a stakeholder dinner to be attended by President Donald Trump.
- Dogwifhat price is up 47% in April and looks set to post its first positive monthly returns this year.
Bitcoin (BTC) is consolidating at $95,045 at the time of writing on Tuesday, following three consecutive weeks of gains, and maintaining a steady uptrend despite a rejection at $95,758 on Friday. With BTC showing signs of a potential surge beyond $100,000, investors might explore meme coins like Trump Official (TRUMP) and dogwifhat (WIF), which could offer higher profit margins.
Bitcoin price runs into critical resistance
Bitcoin's price appears poised to approach the psychological $100,000 level, supported by surging spot Exchange Traded Funds (ETF) inflows. According to SoSoValue, spot BTC ETFs recorded a total net inflow of approximately $591 million on Monday, marking seven consecutive days of inflows.
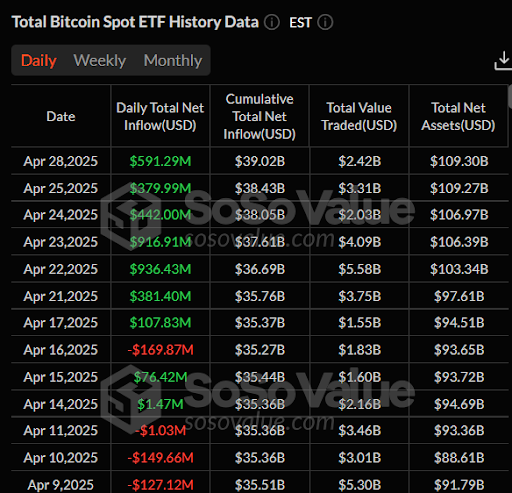
Bitcoin ETF net inflows | Source: SoSoValue
The week ending April 25 recorded $3.06 billion in net inflows, signaling growing interest and investor confidence. Easing trade tensions between the United States (US) and China is another factor likely driving interest in riskier assets, such as Bitcoin and meme coins.
The Relative Strength Index (RSI) indicator, at 67.75, is close to overbought levels, underscoring robust bullish momentum. If Bitcoin breaches resistance at $96,000, the uptrend could accelerate towards $100,000.
Still, traders should be wary of a potential reversal if the RSI indicator crosses above 70 into overbought territory. The region between $92,000 and $93,000 has the potential to provide support and liquidity if the BTC price dips.
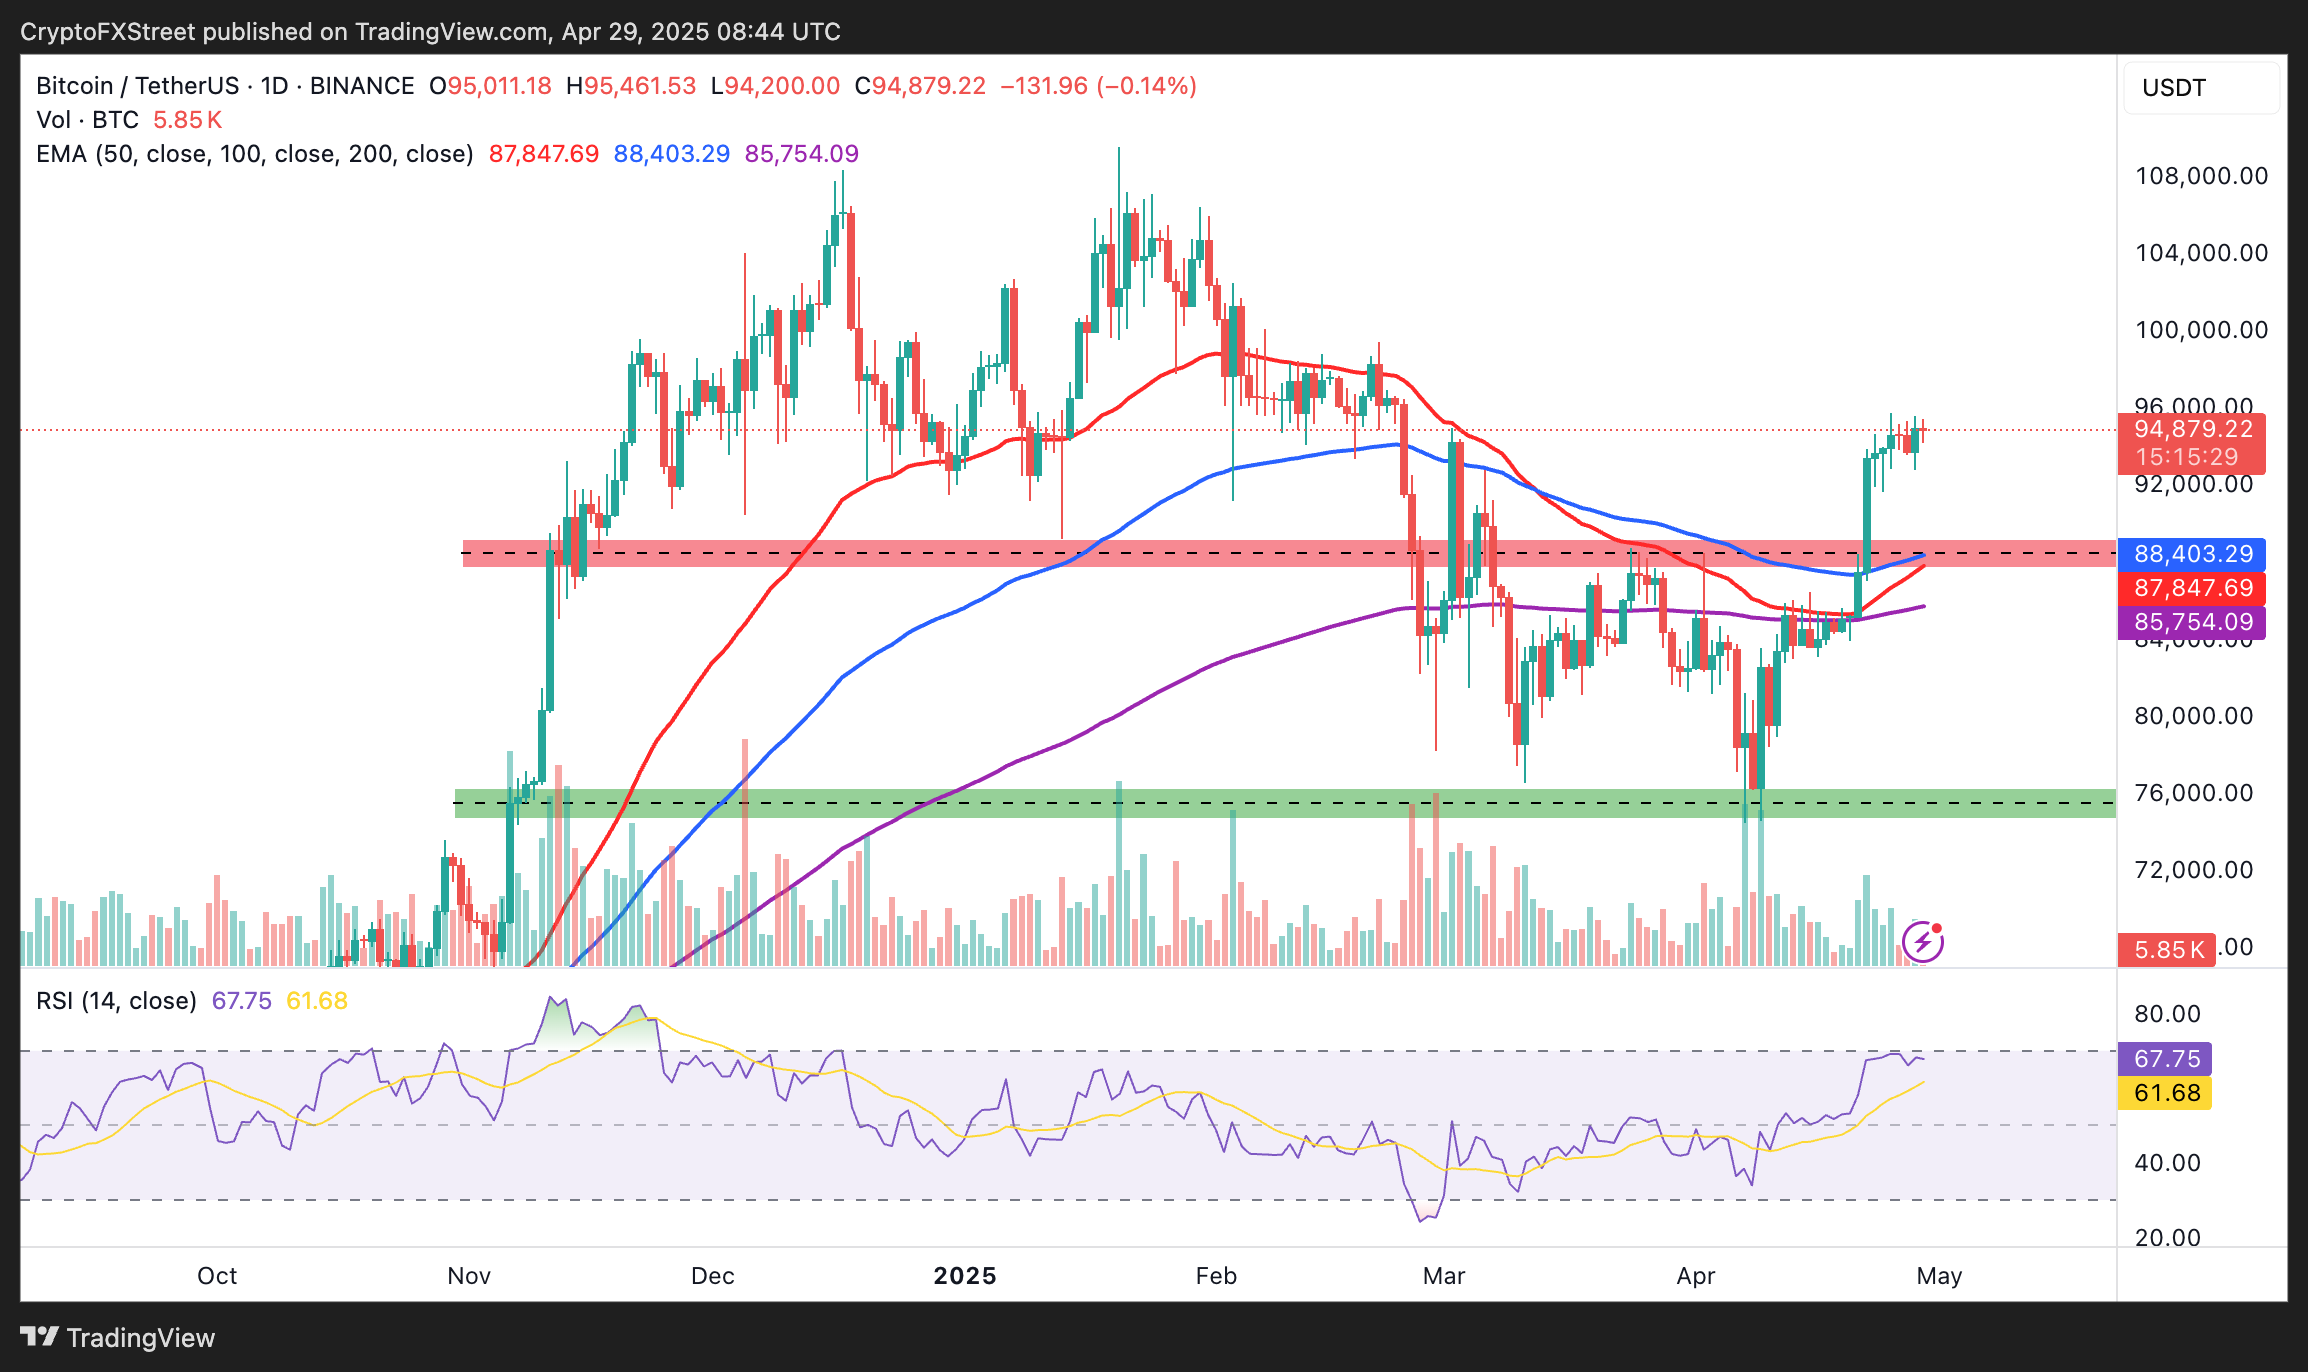
BTC/USDT daily chart
Trump Official decouples from other meme coins
The Official Trump meme coin has surged 95% from its April 7 low of $7.14, currently trading at $14.00. This follows a rejection from its monthly high of $16.44 on Saturday.
TRUMP’s position below the 100-day Exponential Moving Average (EMA) at $15.10 indicates waning bullish momentum, while the RSI indicator, declining at 64.77 after reversing from an overbought level of 75, highlights increasing bearish pressure.
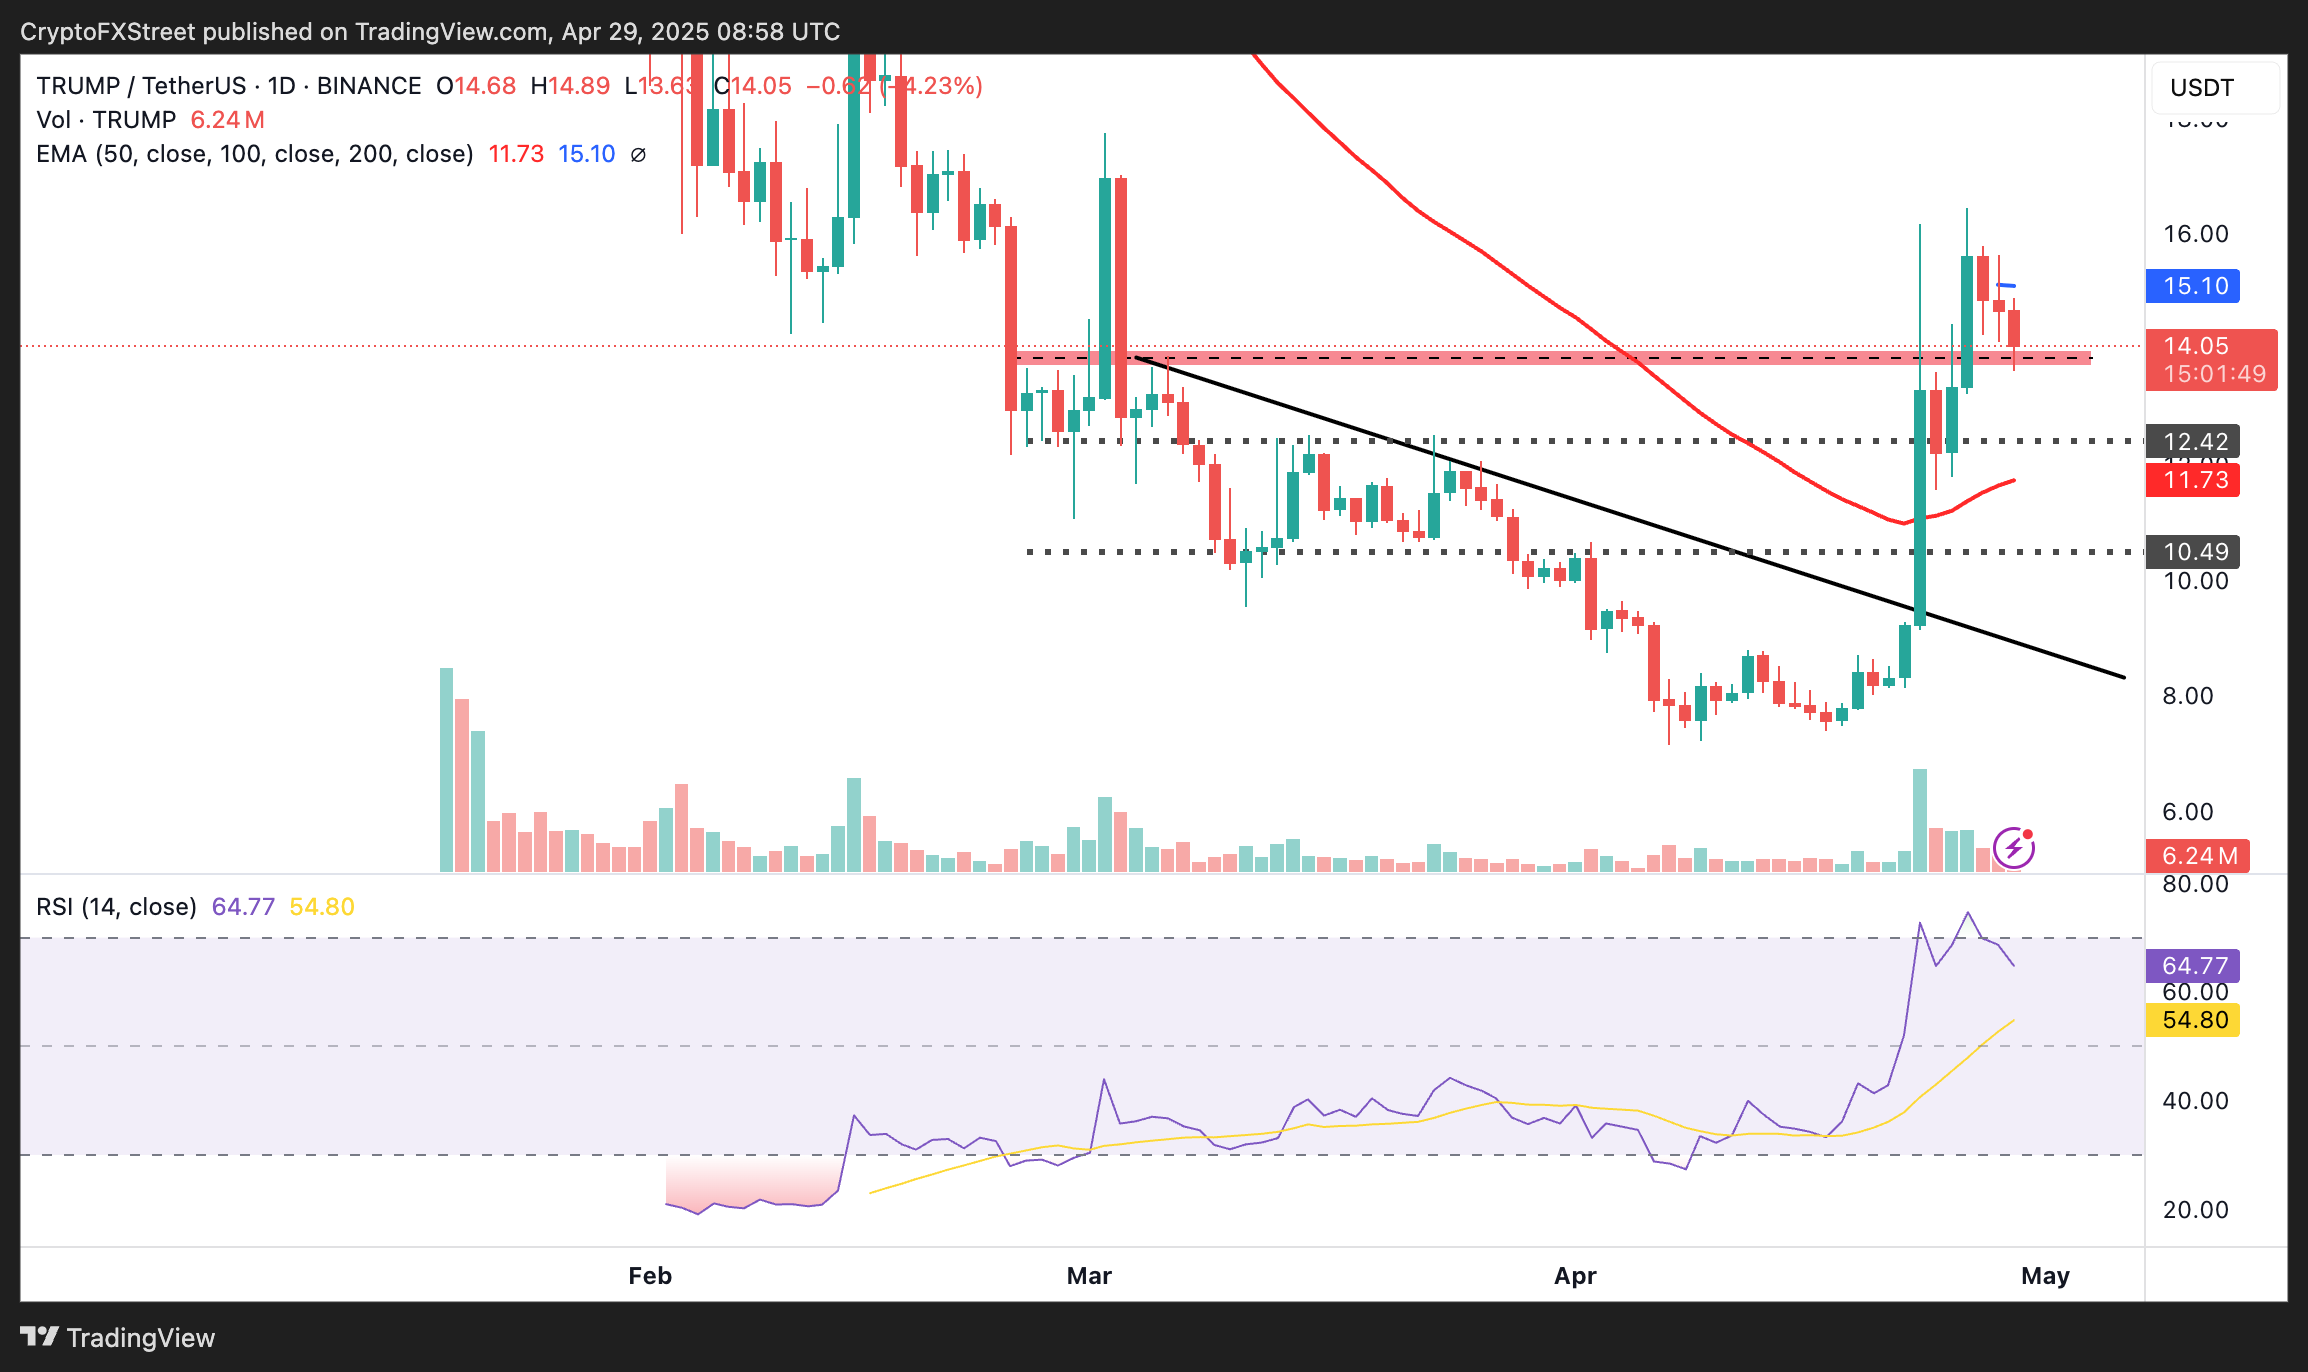
TRUMP/USDT daily chart
However, the meme coin remains above the 50-day EMA at $11.73, which is pointing upwards and suggesting that a reversal could be in the offing. Higher support, preferably around $14.00, would allow bulls to regroup and collect more liquidity before another breakout attempt.
According to Santiment, profit redistribution into more speculative assets, such as meme coins, has begun. Over the last week, TRUMP has seen a spike in on-chain activity after the announcement of an exclusive dinner for the token’s top 220 holders at the Trump National Golf Club in Washington, D.C., on May 22.
Additionally, the top 25 holders will attend an exclusive VIP reception, with US President Donald Trump likely to be in attendance, followed by a White House tour.
As the dinner approaches, sentiment around the official Trump meme coin could improve significantly, placing it among the tokens to watch as Bitcoin price recovers.
Dogwifhat holds above the 50-day EMA
Dogwifhat, a meme coin in the Solana ecosystem, is gaining traction after recovering over 100% from its all-time low of $0.30 on April 7 to exchange hands at $0.61 at the time of writing.
Additionally, WIF remains above the 50-day EMA at $0.53, signaling a strong bullish structure and broader positive sentiment in the crypto market. Traders could look for a break above the 100-day EMA at $0.78 to validate the uptrend, aiming for $1.00 (psychological resistance) and the 200-day EMA at $1.26.
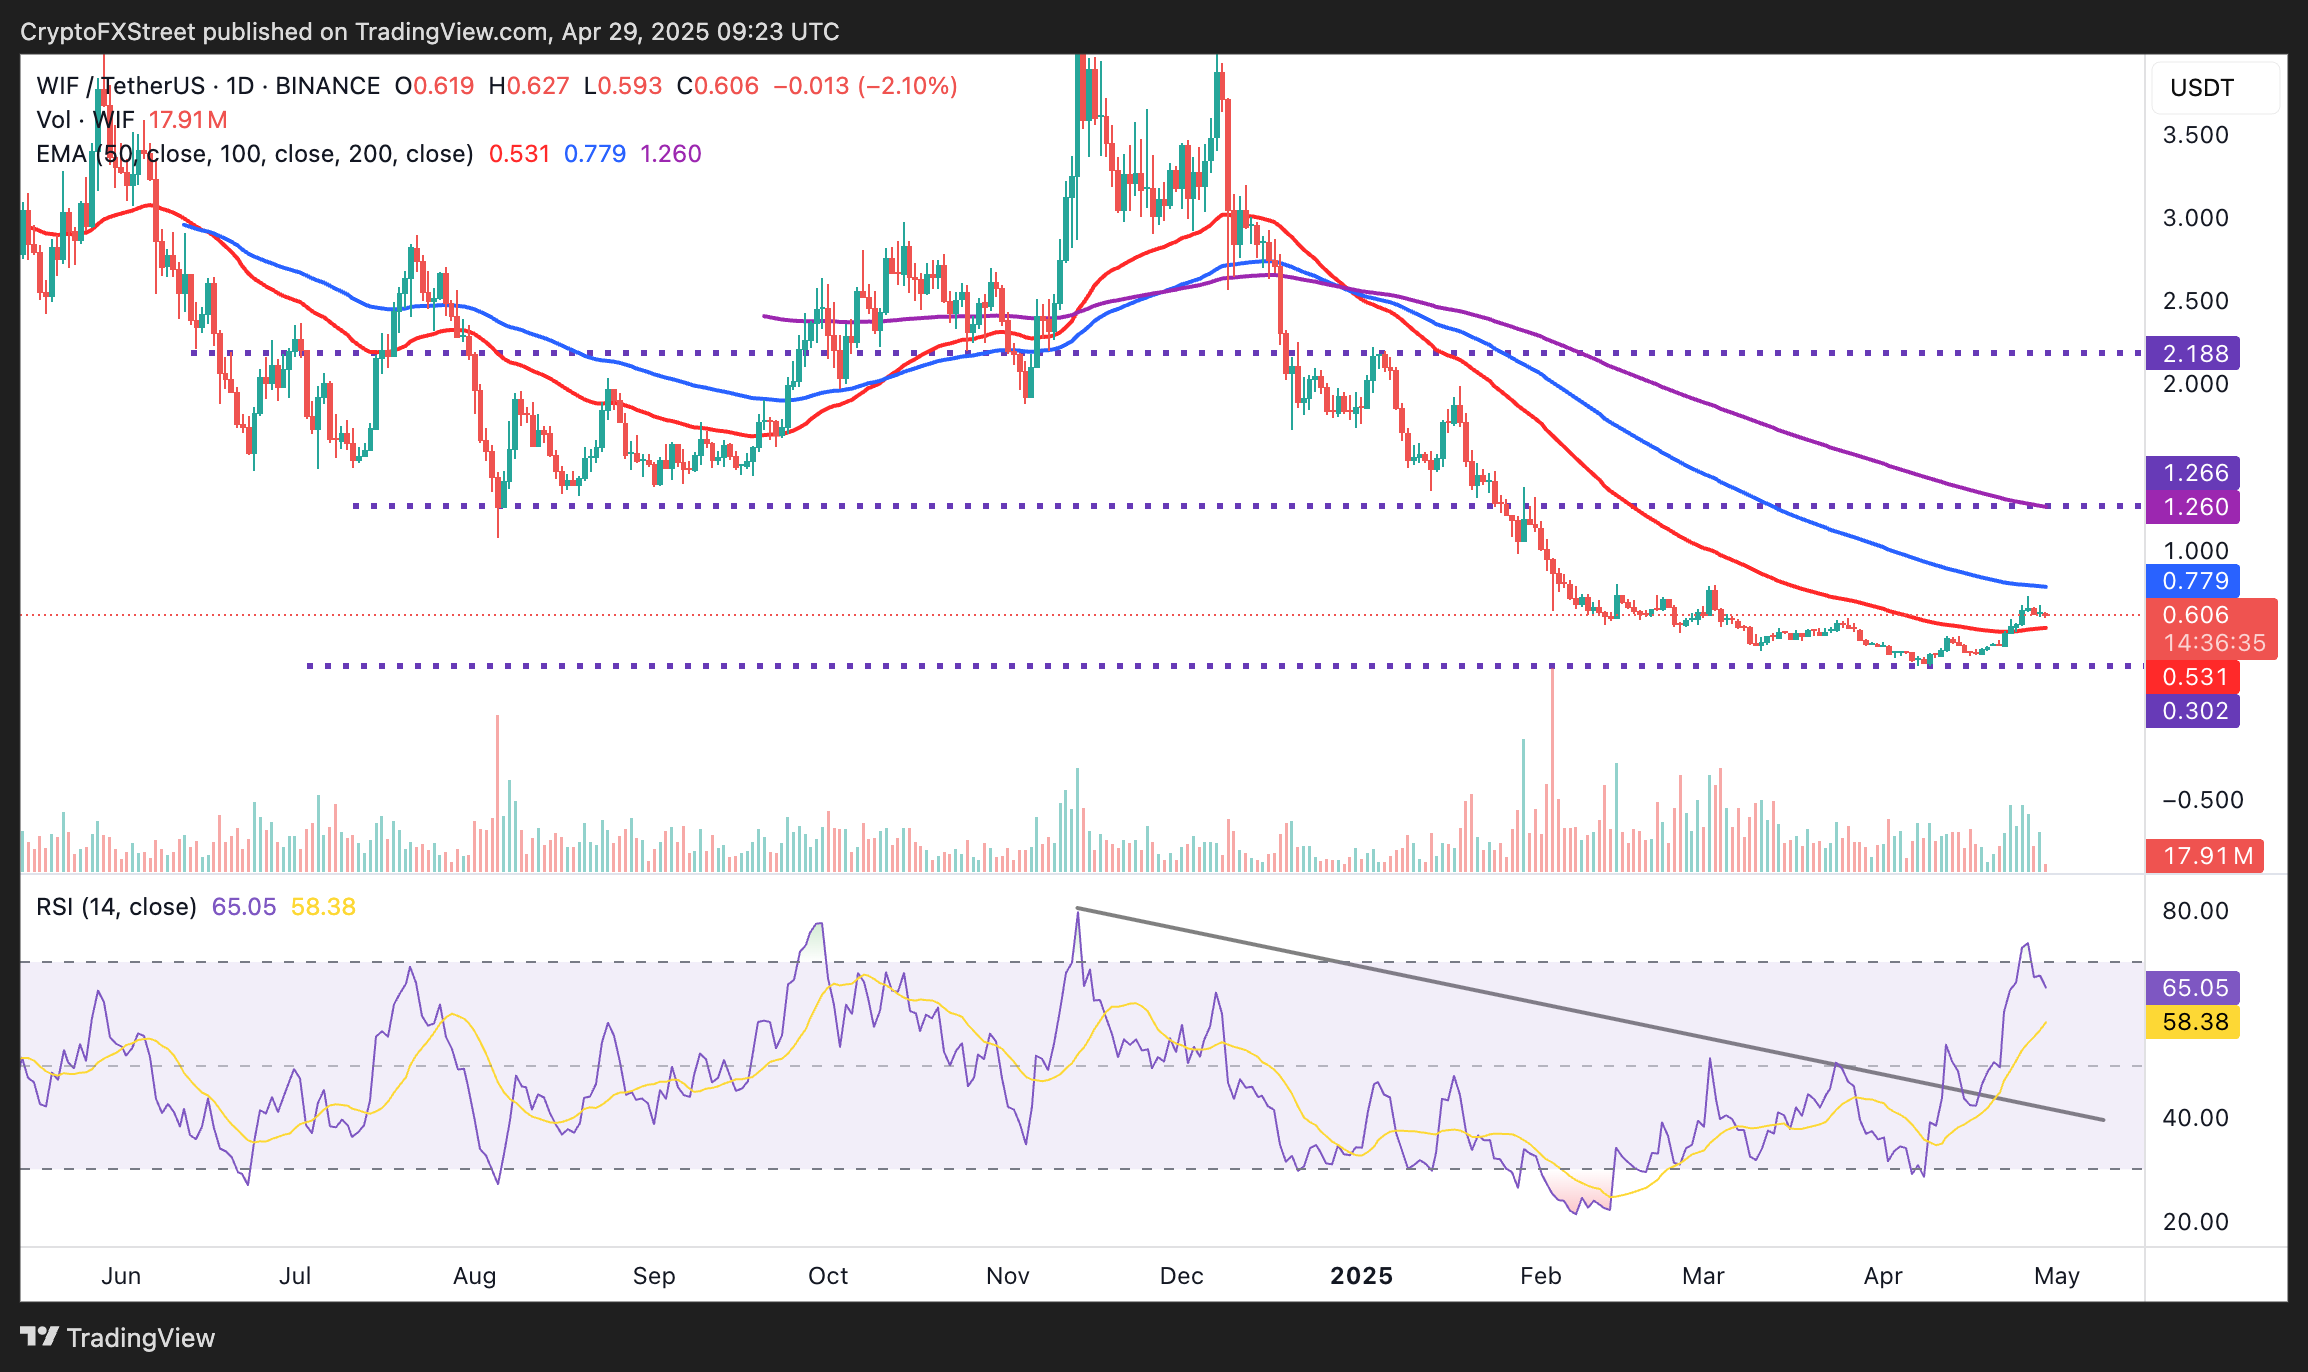
WIF/USDT daily chart
Dogwifhat could soon post its first positive monthly returns, following a negative streak in the first quarter. According to data from CryptoRank, the meme coin’s returns in April stand at 47% compared to -38.7% in January, -45% in February, and -33.1% in March. The potential turnaround in April could enable WIF to achieve overall positive monthly returns in the second quarter of the year.
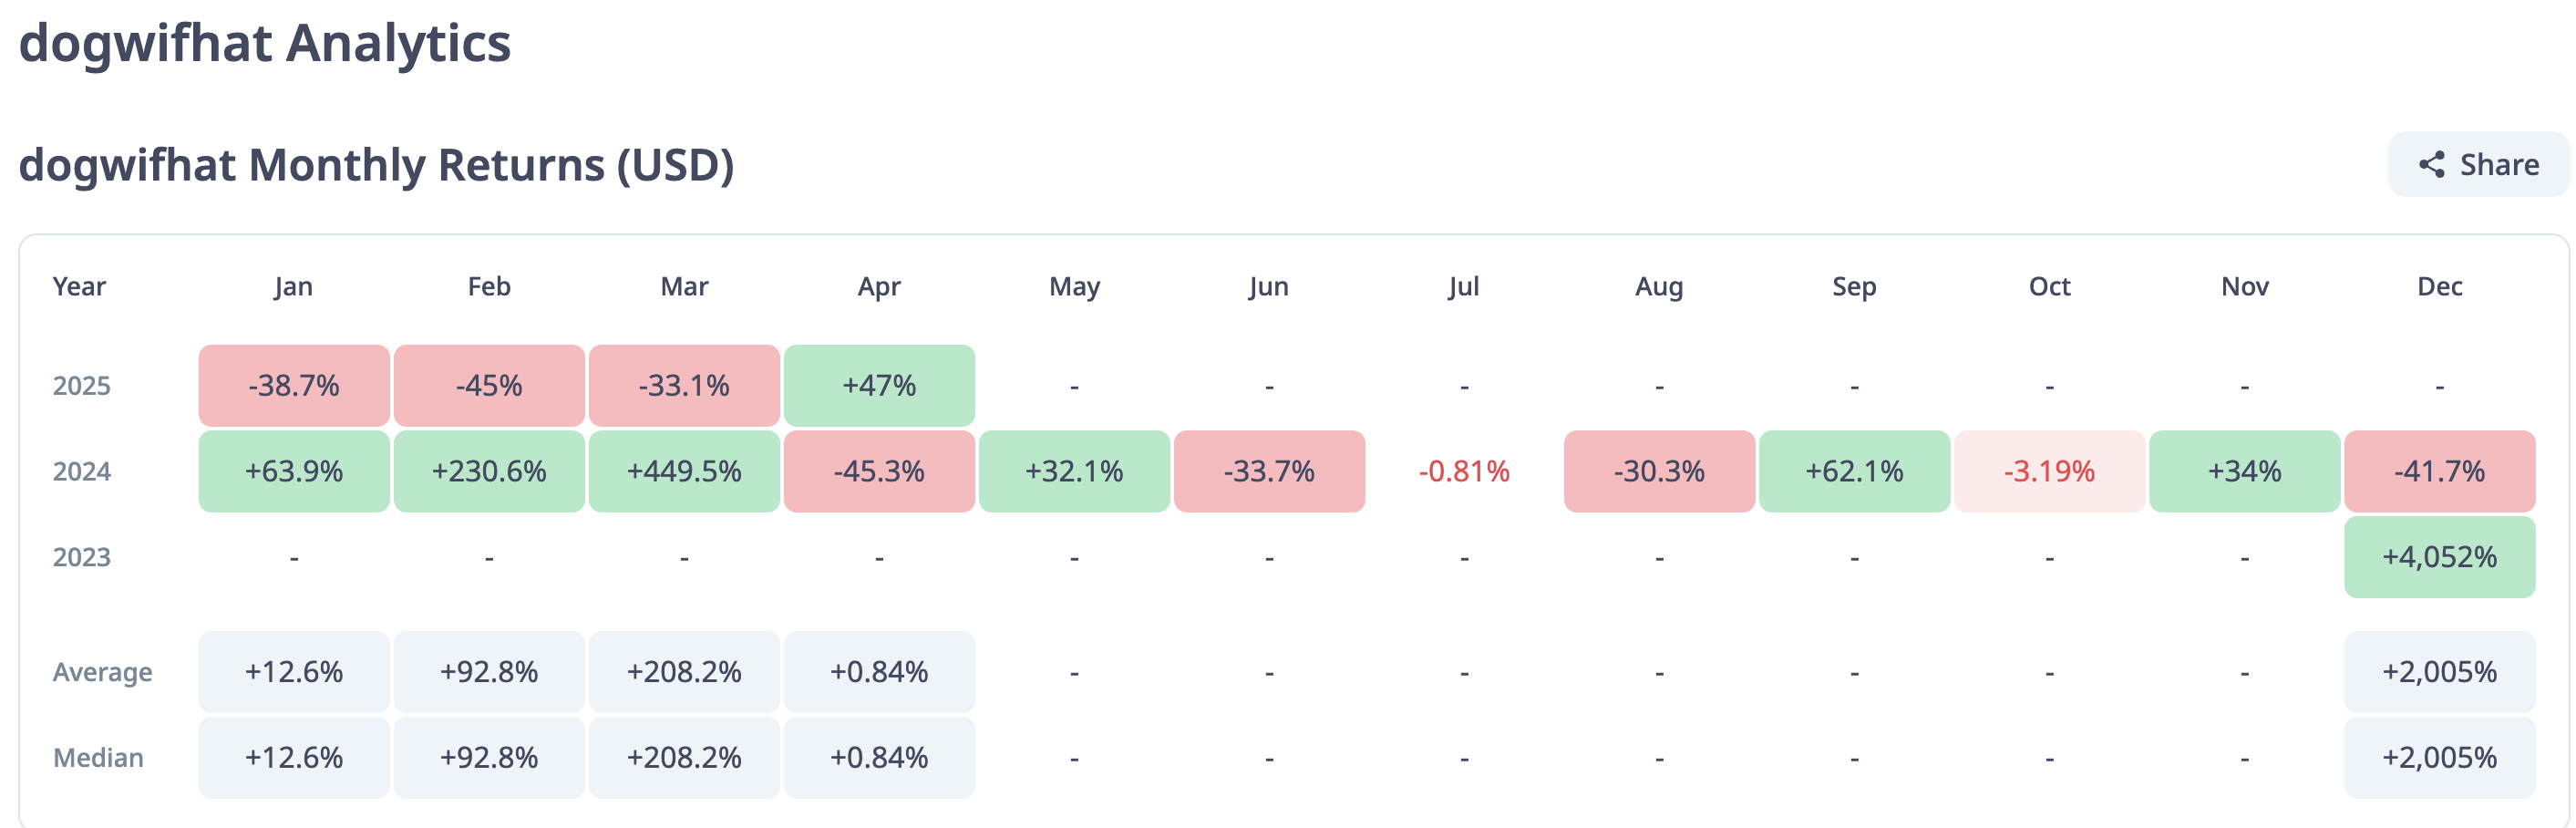
Dogwifhat monthly returns | Source: CryptoRank
However, the RSI indicator at 65.76 and falling toward the midline of 50 highlights possible profit-taking, triggered when the momentum indicator reached overbought conditions of 73.48 on Saturday. If sell-side pressure increases, Dogwifhat could extend the down leg to the 50-day EMA. Beyond this region, the next tentative support areas include $0.40, which was tested in March, and WIF’s all-time low at $0.30.
Cryptocurrency metrics FAQs
The developer or creator of each cryptocurrency decides on the total number of tokens that can be minted or issued. Only a certain number of these assets can be minted by mining, staking or other mechanisms. This is defined by the algorithm of the underlying blockchain technology. On the other hand, circulating supply can also be decreased via actions such as burning tokens, or mistakenly sending assets to addresses of other incompatible blockchains.
Market capitalization is the result of multiplying the circulating supply of a certain asset by the asset’s current market value.
Trading volume refers to the total number of tokens for a specific asset that has been transacted or exchanged between buyers and sellers within set trading hours, for example, 24 hours. It is used to gauge market sentiment, this metric combines all volumes on centralized exchanges and decentralized exchanges. Increasing trading volume often denotes the demand for a certain asset as more people are buying and selling the cryptocurrency.
Funding rates are a concept designed to encourage traders to take positions and ensure perpetual contract prices match spot markets. It defines a mechanism by exchanges to ensure that future prices and index prices periodic payments regularly converge. When the funding rate is positive, the price of the perpetual contract is higher than the mark price. This means traders who are bullish and have opened long positions pay traders who are in short positions. On the other hand, a negative funding rate means perpetual prices are below the mark price, and hence traders with short positions pay traders who have opened long positions.
, such as meme coins, has begun
추천 기사


