
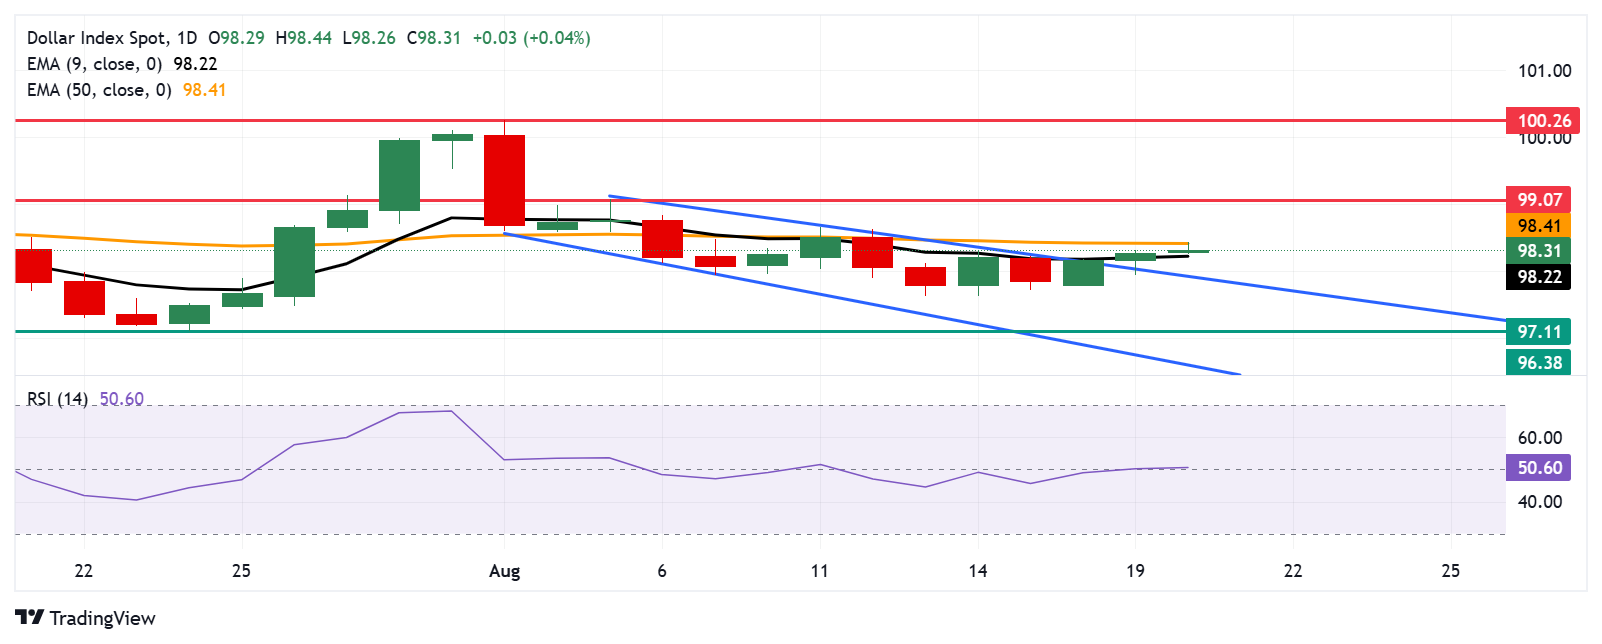
US Dollar Index price forecast: Tests 50-day EMA resistance near 98.50
- The US Dollar Index is testing an immediate barrier at the 50-day EMA of 98.41.
- Market bias is neutral as the 14-day Relative Strength Index is positioned at the 50 mark.
- The nine-day EMA of 98.22 is acting as the initial support.
The US Dollar Index (DXY), which measures the value of the US Dollar (USD) against six major currencies, is extending gains for the third successive session and trading around 98.30 during the European hours on Wednesday. The technical analysis of the daily chart shows the dollar index remains slightly above the descending channel pattern, suggesting a potential for a bullish bias.
The 14-day Relative Strength Index (RSI) is positioned on the 50 level, suggesting that market sentiment is neutral. Further movements will offer a clear directional trend. However, the short-term price momentum has turned stronger as the DXY moved above the nine-day Exponential Moving Average (EMA).
On the upside, the US Dollar Index is testing the 50-day EMA at 98.41, followed by the crucial level of 98.50. A successful breach above the latter could improve the medium-term price momentum and lead the dollar index to test the three-week high of 99.07, which was recorded on August 5. Further advances would find the resistance zone around the three-month high at 100.26, which was recorded on August 1.
The immediate support appears at the nine-day EMA of 98.22. A break below this level would weaken the short-term price momentum and put downward pressure on the US Dollar Index to fall back within the ascending channel. Further declines would prompt the DXY to test the six-week low of 97.11, which was recorded on July 24, followed by the descending channel’s lower boundary around 96.70.
US Dollar Index: Daily Chart
US Dollar PRICE Today
The table below shows the percentage change of US Dollar (USD) against listed major currencies today. US Dollar was the strongest against the New Zealand Dollar.
| USD | EUR | GBP | JPY | CAD | AUD | NZD | CHF | |
|---|---|---|---|---|---|---|---|---|
| USD | 0.06% | -0.08% | 0.06% | 0.07% | 0.34% | 1.25% | 0.02% | |
| EUR | -0.06% | -0.15% | -0.14% | 0.01% | 0.30% | 1.11% | -0.06% | |
| GBP | 0.08% | 0.15% | 0.04% | 0.16% | 0.38% | 1.17% | 0.10% | |
| JPY | -0.06% | 0.14% | -0.04% | 0.13% | 0.38% | 1.27% | 0.19% | |
| CAD | -0.07% | -0.01% | -0.16% | -0.13% | 0.29% | 1.18% | -0.06% | |
| AUD | -0.34% | -0.30% | -0.38% | -0.38% | -0.29% | 0.79% | -0.28% | |
| NZD | -1.25% | -1.11% | -1.17% | -1.27% | -1.18% | -0.79% | -1.15% | |
| CHF | -0.02% | 0.06% | -0.10% | -0.19% | 0.06% | 0.28% | 1.15% |
The heat map shows percentage changes of major currencies against each other. The base currency is picked from the left column, while the quote currency is picked from the top row. For example, if you pick the US Dollar from the left column and move along the horizontal line to the Japanese Yen, the percentage change displayed in the box will represent USD (base)/JPY (quote).
추천 기사


