
US Dollar looks set for steady weekly close ahead of Consumer Sentiment data
- The US Dollar declines slightly on Friday for a second consecutive day after data showed inflation pressures and consumer spending are cooling..
- Traders look ahead to the preliminary May reading for the University of Michigan Consumer Sentiment reading.
- The US Dollar Index trades below 101.00, trying to find a floor.
The US Dollar Index (DXY), which tracks the performance of the US Dollar (USD) against six major currencies, is on the back foot on Friday at around 100.62. The DXY is flirting with overturning its positive weekly performance into a negative one as market participants are starting to raise questions over the stability of the Greenback. With United States (US) President Donald Trump flip-flopping on its tariff approach and how ill-conceived the first trade deals are, traders are starting to challenge the viability of the grand scheme from the Trump administration and its meaning towards the Greenback.
The US Dollar retreated on Thursday after a slew of economic data pointed that price pressures and consumer spending are cooling. The Producer Price Index (PPI) data unexpectedly showed prices fell in April compared with the previous month, while Retail Sales grew by a marginal 0.1% after March’s 1.5% surge.
On the geopolitical front, talks in Turkey about the Russia-Ukraine war failed to produce any significant outcome. Ukrainian President Volodymyr Zelenskyy met with Turkish President Recep Tayyip Erdoğan in Ankara, but soon left as Russian President Vladimir Putin did not come to the talks. US President Trump said a deal between the two nations will not be possible if Trump does not meet with Putin himself. Meanwhile, demand for more and harsher sanctions on Russia is starting to build, in order to force Russian President Putin to come to the negotiating table.
Daily digest market movers: Lighter data ahead of Michigan reading
- The US economic calendar kicks off at 12:30 GMT with a string of data:
- April’s monthly Building Permits are expected to fall to 1.45 million from 1.467 million in March.
- April’s Import-Export Price Indexes are due as well. Export prices are expected to drop by 0.5% from 0% previously. Import prices are expected to fall by 0.4%, accelerating the 0.1% decline seen a month earlier.
- At 14:00 GMT, the University of Michigan publishes its preliminary report for May:
- The Consumer Sentiment Index is seen edging up slightly to 53.4 from 52.2 in April's final reading.
- The 5-year inflation expectation is expected to remain stable at 4.4%.
- On equity markets, European indices soar on Friday, up just shy of 1%. US futures are lagging a touch but are also in the green, up by less than 0.50%.
- The CME FedWatch tool shows the chance of an interest rate cut by the Federal Reserve in June’s meeting at just 8.2%. Further ahead, the July 30 decision sees odds for rates being lower than current levels at 38.6%.
- The US 10-year yields trade around 4.41%, softening from its peak performance on early Thursday at 4.54%
US Dollar Index Technical Analysis: Barriers defined
The US Dollar Index could be on the verge of a crisis as an increasing number of financial market participants start to question the stability status of the Greenback, given the unstable policies of the Trump administration. The “Trump put” is becoming an actual theme, and in this scenario it isn’t likely that the US Dollar revisits levels such as 107.00 or 110.00 for a long time. Add in the fear of a joint Asian currency intervention, where local currencies are appreciated against the Greenback, and US exceptionalism might be over for an extended period of time.
On the upside, 101.90 is the first big resistance again. It already acted as a pivotal level throughout December 2023 and as a base for the inverted head-and-shoulders (H&S) formation during the summer of 2024. In case Dollar bulls push the DXY even higher, the 55-day Simple Moving Average (SMA) at 102.06 comes into play.
On the other hand, the previous resistance at 100.22 is now acting as firm support, followed by the year-to-date low of 97.91 and the pivotal level of 97.73. Further below, a relatively thin technical support comes in at 96.94 before looking at the lower levels of this new price range. These would be at 95.25 and 94.56, meaning fresh lows not seen since 2022.
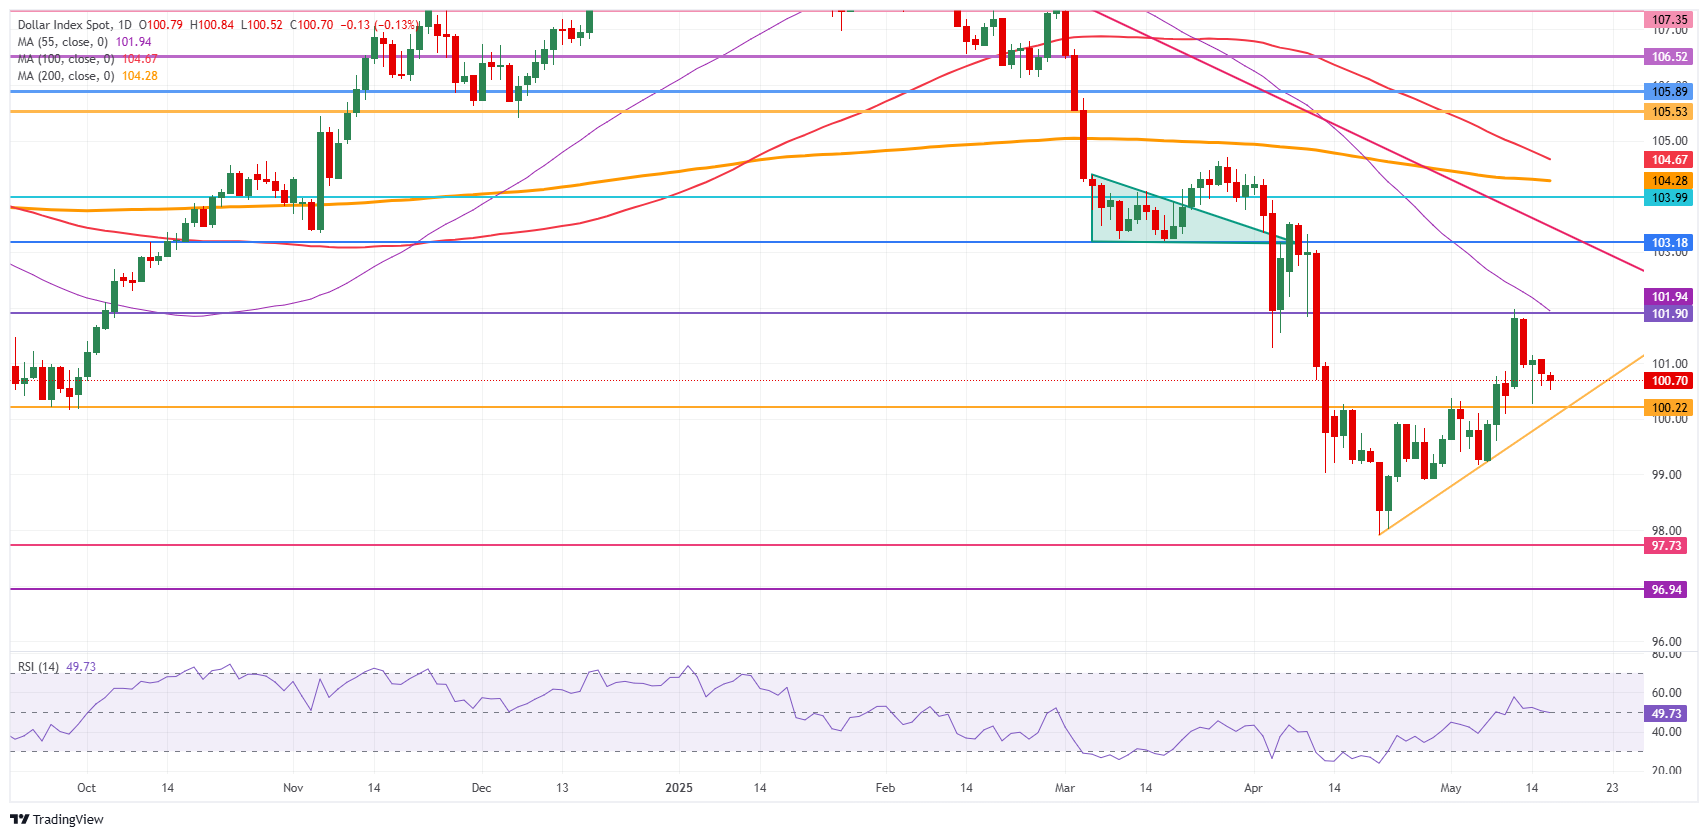
US Dollar Index: Daily Chart
US-China Trade War FAQs
Generally speaking, a trade war is an economic conflict between two or more countries due to extreme protectionism on one end. It implies the creation of trade barriers, such as tariffs, which result in counter-barriers, escalating import costs, and hence the cost of living.
An economic conflict between the United States (US) and China began early in 2018, when President Donald Trump set trade barriers on China, claiming unfair commercial practices and intellectual property theft from the Asian giant. China took retaliatory action, imposing tariffs on multiple US goods, such as automobiles and soybeans. Tensions escalated until the two countries signed the US-China Phase One trade deal in January 2020. The agreement required structural reforms and other changes to China’s economic and trade regime and pretended to restore stability and trust between the two nations. However, the Coronavirus pandemic took the focus out of the conflict. Yet, it is worth mentioning that President Joe Biden, who took office after Trump, kept tariffs in place and even added some additional levies.
The return of Donald Trump to the White House as the 47th US President has sparked a fresh wave of tensions between the two countries. During the 2024 election campaign, Trump pledged to impose 60% tariffs on China once he returned to office, which he did on January 20, 2025. With Trump back, the US-China trade war is meant to resume where it was left, with tit-for-tat policies affecting the global economic landscape amid disruptions in global supply chains, resulting in a reduction in spending, particularly investment, and directly feeding into the Consumer Price Index inflation.
추천 기사


