


Dow Jones soars toward 40,000 on Fed rate cut bets, China’s optimism
- DJIA gains 0.62% as traders price in June Fed rate cut chances.
- Trump’s softened tone on China trade spurs risk-on rally near 40,000.
- Gold climbs above $3,300 as yields slump despite stronger US data.
The Dow Jones Industrial Average (DJIA) registered gains of over 0.62% as investors became optimistic that the Federal Reserve (Fed) could cut interest rates at its June meeting amid growing concerns of a recession in the United States (US). This, along with an improvement in risk appetite due to the US willingness to strike a deal with China, drove the DJIA near the 40,000 mark after bouncing off daily lows of 39,200.
Fed pivot hopes and hints of US-China trade thaw lift Wall Street, though resistance looms near record highs
On Wednesday, US President Donald Trump adopted a moderate stance on China toward trade talks in Beijing and even talked about reducing levies on its products, a sign of openness towards reaching a deal. Nevertheless, US Treasury Secretary Scott Bessent said, “No unilateral offer from Trump to cut China tariffs.”
During the overnight session for North American traders, Chinese Ministry of Commerce spokesperson He Yadong said there were no trade talks with the US and called for the cancellation of “unilateral” tariffs.
US economic data lifted the market mood as the jobs market witnessed a report aligned with forecasts, while Durable Goods Orders jumped sharply in March, sponsored by airplane orders.
An improvement in market mood failed to weigh on Gold prices, with the precious metal back above $3,300, up 1%, underpinned by failing US Treasury yields as the 10-year T-note coupon plunges seven and a half basis points to 4.309%.
Dow Jones price forecast
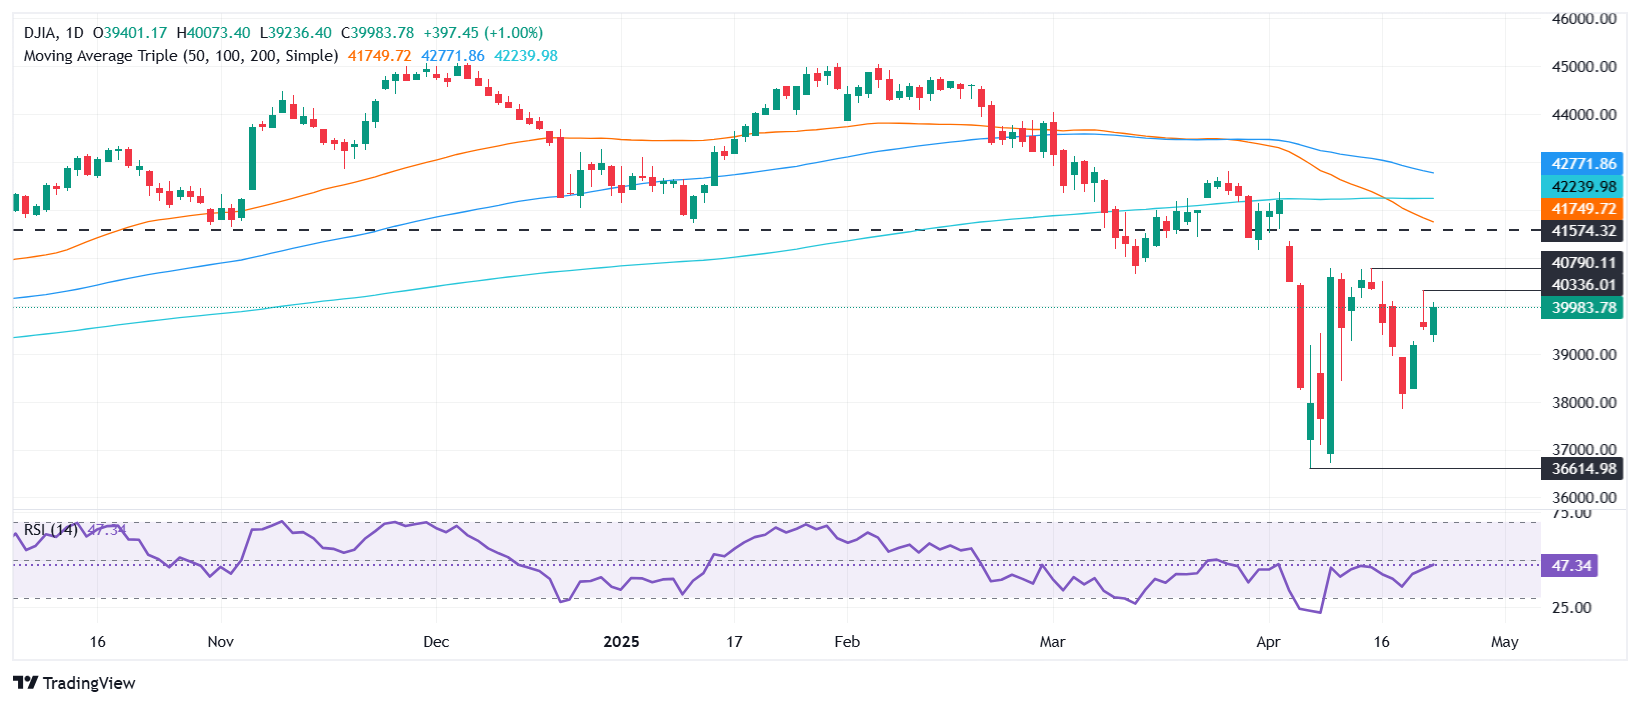
Dow’s downtrend remains in place, but buyers are gathering some steam. Recently, US President Donald Trump said they held talks with China in mourning, sparking a jump in the DJIA, which hit a daily high at 40,002.
If buyers push the Dow past 40,500, this could pave the way to challenging last week’s peak at 40,790. Key resistance lies ahead at 41,000. Conversely, if sellers drive the index below April 23’s low of 39,486, look for a test of April 22’s high of 39,271 to close the gap up witnessed between April 22 and 23.
Dow Jones FAQs
The Dow Jones Industrial Average, one of the oldest stock market indices in the world, is compiled of the 30 most traded stocks in the US. The index is price-weighted rather than weighted by capitalization. It is calculated by summing the prices of the constituent stocks and dividing them by a factor, currently 0.152. The index was founded by Charles Dow, who also founded the Wall Street Journal. In later years it has been criticized for not being broadly representative enough because it only tracks 30 conglomerates, unlike broader indices such as the S&P 500.
Many different factors drive the Dow Jones Industrial Average (DJIA). The aggregate performance of the component companies revealed in quarterly company earnings reports is the main one. US and global macroeconomic data also contributes as it impacts on investor sentiment. The level of interest rates, set by the Federal Reserve (Fed), also influences the DJIA as it affects the cost of credit, on which many corporations are heavily reliant. Therefore, inflation can be a major driver as well as other metrics which impact the Fed decisions.
Dow Theory is a method for identifying the primary trend of the stock market developed by Charles Dow. A key step is to compare the direction of the Dow Jones Industrial Average (DJIA) and the Dow Jones Transportation Average (DJTA) and only follow trends where both are moving in the same direction. Volume is a confirmatory criteria. The theory uses elements of peak and trough analysis. Dow’s theory posits three trend phases: accumulation, when smart money starts buying or selling; public participation, when the wider public joins in; and distribution, when the smart money exits.
There are a number of ways to trade the DJIA. One is to use ETFs which allow investors to trade the DJIA as a single security, rather than having to buy shares in all 30 constituent companies. A leading example is the SPDR Dow Jones Industrial Average ETF (DIA). DJIA futures contracts enable traders to speculate on the future value of the index and Options provide the right, but not the obligation, to buy or sell the index at a predetermined price in the future. Mutual funds enable investors to buy a share of a diversified portfolio of DJIA stocks thus providing exposure to the overall index.
추천 기사


