
Dow Jones tanks over 1,000 points as Trump targets Fed Chair Powell
- Trump intensifies attacks on Fed Chair Powell, calling him “a major loser” for being slow on rate cuts.
- Tech-led selloff drags Nasdaq down 3.44%, with Tesla and Nvidia plunging 7% and 6% respectively.
- DXY dives to 97.92 as Fed independence fears and trade policy turbulence spark investor flight from US assets.
The Dow Jones Industrial Average (DJIA) collapsed over 1,000 points, or 3%, below the 38,000 figure for the fourth time in April. Investors were growing concerned about the Federal Reserve’s (Fed) independence after US President Donald Trump continued his attacks on Fed Chair Jerome Powell on Monday.
DJIA plunges 3% below 38,000 as tech rout deepens and DXY hits 3-year low; market braces for policy chaos
President Donald Trump continued his rhetoric on Federal Reserve Chair Jerome Powell, referring to him as a “major loser " who always comes too late to cut interest rates. Meanwhile, Powell has remained poised, saying the Fed would stay data-dependent and even flagging the chance of a stagflationary scenario, acknowledging, “We may find ourselves in the challenging scenario in which our dual-mandate goals are in tension.”
In addition to the Dow's loss, the S&P 500 and the Nasdaq are falling, each by 3.16% and 3.44%. The mega-cap companies led by the seven largest tech companies extended their losses, led by Tesla (TSLA) and Nvidia (NVDA), each down by 7% and 6%.
The sour sentiment has also affected the Greenback, as investors’ distrust of US policymakers grows. The US Dollar Index (DXY) tracks the buck's performance against a basket of six currencies, dropping more than 1% to 98.27 after hitting a three-year low of 97.92.
Trump trade policies continued to weigh on markets due to worries about a global economic slowdown ahead.
Meanwhile, recent data suggested that traders are pricing in 96 basis points of Fed rate cuts toward the end of 2025.
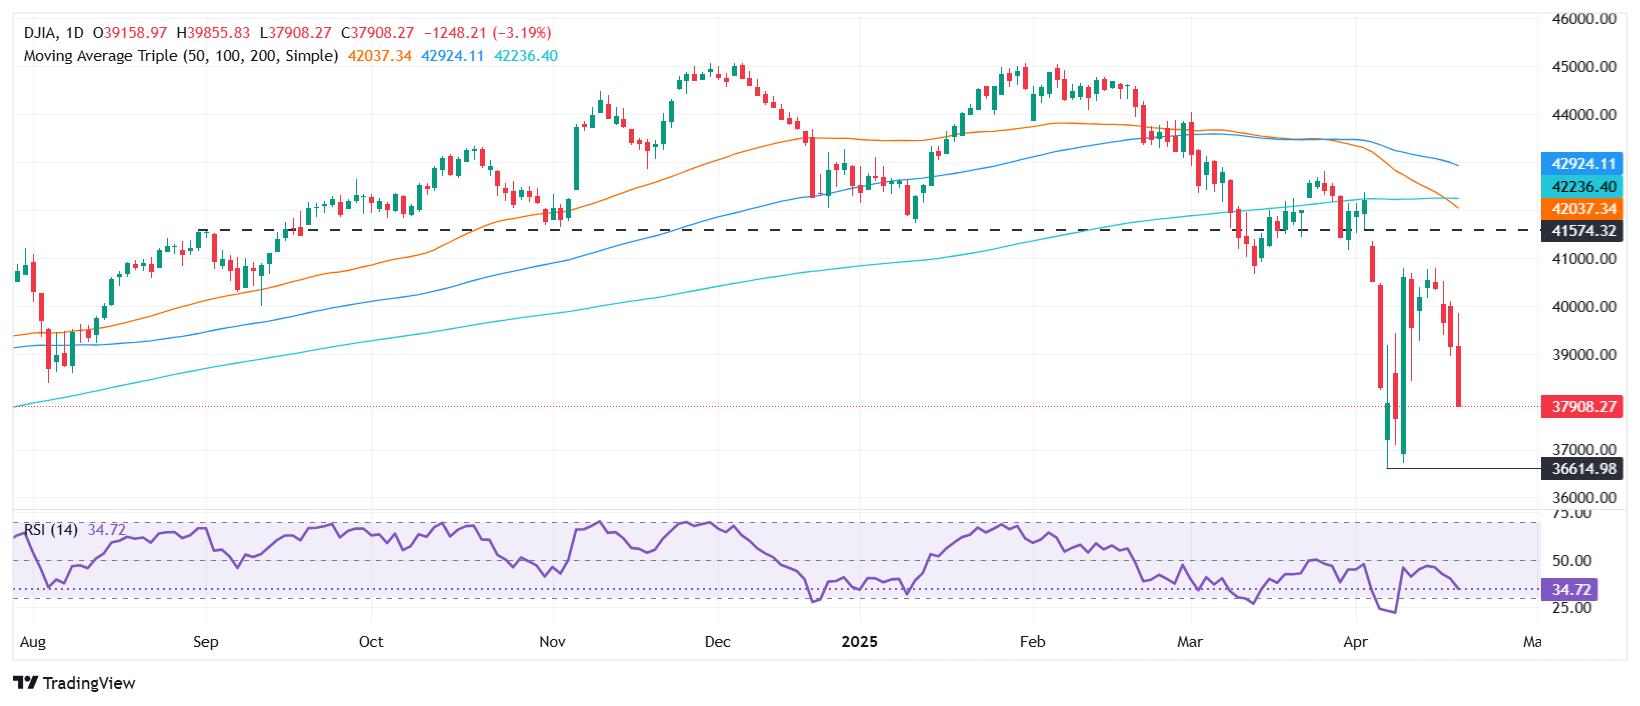
Dow Jones price forecast
The Dow Jones extended its losses for four straight days, cementing the bearish bias as sellers target the year-to-date (YTD) low of 36,614 hit on April 7. However, sellers need to close daily below 38,000 to remain hopeful of dragging the DJIA lower.
On the other hand, bulls need to push the Dow above 38,000 to test the April 10 daily low support, which turned resistance at 38,431, before reaching 39,000.
Dow Jones FAQs
The Dow Jones Industrial Average, one of the oldest stock market indices in the world, is compiled of the 30 most traded stocks in the US. The index is price-weighted rather than weighted by capitalization. It is calculated by summing the prices of the constituent stocks and dividing them by a factor, currently 0.152. The index was founded by Charles Dow, who also founded the Wall Street Journal. In later years it has been criticized for not being broadly representative enough because it only tracks 30 conglomerates, unlike broader indices such as the S&P 500.
Many different factors drive the Dow Jones Industrial Average (DJIA). The aggregate performance of the component companies revealed in quarterly company earnings reports is the main one. US and global macroeconomic data also contributes as it impacts on investor sentiment. The level of interest rates, set by the Federal Reserve (Fed), also influences the DJIA as it affects the cost of credit, on which many corporations are heavily reliant. Therefore, inflation can be a major driver as well as other metrics which impact the Fed decisions.
Dow Theory is a method for identifying the primary trend of the stock market developed by Charles Dow. A key step is to compare the direction of the Dow Jones Industrial Average (DJIA) and the Dow Jones Transportation Average (DJTA) and only follow trends where both are moving in the same direction. Volume is a confirmatory criteria. The theory uses elements of peak and trough analysis. Dow’s theory posits three trend phases: accumulation, when smart money starts buying or selling; public participation, when the wider public joins in; and distribution, when the smart money exits.
There are a number of ways to trade the DJIA. One is to use ETFs which allow investors to trade the DJIA as a single security, rather than having to buy shares in all 30 constituent companies. A leading example is the SPDR Dow Jones Industrial Average ETF (DIA). DJIA futures contracts enable traders to speculate on the future value of the index and Options provide the right, but not the obligation, to buy or sell the index at a predetermined price in the future. Mutual funds enable investors to buy a share of a diversified portfolio of DJIA stocks thus providing exposure to the overall index.
추천 기사


