


Dow Jones Industrial Average roils on renewed tariff threats
- The Dow Jones is heavily battered on Monday as trade war continues to weigh.
- President Trump ramped up trade war threats, promises more tariffs on China.
- Equity recovery on possible tariff extensions evaporated early.
The Dow Jones Industrial Average (DJIA) whipsawed sharply on Monday, kicking off the new trading week with a tumultuous opening volley. The Dow Jones opened the week over a thousand points below Friday’s close, and continuing to decline below the 37,000 level for the first time since December of 2023 as the tariff rout continues.
It’s no use, Mr. Xi - it’s tariffs all the way down
Investor sentiment rapidly surged on rumors that the Trump administration was considering a 90-day tariff extension, sending equities higher and pinning the DJIA into the 39,000 level. United States (US) President Donald Trump quickly took to social media to declare that not only were the rumors false, but that Donald Trump intends to issue an additional 50% tariff to take effect on April 8 aimed at China. The fresh tariff threats is in response to a retaliatory 34% tariff on US goods issued by China, which itself was targeted by a 34% “reciprocal” tariff by the US last week, which is also set to take effect on April 9.
Fresh tariff threats sent the Dow Jones tumbling back to 37,500, wiping out Monday’s brief rumor-fueled recovery rally. US equity indexes are down sharply across the board, with the Standard & Poor’s 500 (S&P) megacap index tumbled another 1.3%, falling to 5,000. The tech-heavy Nasdaq Composite also fell 0.9%, shedding 140 points to test below 15,500.
Stock news
Despite a general decline in market sentiment, key tech players are still finding gains on Monday. Super Micro Computer (SMCI) rallied 10% to $33 per share as the server rack solution provider recovers from a leadership shakeup, and AI rally darling Nvidia (NVDA) rose 3% to $97 per share. Physical product merchants took a hit on tariff threats, with Nike (NKE) falling 5% and sliding below $55 per share, while China-reliant tech manufacturer Apple (AAPL) tumbled 4.2% to fall below $181 per share.
Read more stock news: Alibaba slides 10% after Trump threatens to raise China tariff
Dow Jones price forecast
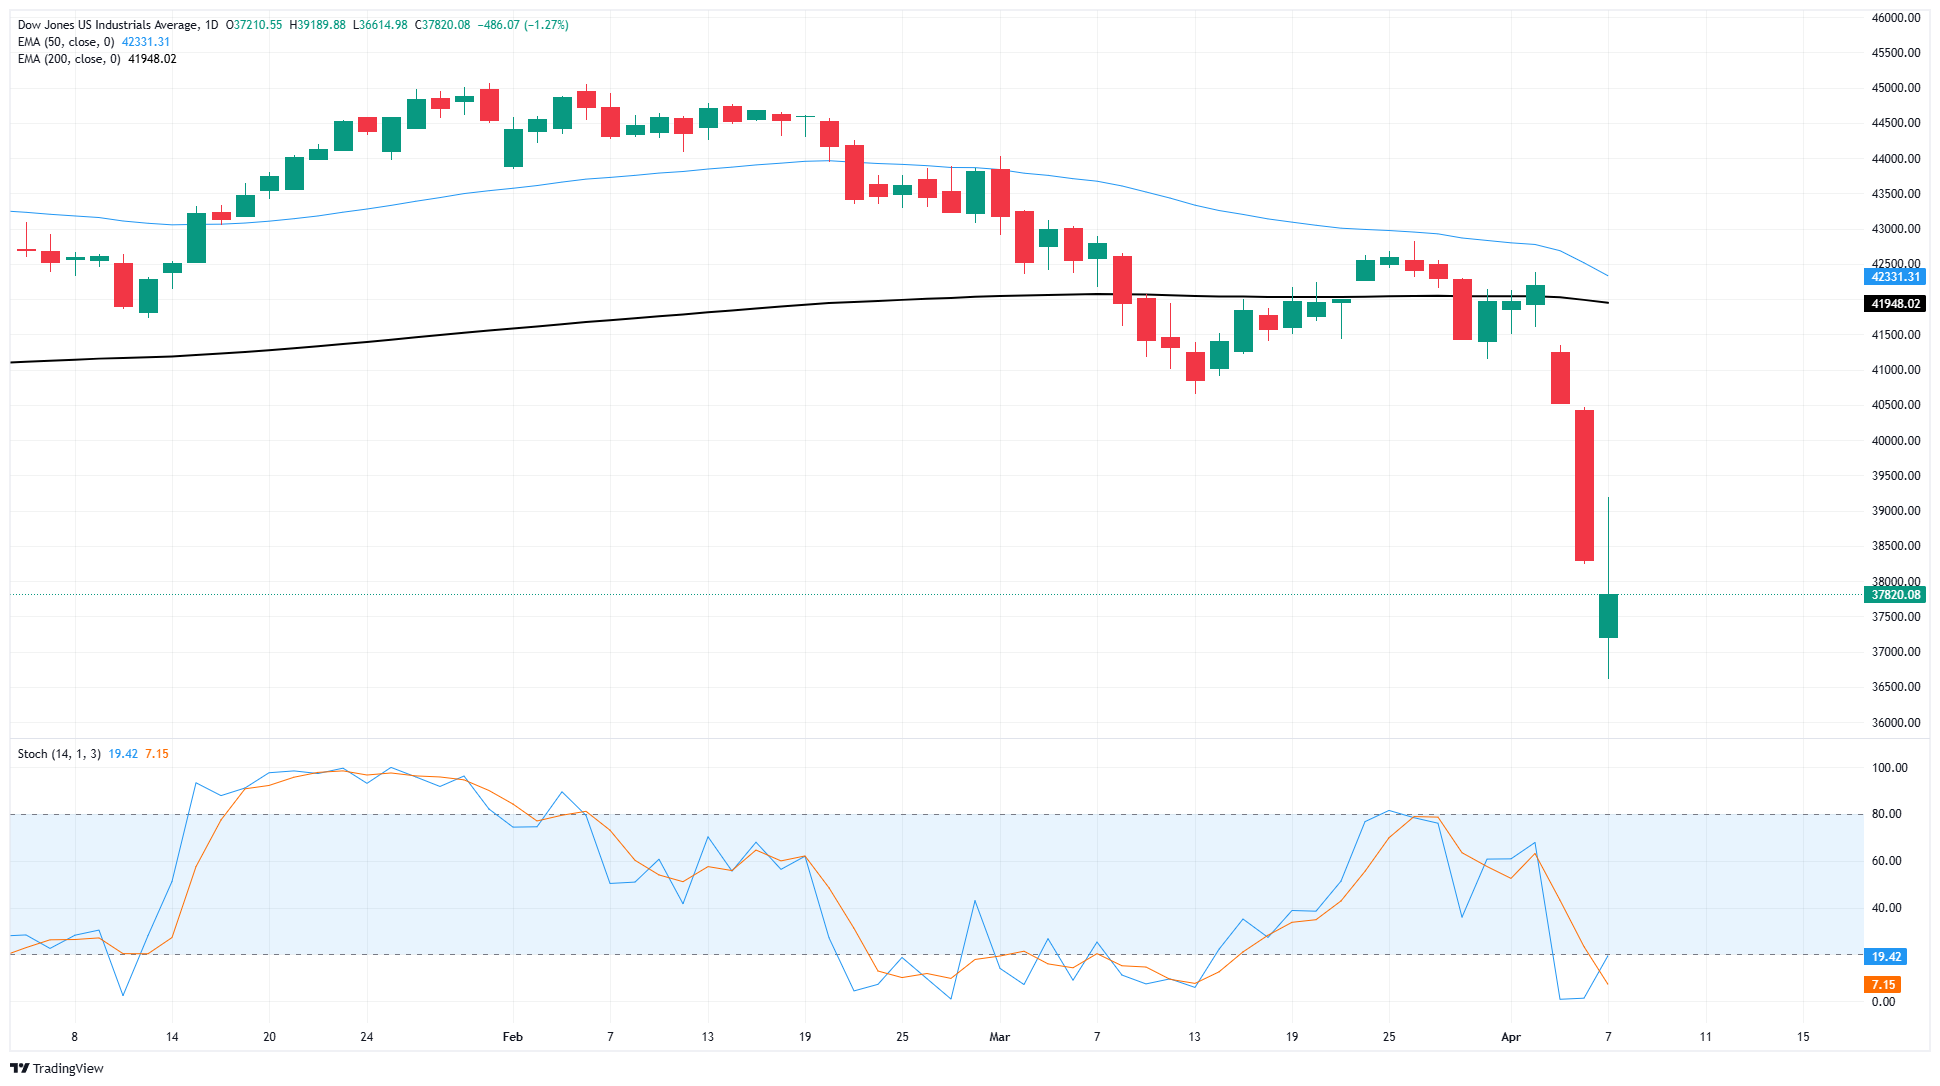
Despite a desperate low-end recovery, the Dow Jones remains buried deep in bear country. Price action is stuck near technical levels not seen since early 2024, trading down around 16% from record highs set last December just north of 45,000.
Monday’s technical bullish rejection from the 37,000 handle could see an increase in near-term recovery bidding. However, the Dow Jones is still well below the 40,000 major price level, and the 200-day Exponential Moving Average (EMA) is stuck near 42,000, marking out plenty of areas for bulls to lose control once again if a recovery continues.
Dow Jones daily chart
Dow Jones FAQs
The Dow Jones Industrial Average, one of the oldest stock market indices in the world, is compiled of the 30 most traded stocks in the US. The index is price-weighted rather than weighted by capitalization. It is calculated by summing the prices of the constituent stocks and dividing them by a factor, currently 0.152. The index was founded by Charles Dow, who also founded the Wall Street Journal. In later years it has been criticized for not being broadly representative enough because it only tracks 30 conglomerates, unlike broader indices such as the S&P 500.
Many different factors drive the Dow Jones Industrial Average (DJIA). The aggregate performance of the component companies revealed in quarterly company earnings reports is the main one. US and global macroeconomic data also contributes as it impacts on investor sentiment. The level of interest rates, set by the Federal Reserve (Fed), also influences the DJIA as it affects the cost of credit, on which many corporations are heavily reliant. Therefore, inflation can be a major driver as well as other metrics which impact the Fed decisions.
Dow Theory is a method for identifying the primary trend of the stock market developed by Charles Dow. A key step is to compare the direction of the Dow Jones Industrial Average (DJIA) and the Dow Jones Transportation Average (DJTA) and only follow trends where both are moving in the same direction. Volume is a confirmatory criteria. The theory uses elements of peak and trough analysis. Dow’s theory posits three trend phases: accumulation, when smart money starts buying or selling; public participation, when the wider public joins in; and distribution, when the smart money exits.
There are a number of ways to trade the DJIA. One is to use ETFs which allow investors to trade the DJIA as a single security, rather than having to buy shares in all 30 constituent companies. A leading example is the SPDR Dow Jones Industrial Average ETF (DIA). DJIA futures contracts enable traders to speculate on the future value of the index and Options provide the right, but not the obligation, to buy or sell the index at a predetermined price in the future. Mutual funds enable investors to buy a share of a diversified portfolio of DJIA stocks thus providing exposure to the overall index.
추천 기사


