


US Dollar marks in fifth straight gain day after NFP numbers surge
- The US Dollar climbed after a bumper NFP print on Friday.
- US jobs additions soared in September, with upside revisions to previous months.
- Market hopes for a follow-up outsized rate cut in November were shattered by jobs growth.
The US Dollar (USD) Index (DXY) climbed into a fifth consecutive bullish day on Friday, driven higher by better-than-expected US Nonfarm Payrolls figures. A firm showing for US jobs gains and an easing in the US Unemployment Rate have hobbled market expectations for a repeat double-cut from the Federal Reserve (Fed) in November.
The US Unemployment Rate dropped back to 4.1% from the previous 4.2%, further reinforcing a healthier-than-expected landscape in the US labor market. In addition, several months’ worth of NFP releases saw healthy upside revisions. August’s previous NFP total was lifted by an additional 17K, while July’s figure rose sharply by 55K, bringing the total up to 144K.
Annual wage growth also firmed up in September, rising 4.0% YoY from the previous 3.9%. Investors had expected September’s Average Hourly Earnings growth to ease back to 3.8%. With wages and net jobs additions blowing well past expectations across the board, rate market expectations of a higher pace of rate cuts have taken a huge hit to round out a middling-at-best trading week.
According to the CME’s FedWatch Tool, rate trader expectations for the Fed’s November rate call plummeted post-NFP; rate futures speculators now see a 95% chance that the Fed will trim rates by a modest 25 bps on November 7, with the last 5% betting on no movement at all on the Fed funds rate.
US Dollar price forecast
The Dollar Index (DXY) has been strong lately, breaking through important levels and going above 102.00. It has tested the 50-day Exponential Moving Average (EMA) at 101.90, which could be a significant barrier.
The recent price movement suggests a possible short-term recovery from the earlier downward trend. The next important resistance is the 200-day EMA at around 103.41. If the index breaks above this level, it could confirm a change in the overall trend.
Since hitting its lowest point in September, the index has been making higher lows, showing a change in market sentiment in favor of the dollar. If this continues, the DXY could aim for the 103.50-104.00 range, where the 200-day EMA is a major hurdle.
If it doesn't break the 50-day EMA, the index may consolidate or go back down to around 101.00, with more support at 100.50.
The Dollar Index seems to be recovering, with the 50-day and 200-day EMAs as important barriers. Breaking above 103.50 could mean a longer period of growth, while failing to do so could result in going back down to around 101.00.
DXY daily chart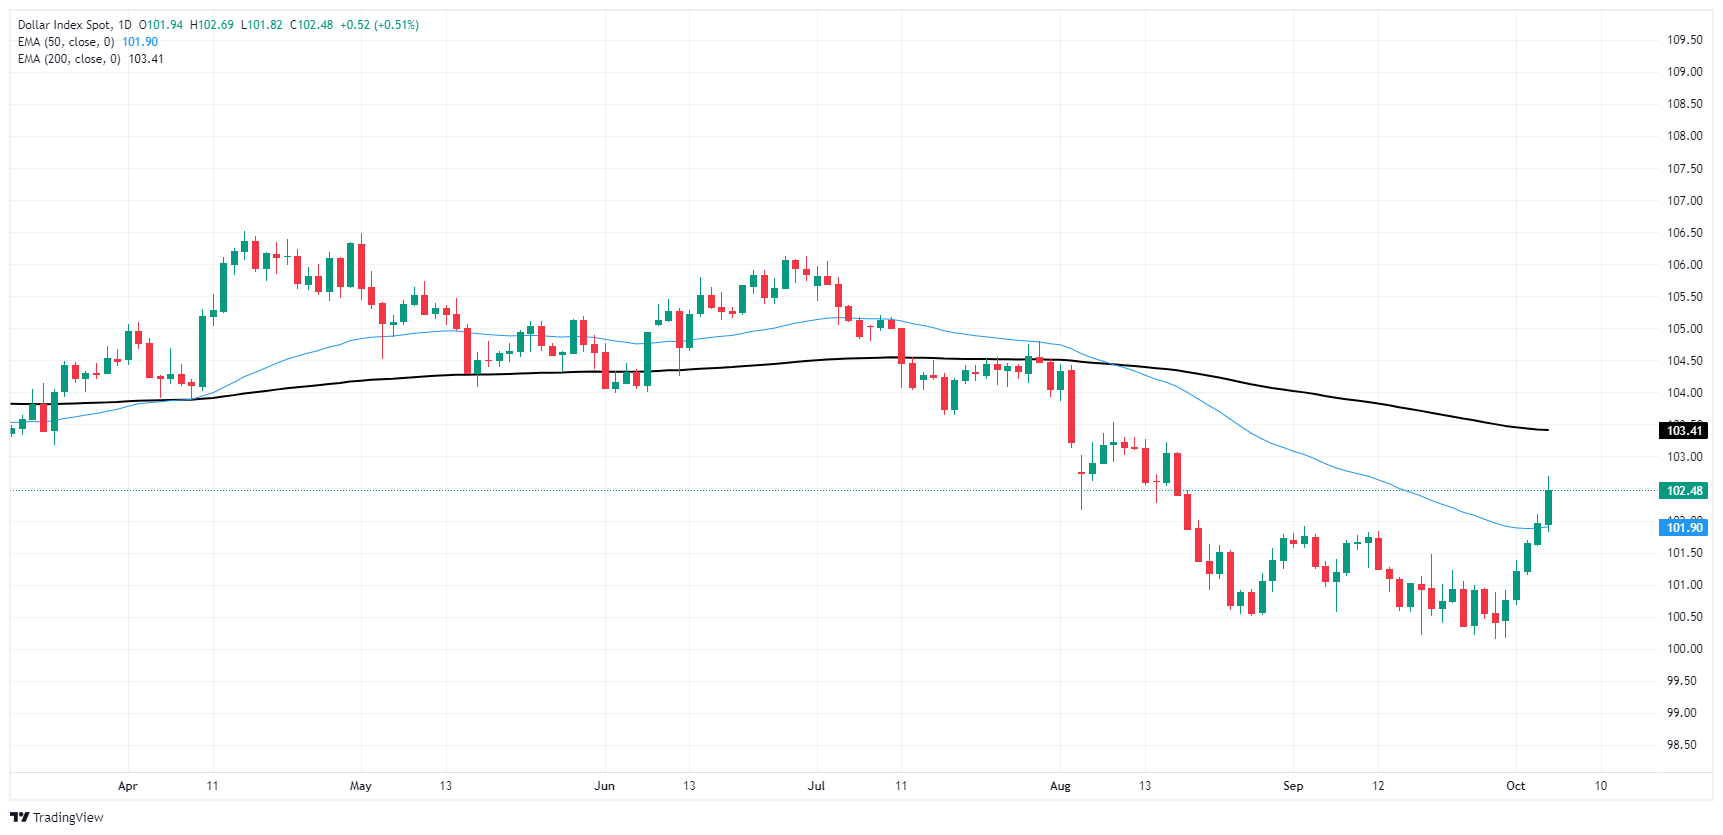
US Dollar FAQs
The US Dollar (USD) is the official currency of the United States of America, and the ‘de facto’ currency of a significant number of other countries where it is found in circulation alongside local notes. It is the most heavily traded currency in the world, accounting for over 88% of all global foreign exchange turnover, or an average of $6.6 trillion in transactions per day, according to data from 2022. Following the second world war, the USD took over from the British Pound as the world’s reserve currency. For most of its history, the US Dollar was backed by Gold, until the Bretton Woods Agreement in 1971 when the Gold Standard went away.
The most important single factor impacting on the value of the US Dollar is monetary policy, which is shaped by the Federal Reserve (Fed). The Fed has two mandates: to achieve price stability (control inflation) and foster full employment. Its primary tool to achieve these two goals is by adjusting interest rates. When prices are rising too quickly and inflation is above the Fed’s 2% target, the Fed will raise rates, which helps the USD value. When inflation falls below 2% or the Unemployment Rate is too high, the Fed may lower interest rates, which weighs on the Greenback.
In extreme situations, the Federal Reserve can also print more Dollars and enact quantitative easing (QE). QE is the process by which the Fed substantially increases the flow of credit in a stuck financial system. It is a non-standard policy measure used when credit has dried up because banks will not lend to each other (out of the fear of counterparty default). It is a last resort when simply lowering interest rates is unlikely to achieve the necessary result. It was the Fed’s weapon of choice to combat the credit crunch that occurred during the Great Financial Crisis in 2008. It involves the Fed printing more Dollars and using them to buy US government bonds predominantly from financial institutions. QE usually leads to a weaker US Dollar.
Quantitative tightening (QT) is the reverse process whereby the Federal Reserve stops buying bonds from financial institutions and does not reinvest the principal from the bonds it holds maturing in new purchases. It is usually positive for the US Dollar.
추천 기사


