


US Dollar Index Price Forecast: The calm before the next bull move
- The US Dollar trades lower ahead of the US CPI data for October.
- US President Trump signals fresh order of military attacks on Iran are highly unlikely.
- Lower oil prices have kept the US Dollar under pressure.
The US Dollar (USD) is broadly under pressure against its peers amid lower oil prices due to United States (US)-Iran deal hopes.
In the European session on Tuesday, the US Dollar Index (DXY), which gauges the Greenback’s value against six major currencies, holds onto its previous day’s losses near 101.67. Meanwhile, the WTI Oil price has posted a fresh 10-week low near $84.20.
Analysts at MUFG said in a note that investor optimism has been buoyed by a softer tone from Washington over the weekend, after President Donald Trump told CNN it is “highly unlikely” he will need to order fresh military strikes on Iran if talks continue to show progress.
However, MUFG cautioned that US President Trump also stressed the outcome still hinges on the quality of any deal, stating that “it depends on whether or not they sign a very strong agreement,” a nuance the bank sees as crucial for sustaining the recent pullback in geopolitical risk premia.
Lower oil prices result in an erosion in the appeal of currencies from economies, such as the US, which are bet energy exporter.
On the domestic front, investors keenly await the US Consumer Price Index (CPI) data for October, which will be published at 13:30 GMT.
Fed focus turns to inflation spillovers as core CPI surprises ease
Analysts at MUFG/BTMU highlight that both market participants and the Fed will be watching this week’s US inflation release “closely for evidence of spillover effects from higher energy prices.” They note that “recent core CPI readings have surprised to the upside over the last couple of months,” which has in turn “putting pressure on the Fed to tighten policy.” However, MUFG/BTMU point out that the immediate risk may be moderating, as “consensus expectations are looking for a softer core CPI print of 0.2%M/M in October,” suggesting some scope for inflation momentum to cool even as policymakers remain alert to energy-related pass-through.
US Dollar Index Technical Analysis
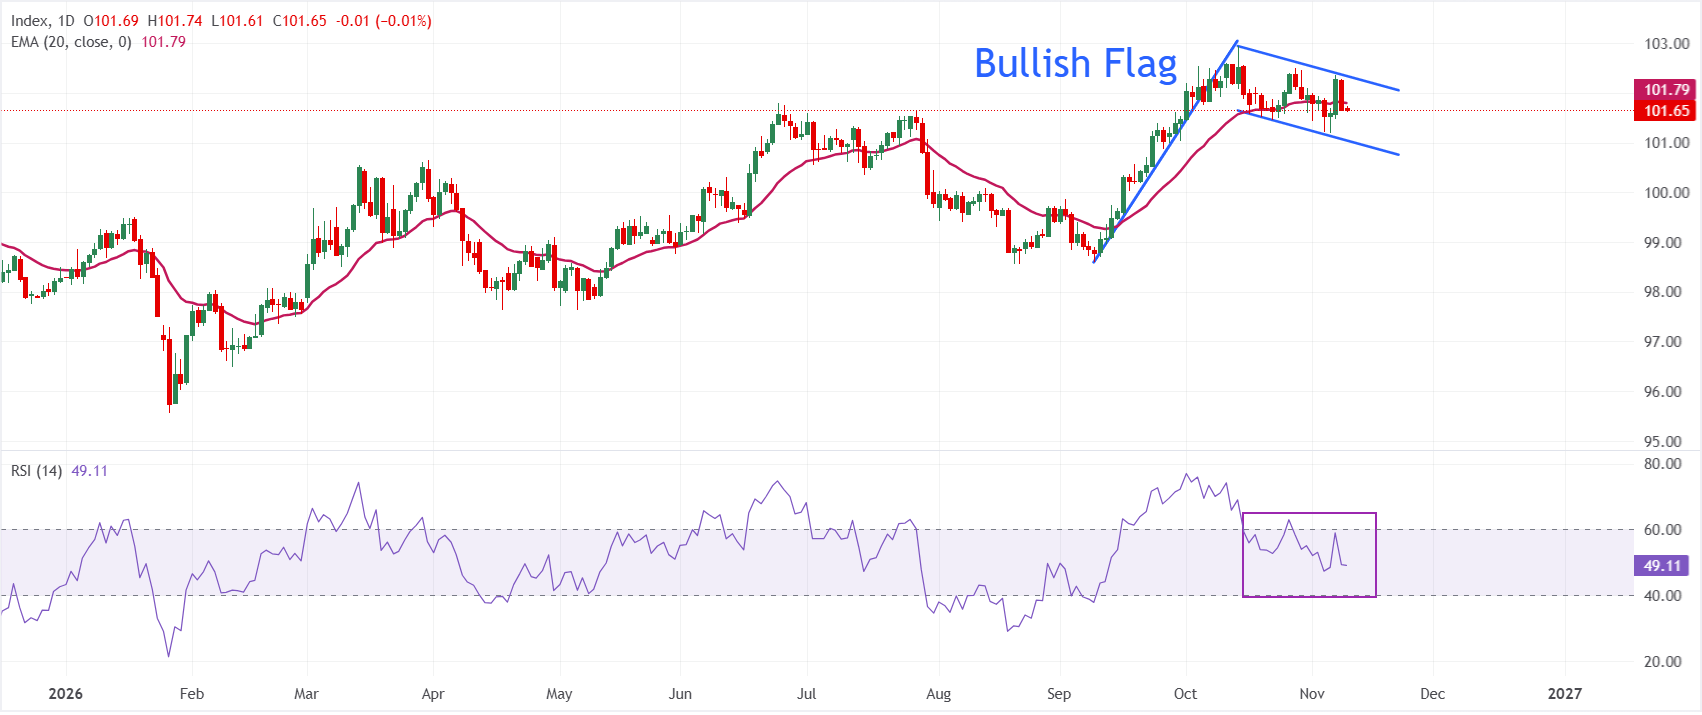
In the daily chart, Dollar Index Spot trades at 101.65, keeping a neutral tone as it trades close to the 20-period exponential moving average (EMA) at 101.79.
The Relative Strength Index (RSI) near 49 hints at neutral momentum that does little to offset the current structural pressure.
The formation of the Bullish Flag chart pattern suggests that the neutral trend is a calm before the next bull move, which is historically seen in the pattern.
On the topside, immediate resistance is seen at the 20-EMA around 101.79, followed by the reclaimed trend-line zone near 102.20, where sellers could look to defend the broader corrective structure. A break above the corrective structure would increase the likelihood that the index could revisit its yearly high near 103.00.
(The technical analysis of this story was written with the help of an AI tool. Know more.)
US Dollar FAQs
The US Dollar (USD) is the official currency of the United States of America, and the ‘de facto’ currency of a significant number of other countries where it is found in circulation alongside local notes. It is the most heavily traded currency in the world, accounting for over 88% of all global foreign exchange turnover, or an average of $6.6 trillion in transactions per day, according to data from 2022. Following the second world war, the USD took over from the British Pound as the world’s reserve currency. For most of its history, the US Dollar was backed by Gold, until the Bretton Woods Agreement in 1971 when the Gold Standard went away.
The most important single factor impacting on the value of the US Dollar is monetary policy, which is shaped by the Federal Reserve (Fed). The Fed has two mandates: to achieve price stability (control inflation) and foster full employment. Its primary tool to achieve these two goals is by adjusting interest rates. When prices are rising too quickly and inflation is above the Fed’s 2% target, the Fed will raise rates, which helps the USD value. When inflation falls below 2% or the Unemployment Rate is too high, the Fed may lower interest rates, which weighs on the Greenback.
In extreme situations, the Federal Reserve can also print more Dollars and enact quantitative easing (QE). QE is the process by which the Fed substantially increases the flow of credit in a stuck financial system. It is a non-standard policy measure used when credit has dried up because banks will not lend to each other (out of the fear of counterparty default). It is a last resort when simply lowering interest rates is unlikely to achieve the necessary result. It was the Fed’s weapon of choice to combat the credit crunch that occurred during the Great Financial Crisis in 2008. It involves the Fed printing more Dollars and using them to buy US government bonds predominantly from financial institutions. QE usually leads to a weaker US Dollar.
Quantitative tightening (QT) is the reverse process whereby the Federal Reserve stops buying bonds from financial institutions and does not reinvest the principal from the bonds it holds maturing in new purchases. It is usually positive for the US Dollar.
추천 기사


