


WTI trades weakly below $85 on US-Iran deal hopes
- The oil price is close to its 10-week low of $84.25 on hopes of US-Iran deal.
- US President Trump said that fresh military attacks on Iran are “highly unlikely”.
- Democrats have indicated that they would argue limiting funding for Iran war.
West Texas Intermediate (WTI), futures on NYMEX, is down 1.5% slightly below $85.00 during the Asian trade on Tuesday. The oil price is close to its 10-week low of $84.25 posted on Monday.
Oil prices face a significant selling pressure amid increased hopes of a deal between the United States (US) and Iran.
Oil sentiment steadies as US-Iran rhetoric turns less confrontational
Analysts at MUFG note that investor optimism has been further buoyed over the weekend by a softer tone from Washington, after President Trump told CNN it is “highly unlikely” he will need to order fresh military strikes on Iran if talks continue to show progress. MUFG highlights that Trump also stressed the outcome still hinges on the quality of any deal, stating that “it depends on whether or not they sign a very strong agreement,” a nuance the bank sees as crucial for sustaining the recent pullback in geopolitical risk premia.
Energy prices have been under immense pressure since the outcome of the United States (US) midterm elections, in which Democrats won in both the House and the Senate. This also increased hopes of US-Iran deal, with expectations that Democrats would limit Washington’s funding to support more military actions against Iran.
“We are going to end the war. We have some Republicans already who have joined us in ending the war, and the Founding Fathers had the power of the purse as one of the ways of deterring a president who does war without the consent of the American people,” Senate Minority Leader Chuck Schumer (D-N.Y.) said last week, The Hill reported.
WTI Technical Analysis
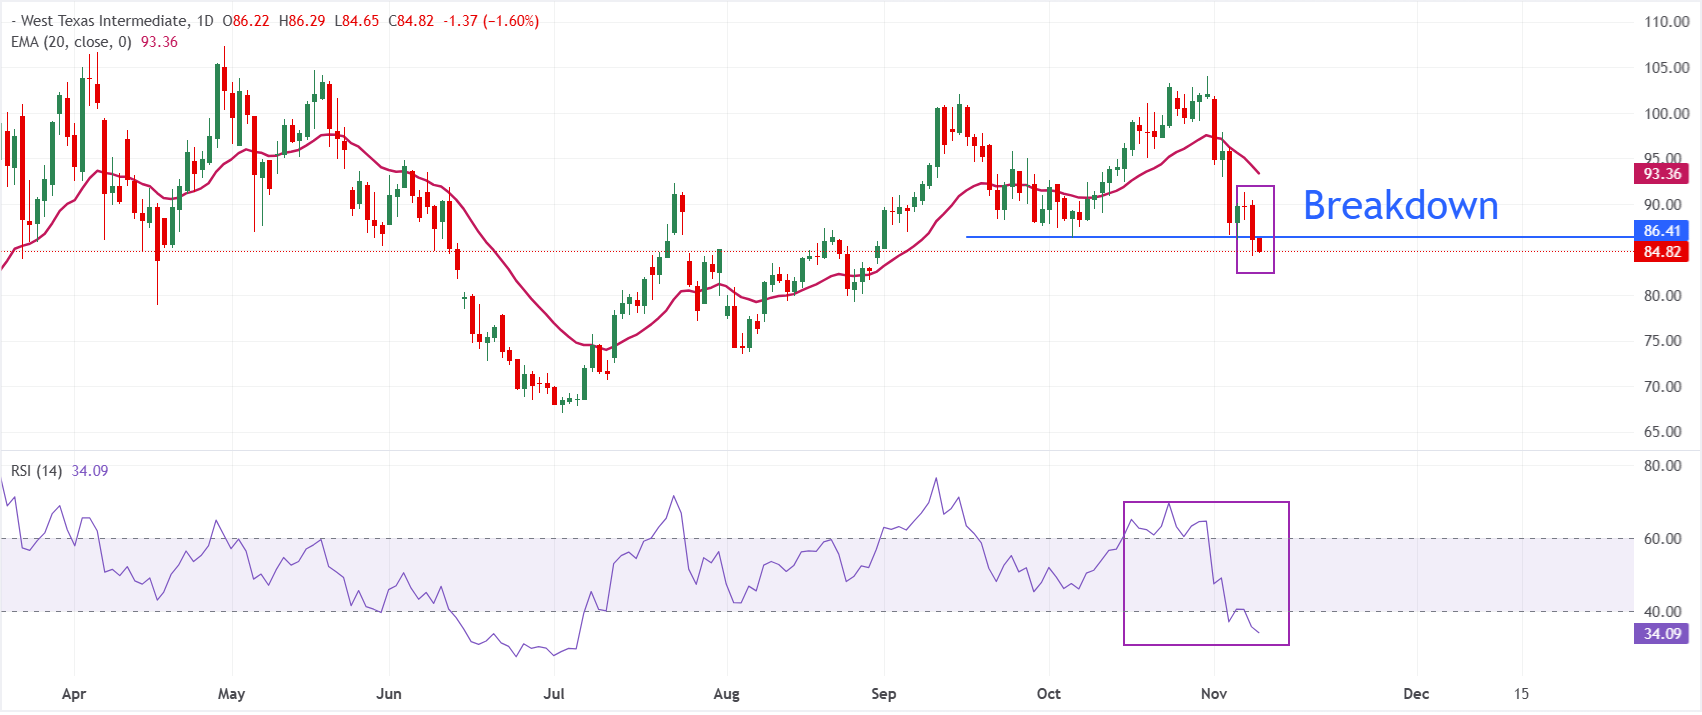
In the daily chart, WTI US Oil trades at $84.81. The near-term bias stays bearish as price holds well beneath the 20-day Exponential Moving Average (EMA) at $93.36, highlighting a market capped by overhead trend resistance after the recent pullback from above $100. Also, a fresh lower low formation after the breakdown of the October 6 low at $86.32 backs the bearish bias.
The Relative Strength Index (RSI) at 34 hovers just above oversold territory, which suggests downside momentum is still in play, though the pace of the decline could begin to moderate if selling pressure eases.
On the topside, the October 6 low at $86.32 and the $90.00 level are key barriers before the 20-day EMA at $93.36 as ultimate resistance. Looking down, key support levels are August 28 high at $83.11 and the August 26 low at $79.28, respectively.
(The technical analysis of this story was written with the help of an AI tool. Know more.)
WTI Oil FAQs
WTI Oil is a type of Crude Oil sold on international markets. The WTI stands for West Texas Intermediate, one of three major types including Brent and Dubai Crude. WTI is also referred to as “light” and “sweet” because of its relatively low gravity and sulfur content respectively. It is considered a high quality Oil that is easily refined. It is sourced in the United States and distributed via the Cushing hub, which is considered “The Pipeline Crossroads of the World”. It is a benchmark for the Oil market and WTI price is frequently quoted in the media.
Like all assets, supply and demand are the key drivers of WTI Oil price. As such, global growth can be a driver of increased demand and vice versa for weak global growth. Political instability, wars, and sanctions can disrupt supply and impact prices. The decisions of OPEC, a group of major Oil-producing countries, is another key driver of price. The value of the US Dollar influences the price of WTI Crude Oil, since Oil is predominantly traded in US Dollars, thus a weaker US Dollar can make Oil more affordable and vice versa.
The weekly Oil inventory reports published by the American Petroleum Institute (API) and the Energy Information Agency (EIA) impact the price of WTI Oil. Changes in inventories reflect fluctuating supply and demand. If the data shows a drop in inventories it can indicate increased demand, pushing up Oil price. Higher inventories can reflect increased supply, pushing down prices. API’s report is published every Tuesday and EIA’s the day after. Their results are usually similar, falling within 1% of each other 75% of the time. The EIA data is considered more reliable, since it is a government agency.
OPEC (Organization of the Petroleum Exporting Countries) is a group of 12 Oil-producing nations who collectively decide production quotas for member countries at twice-yearly meetings. Their decisions often impact WTI Oil prices. When OPEC decides to lower quotas, it can tighten supply, pushing up Oil prices. When OPEC increases production, it has the opposite effect. OPEC+ refers to an expanded group that includes ten extra non-OPEC members, the most notable of which is Russia.
추천 기사


